In 2016 the Defense Science Board (DSB) identified energy as a critical enabler of future military operations. The DoD’s Strategic Capabilities Office (SCO) launched Project Pele with the objective to design, build, and demonstrate a prototype mobile nuclear reactor to provide reliable and resilient electric power, while minimizing risk of nuclear proliferation, environmental damage, or harm to nearby personnel or populations.
The Pele reactor will be the first electricity-generating Generation IV nuclear reactor built in the United States. Check out the DoD Office of the Under Secretary of Defense, Research and Engineering (OUSD(R&E)) website for the Project Pele Environmental Impact Statement (EIS) here: https://www.cto.mil/pele_eis/
The Pele reactor will use High-Assay, Low-Enriched Uranium (HALEU, <20% enriched) fuel in the form of TRstructural ISOtropic (TRISO) coated fuel pellets (each about the size of a poppy seed).
Cross-section of a TRISO particle, greatly magnified. Source: DOE
The reactor will be assembled and initially operated at the Idaho National Laboratory (INL), under the safety oversight of the Department of Energy (DOE). The Pele reactor is expected to be transportable by rail, truck or cargo aircraft.
Pele reactor modes of transportation. Source: GAO
There’s a good status update on Project Pele in a February 2023 article on the Energy Intelligence website, “Interview: Pentagon’s Jeff Waksman on Project Pele Microreactor,” at the following link: https://www.energyintel.com/00000186-7b02-d1cb-a3ee-ffbf32940000
This article provides a brief overview of the “mainstream” international plans to deliver the first large tokamak commercial fusion power plant prototype in the 2060 to 2070 timeframe. Then we’ll take a look at alternate plans that could lead to smaller and less expensive commercial fusion power plants being deployed much sooner, perhaps in the 2030s. These alternate plans are enabled by recent technical advances and a combination of public and private funding for many creative teams that are developing and testing a diverse range of fusion machines that may be developed in the near-term into compact, relatively low-cost fusion power plants.
1. Plodding down the long road to controlled nuclear fusion with ITER
Mainstream fusion development is focused on the construction of the International Thermonuclear Experimental Reactor (ITER), which is a very large magnetic confinement fusion machine. The 35-nation ITER program describes their reactor as follows: “Conceived as the last experimental step to prove the feasibility of fusion as a large-scale and carbon-free source of energy, ITER will be the world’s largest tokamak, with ten times the plasma volume of the largest tokamak operating today.” ITER is intended “to advance fusion science and technology to the point where demonstration fusion power plants can be designed.”
ITER is intended to be the first fusion experiment to produce a net energy gain (“Q”) from fusion. Energy gain is the ratio of the amount of fusion energy produced (Pfusion) to the amount of input energy needed to create the fusion reaction (Pinput). In its simplest form, “breakeven” occurs when Pfusion = Pinput and Q = 1.0. The highest value of Q achieved to date is 0.67, by the Joint European Torus (JET) tokamak in 1997.The ITER program was formally started with the ITER Agreement, which was signed on 21 November 2006.
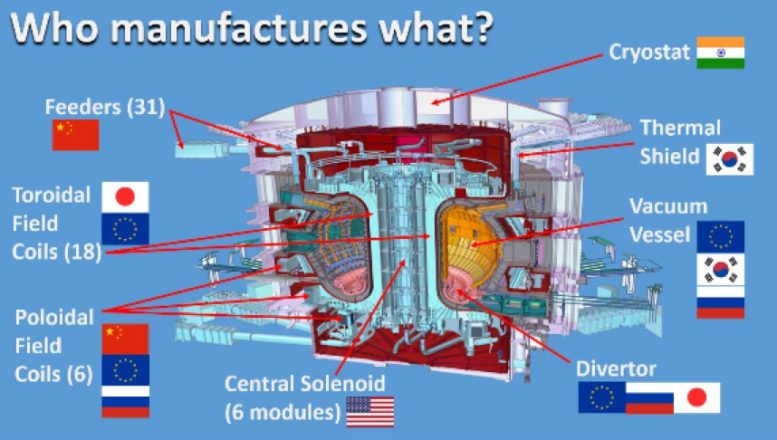
Nations contributing to the manufacture of major ITER components. Source: SciTechDaily (28 Jul 2020)
The official start of the “assembly phase” of the ITER reactor began on 28 July 2020. The target date of “first plasma” currently is in Q4, 2025. At that time, the reactor will be only partially complete. During the following ten years, construction of the reactor internals and other systems will be completed along with a comprehensive testing and commissioning program. The current goal is to start experiments with deuterium / deuterium-tritium (D/D-T) plasmas in December 2035.
After initial experiments in early 2036, there will be a gradual transition to fusion power production over the next 12 – 15 months. By mid-2037, ITER may be ready to conduct initial high-power demonstrations, operating at several hundred megawatts of D-T fusion power for several tens of seconds. This milestone will be reached more than 30 years after the ITER Agreement was signed.
Subsequent experimental campaigns will be planned on a two-yearly cycle. The principal scientific mission goals of the ITER project are:
Produce 500 MW of energy from fusion while using only 50 MW of energy for input heating, yielding Q ≥ 10
Demonstrate Q ≥ 10 for burn durations of 300 – 500 seconds (5.0 – 8.3 minutes)
Demonstrate long-pulse, non-inductive operation with Q ~ 5 for periods of up to 3,000 seconds (50 minutes).
All that energy will get absorbed in reactor structures, with some of it being carried off in cooling systems. However, ITER will not generate any electric power from fusion.
The total cost of the ITER program currently is estimated to be about $22.5 billion. In 2018, Reuters reported that the US had given about $1 billion to ITER so far, and was planning to contribute an additional $500 million through 2025. In Fiscal Year 2018 alone, the US contributed $122 million to the ITER project.
You’ll find more information on the ITER website, including a detailed timeline, at the following link: https://www.iter.org
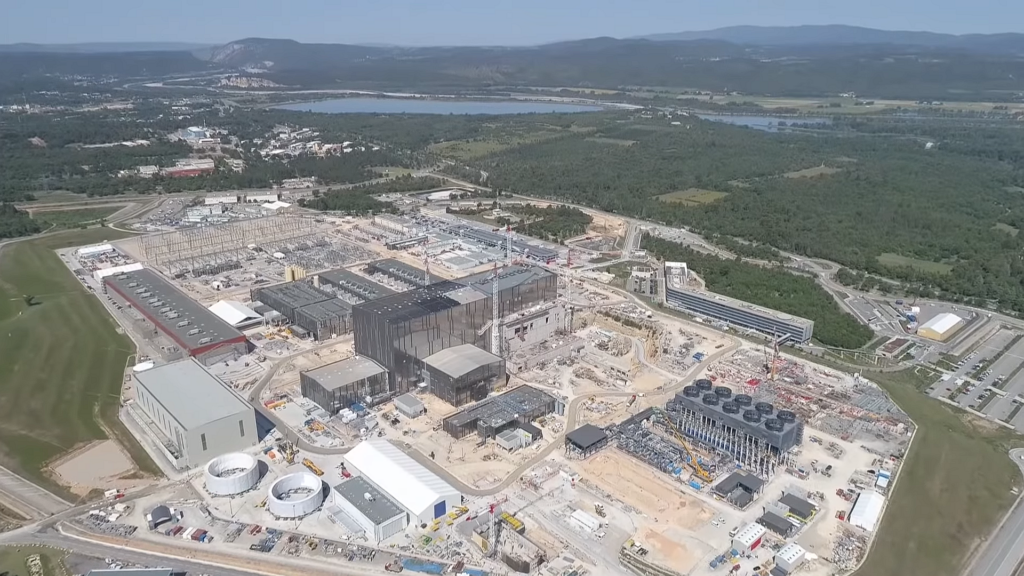
The ITER site in 2020, being built next to the Cadarache facility in Saint-Paul-lès-Durance, in Provence, southern France. Source: Macskelek via Wikipedia
2. Timeline for a commercial fusion power plant based on ITER
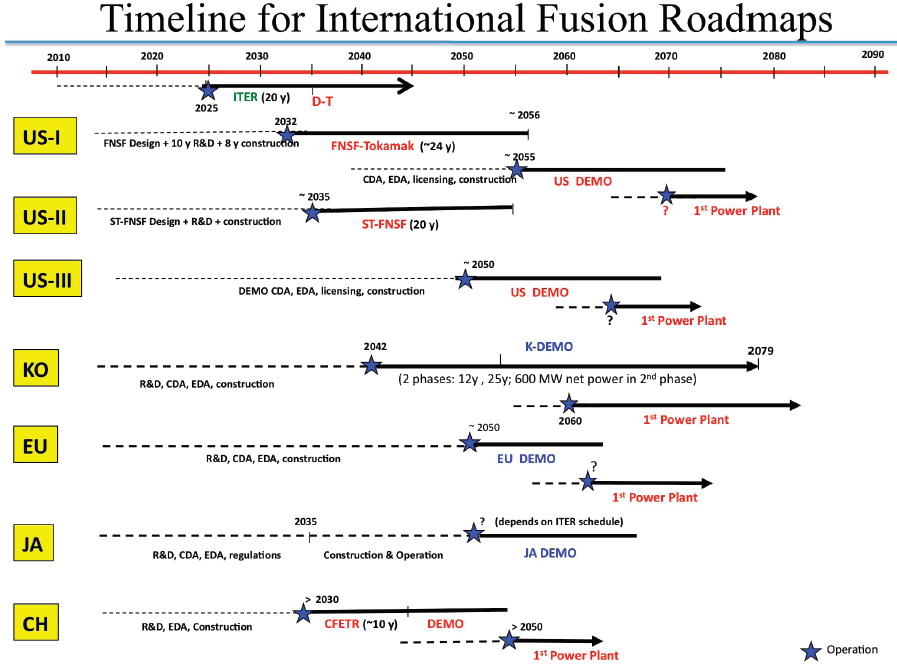
In December 2018, a National Academy of Sciences, Engineering & Medicine (NASEM) committee issued a report that included the following overview of timelines for fusion power deployment based on previously studied pathways for developing fusion power plants derived from ITER. The timelines for the USA, South Korea, Europe, Japan and China are shown below.
Source: “A Strategic Plan for U.S. Burning Plasma Research” (NASEM, 2019)
All of the pathways include plans for a DEMO fusion power plant (i.e., a prototype with a power conversion system) that would start operation between 2050 and 2060. Based on experience with DEMO, the first commercial fusion power plants would be built a decade or more later. You can see that, in most cases, the first commercial fusion power plant is not projected to begin operation until the 2060 to 2070 timeframe.
3. DOE is helping to build a fork in the road
Fortunately, a large magnetic confinement tokamak like ITER is not the only route to commercial fusion power. However, ITER currently is consuming a great deal of available resources while the promise of fusion power from an ITER-derived power plant remains an elusive 30 years or more away, and likely at a cost that will not be commercially viable.
Since the commitment was made in the early 2000s to build ITER, there have been tremendous advances in power electronics and advanced magnet technologies, particularly in a class of high temperature superconducting (HTS) magnets known as rare-earth barium copper oxide (REBCO) magnets that can operate at about 90 °K (-297 °F), which is above the temperature of liquid nitrogen (77 °K; −320 °F). These technical advances contribute to making ITER obsolete as a path to fusion power generation.
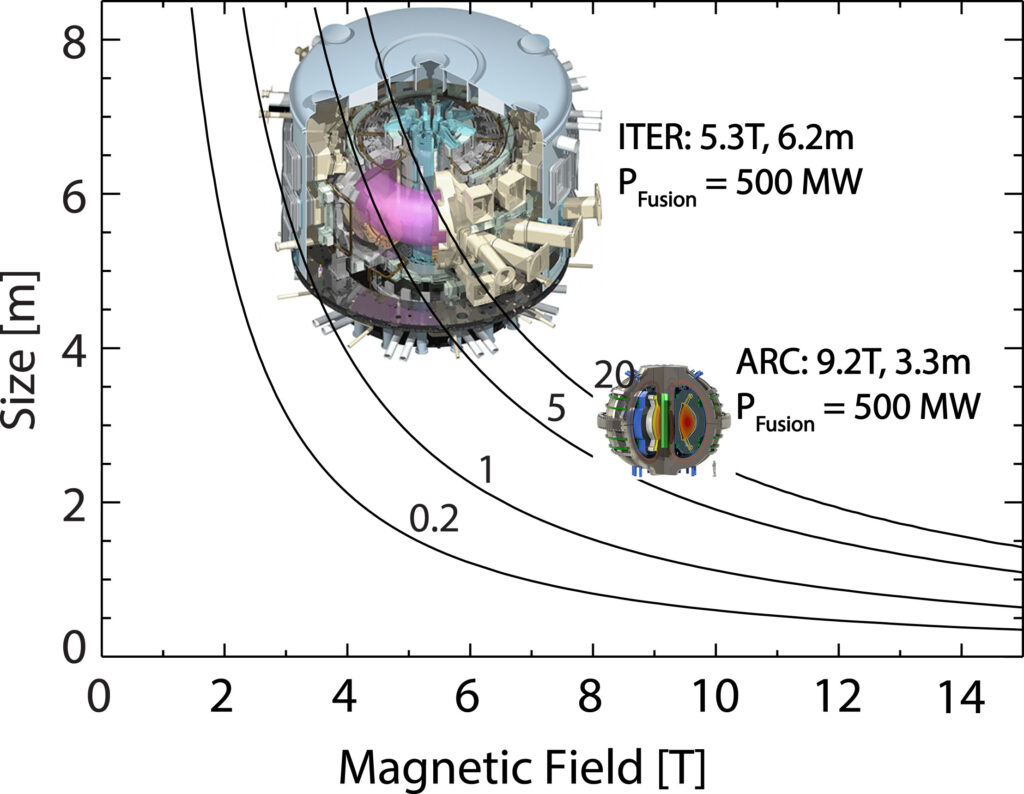
A 2019 paper by Martin Greenwald describes the relationship of constant fusion gain (Q = Pfusion / Pinput) to the magnetic field strength (B) and the plasma radius (R) of a tokamak device. As it turns out, Q is proportional to the product of B and R, so, for a constant gain, there is a tradeoff between the magnetic field strength and the size of the fusion device. This can be seen in the comparison between the relative field strengths and sizes of ITER and ARC (a tokomak being designed now), which are drawn to scale in the following chart.
Contours of constant fusion gain (Q) plotted against magnetic field strength (T, Tesla) and device size (plasma radius in meters): Source: Greenwald (2019)
ITER has lower field strength conventional superconducting magnets and is much larger than ARC, which has much higher field strength HTS magnets that enable its compact design. Greenwald explains, “With conventional superconductors, the region of the figure above 6T was inaccessible; thus, ITER, with its older magnet technology, is as small as it could be.” So, ITER will be a big white elephant, useful for scientific research, but likely much less useful on the path to fusion power generation than anyone expected when they signed the ITER Agreement in 2006.
For the past decade, there has been increasing interest in, and funding for, developing lower cost, compact fusion power plants using any fusion technology that can deliver a useful power generation capability at an commercially viable cost. Department of Energy’s (DOE) Advanced Research Project Agency – Energy (ARPA-E) has recommended the following cost targets for such a commercial fusion power plant:
Overnight capital cost of < US $2 billion and < $5/W
At $5/W, the upper limit would be a 400 MWe fusion power plant.
Since 2014, DOE has created a series of funding programs for fusion R&D projects to support development of a broad range of compact, low-cost fusion power plant design concepts. This was a significant change for the DOE fusion program, which has been contributing to ITER and a whole range of other fusion-related projects, but without a sense of urgency for delivering the technology needed to develop and operate commercial fusion power plants any time soon. Now, a small part of the DOE fusion budget is focused on resolving some of the technical challenges and de-risking the path forward sooner rather than later, and thereby improving the investment climate to the point that investors become willing to contribute to the development of small, low-cost fusion power plants that may be able to produce electrical power within the next decade or two.
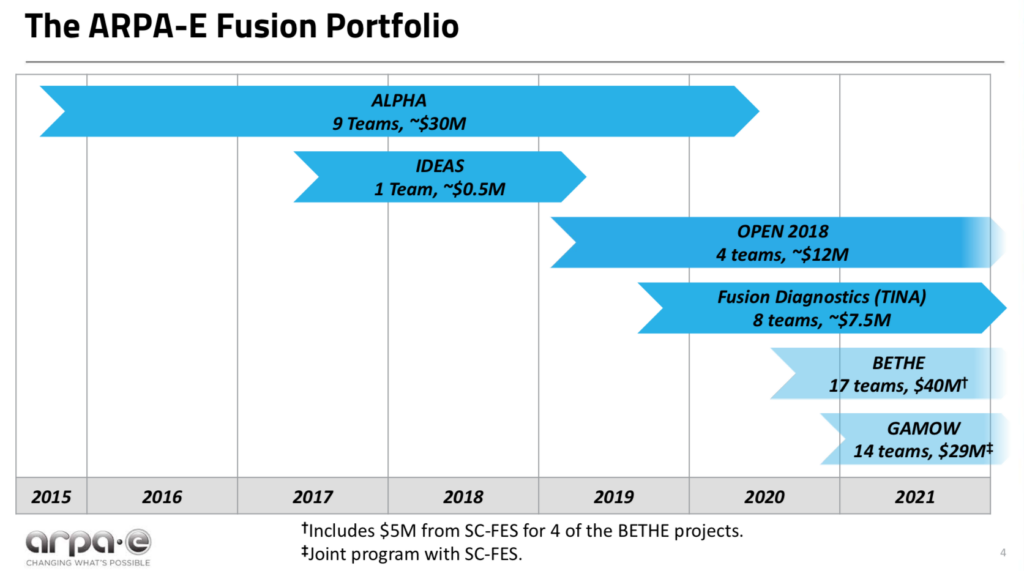
These DOE R&D programs are administered ARPA-E and the Office of Science, Fusion Energy Sciences (FES).
ARPA-E advances high-potential, high-impact energy technologies that are too early for private-sector investment. The ARPA-E fusion R&D programs are named ALPHA, IDEAS, BETHE, TINA and GAMOW. ARPA-E jointly funds the GAMOW fusion R&D program and part of the BETHE program with FES. In addition, the ARPA-E OPEN program makes R&D investments in the entire spectrum of energy technologies, including fusion.
FES is the largest US federal government supporter of research that is addressing the remaining obstacles to commercial fusion power. The FES fusion R&D program is named INFUSE. In addition FES jointly funds GAMOW and part of BETHE with ARPA-E.
Here’s an overview of these DOE programs.
DOE ARPA-E ALPHA program (2015 – 2020)
In 2015, ARPA-E initiated a five-year, $30 million research program into lower-cost approaches to producing electric power from fusion. This was known as the ALPHA program (Accelerating Low-Cost Plasma Heating and Assembly). The goal was to expand the range of potential technical solutions for generating power from fusion, focusing on small, low-cost, pulsed magneto-inertial fusion (MIF) devices.
There were nine program participants in the ALPHA program. Helion Energy ($3.97 million) and MIFTI ($4.60 million) were among the private fusion reactor firms receiving ALPHA awards. Los Alamos National Laboratory (LANL) received $6.63 million to fund the Plasma Liner Experiment (PLX-α) team, which included the private firm HyperV Technologies Corp.
In 2018, ARPA-E asked JASON to assess its accomplishments on the ALPHA program and the potential of further investments in this field. Among their findings, JASON reported that MIF is a physically plausible approach to controlled fusion and, in spite of very modest funding to date, some particular approaches are within a factor of 10 of scientific break-even. JASON also recommended supporting all promising approaches, while giving near-term priority to achieving breakeven (Q ≥ 1) in a system that can be scaled up to be commercial power plant. You can read the November 2018 JASON report here: https://fas.org/irp/agency/dod/jason/fusiondev.pdf
DOE ARPA-E IDEAS program (2017 – 2019)
The ARPA-E IDEAS program (Innovative Development in Energy-Related Applied Science) provides support of early-stage applied research to explore pioneering new concepts with the potential for transformational and disruptive changes in any energy technology. IDEAS awards are restricted to a maximum of $500,000 in funding. There have been 59 IDEAS awards for a broad range of energy-related technologies, largely to national laboratories and universities.
There was one fusion-related IDEAS award to the University of Washington ($482 k).
DOE ARPA-E OPEN program (2018)
In 2018, ARPA-E issued its fourth OPEN funding opportunity designed to catalyze transformational breakthroughs across the entire spectrum of energy technologies, including fusion. OPEN 2018 is a $199 million program funding 77 projects.
Four fusion-related projects were funded for a total of about $12 million. ZAP Energy ($6.77 million), CTFusion ($3.0 million) and Princeton Fusion Systems ($1.1 million) were among the private fusion reactor firms receiving OPEN 2018 awards.
DOE ARPA-E TINA Fusion Diagnostics program (2019 – 2021)
The TINA program established diagnostic “capability teams” to support state-of-the-art diagnostic system construction/deployment and data analysis/interpretation on ARPA-E-supported fusion experiments. This program awarded $7.5 million to eight teams, primarily from national laboratories and universities.
DOE ARPA-E BETHE program (2020 – 2024)
DOE’s ARPA-E also runs the BETHE program (Breakthroughs Enabling THermonuclear-fusion Energy), which is a $40 million program that aims to deliver a large number of lower-cost fusion concepts at higher performance levels. BETHE R&D is focused in the following areas:
Concept development to advance the performance of inherently lower cost but less mature fusion concepts.
Component technology development that could significantly reduce the capital cost of higher cost, more mature fusion concepts.
Capability teams to improve/adapt and apply existing capabilities (e.g., theory/modeling, machine learning, or engineering design/fabrication) to accelerate the development of multiple concepts.
ZAP Energy ($1 million) and Commonwealth Fusion Systems ($2.39 million) were among the private fusion reactor firms directly receiving BETHE awards.
The following awards were made to universities or national laboratories working with teams that include a significant role for a private fusion reactor firm:
University of Washington received $1.5 million for improving IDCD plasma control, which is applicable to their collaborative work with CTFusion on the Dynomak fusion reactor concept.
LANL received $4.62 million to fund the Plasma Liner Experiment (PLX-α) team, which includes HyperJet
DOE ARPA-E / FES GAMOW program (2020 – 2024)
Yet another DOE funding program for fusion research is named GAMOW (Galvanizing Advances in Market-Aligned Fusion for an Overabundance of Watts), which is a $29 million program announced in February 2020. GAMOW is jointly funded and overseen by ARPA-E and FES. GAMOW program focuses on the following three areas:
Technologies and subsystems between the fusion plasma and balance of plant.
Princeton Fusion Systems ($1.1 million) was among the private fusion reactor firms receiving GAMOW awards.
DOE FES INFUSE program (2020 – present)
The DOE FES INFUSE program (Innovation Network for Fusion Energy) was created to “accelerate fusion energy development in the private sector by reducing impediments to collaboration involving the expertise and unique resources available at DOE laboratories.” ….”DOE-FES will accept basic research applications focused on innovation that support production and utilization of fusion energy (e.g., for generation of electricity, supply of process heat, etc.)….”
In Fiscal Years 2020 and 2021, the INFUSE program annual budget was $4 million. INFUSE is a cost sharing program with DOE-FES funding 80% of a project’s cost and the award recipient funding the remaining 20%. The DOE-FES INFUSE program home page is here: https://infuse.ornl.gov
So far, there have been three rounds of INFUSE awards. I think you will find that it is much more difficult to find detailed information on the DOE FES INFUSE awards, which are administered by Oak Ridge National Laboratory (ORNL), than it is to find information on any of the DOE ARPA-E program. Here’s a brief INFUSE summary.
1st round FY 2020: On 15 October 2019, DOE announced the first INFUSE awards, which provided funding for 12 projects with representation from six private companies partnering with six national laboratories. The six private firms included: Commonwealth Fusion Systems (4 awards) and TAE Technologies, Inc. (3 awards)
2nd round FY 2020: On 3 September 2020, DOE announced funding for 10 projects. The private firms included: Commonwealth Fusion Systems (3 awards), TAE Technologies, Inc. (1 award), Tokamak Energy, Inc. (UK, 3 awards), and General Fusion Corp. (Canada, 1 award).
1st round FY 2021: On 3 December 2020, DOE announced funding 10 projects in a second round of FY 2021 INFUSE awards. The private firms receiving awards included: Commonwealth Fusion Systems (1 award), General Fusion Corp. (Canada, 1 award), MIFTI (1 award), Princeton Fusion Systems (1 award), TAE Technologies, Inc. (2 awards), Tokamak Energy, Inc. (UK, 2 awards).
DOE-FES has issued a call for new proposals for FY 2021 INFUSE awards. The closing date for submissions is 26 February 2021.
So far, these ARPA-E and FES programs have committed about $127 million in public funds to 77 different projects between 2014 and 2021. While some of the awards are sizeable ($5 – 6 million), many are very modest awards. The DOE total for all small (non-mainstream) fusion projects over a seven year period is about the same amount as the annual US contribution to the ITER program, which isn’t going lead to a fusion power plant in my lifetime, if ever.
While DOE has been kind enough to create the fork in the road, they do not have the deployable financial resources to push on to the next step of actually building prototypes of commercial fusion power plants in the near term.
4. A roadmap for achieving commercial fusion sooner
In 2019 and 2021, the National Academies and DOE-FES, respectively, published the recommendations of committees that were charged with defining the path(s) forward for the US to achieve commercial fusion power. In both cases, the committee recommended continued support for ITER while urging the US to proceed with a separate national program that encourages and supports public-private partnerships to build compact power plants that produce electricity from fusion at the lowest possible capital cost. These committee reports are briefly summarized below.
National Academies: “Final Report of the Committee on a Strategic Plan for U.S. Burning Plasma Research” (2019)
In December 2018, a National Academy of Sciences, Engineering & Medicine (NASEM) committee issued a report entitled, “A Strategic Plan for U.S. Burning Plasma Research.”
As noted previously, the NASEM report described the current path forward based on power plants derived largely from ITER technology. On this path, the first commercial fusion power plant is not projected to begin operation until the 2060 to 2070 timeframe.
The NASEM committee report is very important because it defines an alternate pathway (i.e., the fork in the road) that could deliver fusion power considerably sooner and at much lower capital cost.
The committee offered the following recommendations:
The US should remain an ITER partner. This is the most cost-effective way to gain experience with burning plasma at the scale of a power plant. However:
Significant R&D is required in addition to ITER to produce electricity from this type of fusion reactor.
ITER is too large and expensive to be economically competitive in the US market when compared to other carbon-neutral energy technologies.
The US should start a national program of accompanying research and technology leading to the construction of a compact pilot power plant that produces electricity from fusion at the lowest possible capital cost.
Effective application of US near-term R&D investments is critical, as other nations continue to invest in new fusion facilities that advance their own approaches.
DOE FES: “Powering the Future – Fusion & Plasmas” (2021)
In January 2021, DOE FES published a draft report from their Fusion Energy Sciences Advisory Committee (FESAC) entitled “Powering the Future – Fusion & Plasmas.” This draft report supports the NASEM committee recommendations and concluded that there are two viable paths to commercial fusion power:
Partnership in the ITER fusion project is essential for US fusion energy development, as is supporting the continued growth of the private sector fusion energy industry.
Public-private partnerships have the potential to reduce the time required to achieve commercially viable fusion energy.
The fusion pilot plant goal requires “a pivot toward research and development of fusion materials and other needed technology.” Several new experimental facilities were recommended.
As of late January 2021, the FESAC final report was in preparation. When available, it will be posted here: http://usfusionandplasmas.org
Funding at the fork in the road
At the fork in the road, the US will be hedging its bets and taking both paths, continuing to support ITER at the current level (about $125 million/year) while building new fusion experimental facilities and trying to place a stronger emphasis on timely development of compact fusion power plants through public-private partnerships as well as infusions of private capital.
In the years ahead, the DOE FES fusion budget is expected to be essentially flat, with growth at just a modest rate of 2%/year being among the likely range of budget scenarios. At the same time, FES will attempt to launch several new major fusion R&D facilities and related programs, as recommended by FESAC.
Without a significantly bigger budget authorization from Congress, the FES budget becomes a zero sum game. To create the budget for any of these new R&D facilities and programs, other part of the FES budget have to lose. In this constrained budget environment, I think FES funding for compact fusion power plant development will find stiff competition and will not be on a growth path.
Recall that ARPA-E’s role is to advance high-potential, high-impact energy technologies that are too early for private-sector investment. When major risk issues for a particular fusion reactor concept have been resolved to an appropriate level, funding from ARPA-E may be redirected to other higher risk matters waiting to be addressed.
While the NASEM and FESAC reports support public-private partnerships, the sheer magnitude of the funds required (many billions of dollars) to develop several small prototype fusion power plant designs in parallel exceeds DOE’s ability to fund the deals at the same level as the current 80% (DOE) / 20% (private) partnership deals. The FES annual budget for the past three years has been quite modest: $564 million (FY2019 enacted), $671 million (FY2020 enacted) and $425 million (FY2021 requested).
Making real progress toward deployment of operational fusion power plants will depend on billions of dollars in private / institutional capital being invested in the firms that will design and build the first small commercial fusion power plants.
I think DOE and the commercial fusion power industry are in a similar position to NASA and the commercial spaceflight industry two decades ago when Blue Origin (Jeff Bezos, 2000) and SpaceX (Elon Musk, 2002) were founded. At that time, the traditional route to space was via NASA. Two decades later, it’s clear that many commercial firms and their investors have contributed to building a robust low Earth orbit spaceflight industry that could never have been developed in that short time frame with NASA’s limited budget. In the next two decades, I think the same type of transition needs to occur in the relationship between DOE and the private sector fusion industry if we expect to reap the benefits of clean fusion power soon. It’s time for FES and the commercial fusion industry to confirm that they share a vision and a common aggressive timeline for bringing small commercial fusion power plants to the market. That point doesn’t come across in the FESAC report.
Private and institutional investors already making major investments in the emerging fusion energy market. As you might expect, some fusion firms have been much more successful than others in raising funds. You’ll find a summary of publically available funding information on the Fusion Energy Base website here: https://www.fusionenergybase.com/organization/commonwealth-fusion-systems
5. The US Navy also may be building a fork in the road
The Navy has been quietly developing its own concepts for compact fusion power plants. We’ll take a look at three recent designs. Could the Navy wind up being an important contributor to the development and deployment of commercial fusion power plants?
6. The race is on to beat ITER with smaller, lower-cost fusion
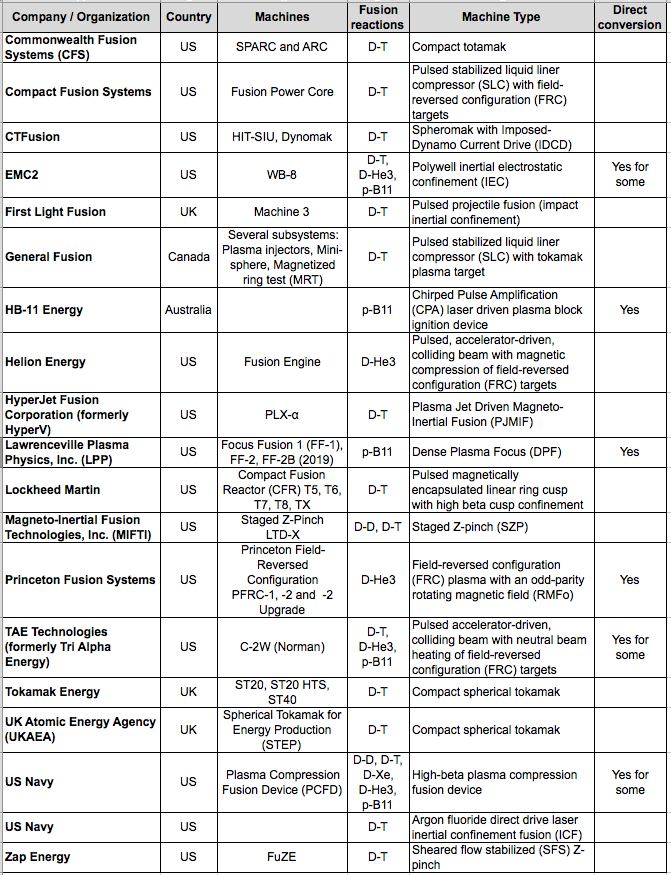
In this section, we’ll take a look at the status of the following small fusion power plant development efforts, mostly by private companies.
Collectively, they are applying a diverse range of technologies to the challenge of generating useful electric power from fusion at a fraction of the cost of ITER. Based on claims from the development teams, it appears that some of the compact fusion reactor designs are quite advanced and probably will be able to demonstrate a net energy gain (Q > 1.0) in the 2020s, well before ITER.
You’ll find details on these 18 organizations and their fusion reactor concepts in my separate articles at the following links:
There certainly are many different technical approaches being developed for small, lower-cost fusion power plants. Several teams are reporting encouraging performance gains that suggest that their particular solutions are on credible paths toward a fusion power plant. However, as of January 2021, none of the operating fusion machines have achieved breakeven, with Q = 1.0, or better. It appears that goal remains at least a few years in the future, even for the most advanced contenders.
The rise of private funding and public-private partnerships is rapidly improving the resources available to many of the contenders. Good funding should spur progress for many of the teams. However, don’t be surprised if one or more teams wind up at a technical or economic dead end that would not lead to a commercially viable fusion power plant. Yes, I think ITER is heading down one of those dead ends right now.
So, where does that leave us? The promise for success with a small, lower-cost fusion power plant is out there, and such power plants should win the race by a decade or more over an ITER-derived fusion power plant. While there are many contenders, which ones are the leading contenders for deploying a commercially viable fusion power plant?
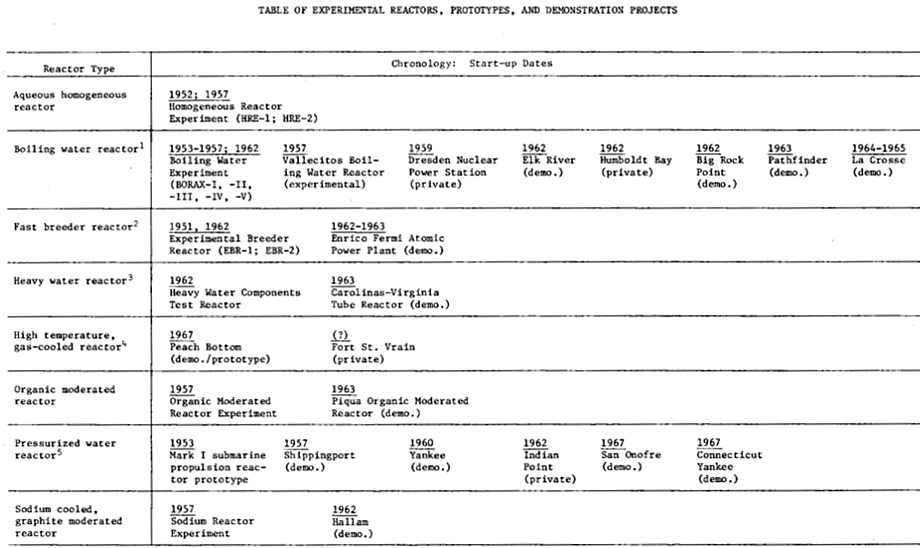
To give some perspective, it’s worth taking a moment to recall the earliest history of the US commercial nuclear power industry, which is recounted in detail for the period from 1946 – 1963 by Wendy Allen in a 1977 RAND report and summarized in the following table.
US fission demonstration power plants. Source: RAND R-2116-NSF
The main points to recognize from the RAND report are:
Eight different types of fission reactors were built as demonstration plants and tested. All of the early reactors were quite small in comparison to later nuclear power plants.
Some were built on Atomic Energy Commission (AEC, now DOE) national laboratory sites and operated as government-owned proof-of-principle reactors. The others were licensed by the AEC (now the Nuclear Regulatory Commission, NRC) and operated by commercial electric power utility companies. These reactors were important for building the national nuclear regulatory framework and the technical competencies in the commercial nuclear power and electric utility industries.
In the long run, only two reactor designs survived the commercial test of time and proved their long-term financial viability: the pressurized water reactor (PWR) and the boiling water reactor (BWR), which are the most common types of fission power reactors operating in the world today.
With the great variety of candidate fusion power plant concepts being developed today, we simply don’t know which ones will be the winners in a long-term competition, except to say that an ITER-derived power plant will not be among the winners. What we need is a national demonstration plant program for small fusion reactors. This means we need the resources to build and operate several different fusion power reactor designs soon and expect that the early operating experience will quickly drive the evolution of the leading contenders toward mature designs that may be successful in the emerging worldwide market for fusion power. The early fission reactor history shows that we should expect that some of the early fusion power plant designs won’t survive in the long-term fusion power market, for a variety of reasons.
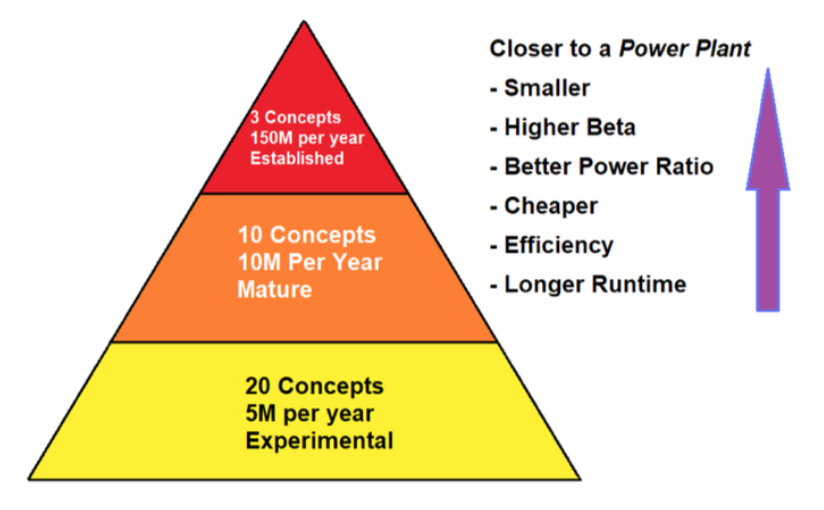
Matthew Moynihan, in his 2019 article, “Selling Fusion in Washington DC,” on The Fusion Podcast website, offered the following approach, borrowed from the biotech industry, to build a pipeline of credible projects while driving bigger investments into the more mature and more promising programs. Applying this approach to the current hodgepodge of DOE fusion spending would yield more focused spending of public money toward the goal of delivering small fusion power plants as soon as practical. The actual dollar amounts in the following chart can be worked out, but I think the basic principle is solid.
Source: The Fusion Podcast, 12 January 2019
With this kind of focus from DOE, the many contenders in the race to build a small fusion power plant could be systematically ranked on several parameters that would make their respective technical and financial risks more understandable to everyone, especially potential investors. With an unbiased validation of relative risks from DOE, the leading candidates in the US fusion power industry should be able to raise the billions of dollars that will be needed to develop their designs into the first wave of demonstration fusion power plants, like the US fission power industry did 60 to 70 years ago.
Perhaps Carly Anderson had the right idea when she suggested Fantasy Fusion as a way to introduce some fun into the uncertain world of commercial fusion power development and investment. You can read her September 2020 article here: https://medium.com/prime-movers-lab/fantasy-fusion-77621cc901e2
If you believe we’re coming into the home stretch, it’s not too late to place a real bet by actually investing in your favorite fusion team(s). It is risky, but the commercial fusion power trophy will be quite a prize! I’m sure it will come with some pretty big bragging rights.
C. L. Nehi, et al., “Retrospective of the ARPA-E ALPHA Fusion Program,” Journal of Fusion Energy, 38_506 – 521, 2019: https://www.osti.gov/biblio/1572943
In the U.S., tritium for nuclear weapons was one of several products produced by the Atomic Energy Commission (AEC) and its successor, the Department of Energy (DOE), during the Cold War. The machines for tritium production were water-cooled, graphite-moderated production reactors in Hanford, Washington, and heavy water cooled and moderated production reactors at the Savannah River Plant (SRP, now Savannah River Site, SRS) in South Carolina. Lithium “targets,” containing enriched lithium-6 produced at the Y-12 Plant in Oak Ridge Tennessee, were irradiated in these reactors to produce tritium. Later, tritium was extracted from the targets, purified and packaged for use in nuclear weapons in separate facilities, initially at Hanford and Los Alamos and later at Savannah River.
Today, tritium for the U.S. nuclear weapons stockpile is produced in light water cooled and moderated commercial pressurized water reactors (PWRs) owned and operated by the Tennessee Valley Authority (TVA). Tritium is extracted from the targets, purified and packaged for use in nuclear weapons at the Savannah River Site (SRS).
The following three timelines provide details on tritium production activities in the Cold War nuclear weapons complex:
Under the Manhattan Project and through the Cold War, the U.S. developed and operated a dedicated nuclear weapons complex that performed all of the functions needed to transform raw materials into complete nuclear weapons. After the end of the Cold War (circa 1991), U.S. and Russian nuclear weapons stockpiles were greatly reduced. In the U.S., the nuclear weapons complex contracted and atrophied, with some functions being discontinued as the associated facilities were retired without replacement, while other functions continued at a reduced level, many in aging facilities.
In its current state, the U.S. nuclear weapons complex is struggling to deliver an adequate supply of tritium to meet the needs specified by the National Nuclear Security Administration (NNSA) for “stockpile stewardship and maintenance,” or in other words, for keeping the nuclear weapons in the current, smaller stockpile safe and operational. Key issues include:
There have been no dedicated tritium production reactors operating since 1988. Natural radioactive decay has been steadily reducing the existing inventory of tritium.
Commercial light water reactors (CLWRs) have been put into dual-use service since 2003 to produce tritium for NNSA while generating electric power that is sold commercially. The current tritium production rate needs to increase significantly to meet needs.
There has been a continuing decline in the national inventory of “unobligated” (i.e., free from peaceful use obligations) low-enriched uranium (LEU) and high-enriched uranium (HEU). This unobligated uranium can be used for military purposes, such as fueling the dual-use tritium production reactors.
There has been no “unobligated” U.S. uranium enrichment capability since 2013. The technology for a replacement enrichment facility has not yet been selected.
The U.S. domestic uranium production industry has declined to a small fraction of the capacity that existed from the mid-1950s to the mid-1980s. About 10% of uranium purchases in 2018 were from U.S. suppliers, and 90% came from other countries. NNSA’s new enrichment facility will need a domestic source of natural uranium.
There has been no operational lithium-6 production facility since the late 1980s.
There has been a continuing decline in the national inventory of enriched lithium-6, which is irradiated in “targets” to produce tritium.
Only one tritium extraction facility exists.
The U.S. nuclear weapons complex for tritium production is relatively fragile, with several milestone dates within the next decade that must be met in order to reach and sustain the desired tritium production capacity. There is little redundancy within this part of the nuclear weapons complex. Hence, tritium production is potentially vulnerable to the loss of a single key facility.
This complex story is organized in this post as follows.
Two key materials – Tritium and Lithium
Cold War tritium production
Hanford Project P-10 (later renamed P-10-X) for tritium production (1949 to 1954)
Hanford N-Reactor Coproduct Program for tritium production (1963 to 1967)
Savannah River Plant tritium production (1954 to 1988)
Synopsis of U.S. Cold War tritium production
The Interregnum of U.S Tritium Production (1988 to 2003)
New Production Reactor (NPR) Program
Accelerator Tritium Production (ATP)
Tritium recycling
The U.S. commercial light water reactor (CLWR) tritium production program (2003 to present)
Structure of the CLWR program
What is a TPBAR?
Operational use of TPBARs in TVA reactors
Where will the uranium fuel for the TVA reactors come from?
Tritium, or hydrogen-3, is naturally occurring in extremely small quantities (10-18 percent of naturally occurring hydrogen) or it can be artificially produced at great cost. The current tritium price is reported to be about $30,000 per gram, making it the most expensive substance by weight in the world today.
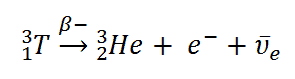
Tritium is a radioactive isotope of hydrogen with a half-life of 12.32 years. Tritium decays into helium-3 by means of negative beta decay, which also produces an electron (e–) and an electron antineutrino, as shown below.
Source: nuclear-power.net
Tritium is an important component of thermonuclear weapons. The tritium is stored in a small, sealed reservoir in each warhead.
With its relatively short half-life, the tritium content of the reservoir is depleted at a rate of 5.5% per year and must be replenished periodically. In 1999, DOE reported in DOE/EIS-0271 that none of the weapons in the U.S. nuclear arsenal would be capable of functioning as designed without tritium.
During the Cold War-era, the Atomic Energy Commission (AEC, and its successor in 1977, the Department of Energy, DOE) produced tritium for nuclear weapons in water-cooled, graphite-moderated production reactors in Hanford, Washington and in heavy water cooled and moderated production reactors at the Savannah River Plant (SRP, now Savannah River Site, SRS) in South Carolina. These reactors also produced plutonium, polonium and other nuclear materials. All of these production reactors were dedicated defense reactors except the dual-use Hanford-N reactor, which also could produce electricity for sale to the commercial power grid.
Tritium is produced by neutron absorption in a lithium-6 atom, which splits to form an atom of tritium (T) and an atom of helium-4. This process is shown below.
Natural lithium is composed of two stable isotopes; about 7.5% lithium-6 and 92.5% lithium-7. To improve tritium production, lithium-6 and lithium-7 are separated and the enriched lithium-6 is used to make “targets” that will be irradiated in nuclear reactors to produce tritium. The separated, enriched lithium-7 is a valuable material for other nuclear applications because of its very low neutron cross-section. Oak Ridge Materials Chemistry Division initiated work in 1949 to find a method to separate the lithium isotopes, with the primary goal of producing high purity lithium-7 for use in Aircraft Nuclear Propulsion (ANP) reactors.
Lithium-6 enrichment process development with a focus on tritium production began in 1950 at the Y-12 Plant in Oak Ridge, Tennessee. Three different enrichment processes would be developed with the goal of producing highly-enriched (30 to 95%) lithium-6: electric exchange (ELEX), organic exchange (OREX) and column exchange (COLEX). Pilot process lines (pilot plants) for all three processes were built and operated between 1951 and 1955.
Production-scale lithium-6 enrichment using the ELEX process was conducted at Y-12 from 1953 to 1956. The more efficient COLEX process operated at Y-12 from 1955 to 1963. By that time, a stockpile of enriched lithium-6 had been established at Oak Ridge, along with a stockpile of unprocessed natural lithium feed material.
The enriched lithium-6 material produced at Y-12 was shipped to manufacturing facilities at Hanford and Savannah River and incorporated into control rods and target elements that were inserted into a production reactor core and irradiated for a period of time.
After irradiation, these control rods and target elements were removed from the reactor and processed to recover the tritium that was produced. The recovered tritium was purified and then mixed with a specified amount of deuterium (hydrogen-2, 2H or D) before being loaded and sealed in reservoirs for nuclear weapons.
Tritium production at Hanford ended in 1967 and at Savannah River in 1988. The U.S. had no source of new tritium production for its nuclear weapons program between 1988 and 2003. During that period, tritium recycling from retired weapons was the primary source of tritium for the weapons remaining in the active stockpile. Finally, in 2003, the nation’s new replacement source of tritium for nuclear weapons started coming on line.
3. Cold War Tritium Production
3.1 Hanford Project P-10 (later renamed P-10-X) for tritium production (1949 to 1954)
The industrial process for producing plutonium for WW II nuclear weapons was conceived and built as part of the Manhattan Project. On 21 December 1942, the U.S. Army issued a contract to E. I. Du Pont de Nemours and Company (DuPont), stipulating that DuPont was in charge of designing, building and operating the future plutonium plant at a site still to be selected. The Hanford, Washington, site was selected in mid-January 1943.
Starting in 1949, the earliest work involving tritium production by irradiation of lithium targets in nuclear reactors was performed at Hanford under Project P-10 (later renamed P-10-X). By this time, DuPont had built and was operating four water-cooled, graphite-moderated production reactors at Hanford: B and D Reactors (1944), F Reactor (1945) and H Reactor (1949). Project P-10-X involved only the B and H Reactors, which were modified for tritium production.
Tritium was recovered from the targets in Building 108-B, which housed the first operational tritium extraction process line in the AEC’s nuclear weapons complex. The thermal extraction process employed started with melting the target material in a vacuum furnace and then collecting and purifying the tritium drawn off in the vacuum line. This tritium product was sent to Los Alamos for further processing and use.
Hanford site 100-B area. B Reactor is the tiered building near the center of the photo. The much smaller 108-B tritium extraction process line building is sitting alone on the right. Source: atomicarchive.com
Project P-10-X provided the initial U.S. tritium production capability from 1949 to 1954 and supplied the tritium for the first U.S. test of a thermonuclear device, Ivy Mike, in November 1952. Thereafter, most tritium production and all tritium extractions were accomplished at the Savannah River Plant.
DOE reported: “During its five years of operation, Project P-10-X extracted more than 11 million Curies (Ci) of tritium representing a delivered amount of product of about 1.2 kg.” For more details, see the report PNNL-15829, Appendix D: “Tritium Inventories Associated with Tritium Production,” which is available here:
3.2. Hanford N-Reactor Coproduct Program for tritium production (1963 to 1967)
This was a tritium production technology development program conducted in the mid-1960s. Its primary aim was not to produce tritium for the U.S. nuclear weapons program, but rather to develop technologies and materials that could be applied in tritium breeding blankets in fusion reactors. After an extensive review of candidate lithium-bearing target materials, the high melting point ceramic lithium aluminate (LiAlO2) was chosen.
Several fuel-target element designs were tested in-reactor, culminating in October 1965 with the selection of the “Mark II” design for use in the full-reactor demonstration. Targets were double-clad cylindrical elements with a lithium aluminate core. The first cladding layer was 8001 aluminum; the second (outer) cladding layer was Zircaloy-2.
Hanford N Coproduct Target Element. Source: BNWL-2097
During the N Reactor coproduct demonstration, four distinct production tests were run, the first two with small numbers of fuel and target columns being irradiated, and the last two runs with over 1,500 fuel and target columns containing about 17 tons LiAlO2. The last production test, PT-NR-87, recorded the highest N Reactor power level by operating at 4,800 MWt for 31 hours.
The irradiated target elements were shipped to SRP for tritium extraction using a thermal extraction process defined jointly by Pacific Northwest Laboratory (PNL, now Pacific Northwest National Laboratory, PNNL) and Savannah River Laboratories (SRL). The existing tritium extraction vacuum furnaces at SRP were used.
This completed the Hanford N Reactor Coproduct Program.
More details are available in PNNL report BNWL-2097, “Tritium Production from Ceramic Targets: A Summary of the Hanford Coproduct Program,” which is available at the following link:
This program provided important experience related to lithium aluminate ceramic targets for tritium production.
3.3. Savannah River Plant tritium production (1954 to 1988)
The Savannah River Plant (SRP) was designed in 1950 primarily for a military mission to produce tritium, and secondarily to produce plutonium and other special nuclear materials, including Pu-238. DuPont built five dedicated production reactors at the SRP and became operational between 1953 and 1955: the R reactor (prototype) and the later P, L, K and C reactors.
In 1955, the original maximum power of C Reactor was 378 MWt. With ongoing reactor and system improvements, C Reactor was operating at 2,575 MWt in 1960, and eventually was rated for a peak power of 2,915 MWt in 1967. The other SRP production reactors received similar reactor and system improvements. The increased reactor power levels greatly increased the tritium production capacity at SRP. You’ll find SRP reactor operating power history charts in Chapter 2 of “The Savannah River Site Dose Reconstruction Project -Phase II,” report at the following link:
Enriched lithium-6 product was sent from the Oak Ridge Y-12 Plant to SRP Building 320-M, where it was alloyed with aluminum, cast into billets, extruded to the proper diameter, cut to the required length, canned in aluminum and assembled into control rods or “driver” fuel elements.From 1953 to 1955, tritium was produced only in control rods. Lithium-aluminum alloy target rods (“producer rods”) were installed in the septifoil (7-chambered) aluminum control rods in combination with cadmium neutron poison rods to get the desired reactivity control characteristics.
Cross-section of a septifoil control rod. Source: The Savannah River Site at Fifty (1950 – 2000), Chapter 13
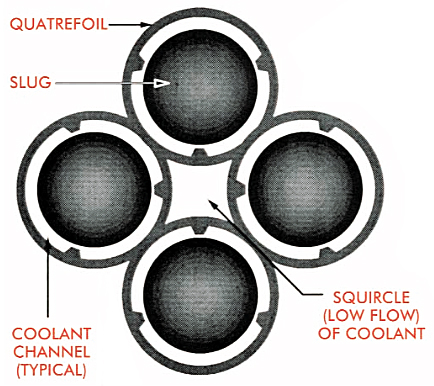
Starting in 1955, enriched uranium “driver” fuel cylinders and lithium target “slugs” were assembled in a quatrefoil (4-chambered) configuration, which provided much more target mass in the core for tritium production.
Cross-section of a quatrefoil driver fuel / target element. Source: The Savannah River Site at Fifty (1950 – 2000), Chapter 13
Enriched uranium drivers were extruded in Building 320-M until 1957, after which they were produced in the newly constructed Building 321-M. Production rate varied with the needs of the reactors, peaking in 1983, when the operations in Building 321-M went to 24 hours a day. Manufacturing ceased in 1989 after the last production reactors, K, L and P, were shut down.
K Reactor was operated briefly, and for the last time, in 1992 when it was connected to a new cooling tower that was built in anticipation of continued reactor operation. K Reactor was placed in cold-standby in 1993, but with no planned provision for restart as the nation’s last remaining source of new tritium production. In 1996, K Reactor was permanently shut down.
3.4. Synopsis of U.S. Cold War tritium production
The Federation of American Scientists (FAS) estimated that the total U.S. tritium production (uncorrected for radioactive decay) through 1984 was about 179 kg (about 396 pounds).
DOE reported a total of 10.6 kg (23.4 pounds) of tritium was produced at Hanford:
About 1.2 kg (2.7 pounds) was produced at the B and H Reactors during Project P-10-X.
The balance of Hanford production (9.4 kg, 20.7 pounds) is attributed to N Reactor operation during the Coproduct Program.
The majority of U.S. tritium production through 1984 occurred at the Savannah River Plant: about 168.4 kg (371.3 pounds).
4. The Interregnum of U.S Tritium Production (1988 – 2003)
DOE had shut down all of its Cold War-era production reactors. Tritium production at Hanford ended in 1967 and at Savannah River in 1988, leaving the U.S. temporarily with no source of new tritium for its nuclear weapons program. At the time, nobody thought that “temporary” meant 15 years (a period I call the “Interregnum”).
DOE’s search for new production capacity focused on four different reactor technologies and one particle accelerator technology. During the Interregnum, the primary source of tritium was from recycling tritium reservoirs from nuclear weapons that had been retired from the stockpile. This worked well at first, but tritium decays.
4.1 New Production Reactor (NPR) Program
From 1988 to 1992, DOE conducted the New Production Reactor (NPR) Program to evaluate four candidate technologies for a new generation of production reactors that were optimized for tritium production, but with the option to produce plutonium:
Heavy water cooled and moderated reactor (HWR)
High-temperature gas-cooled reactor (HTGR)
Light water cooled and moderated reactor (LWR)
Liquid metal reactor (LMR)
Three candidate NPR sites were considered:
Savannah River Site
Idaho National Engineering Laboratory (INEL, now INL)
Hanford Site
The NPR schedule goal was to have the new reactors start tritium production within 10 years after the start of conceptual design. Details on this program are available in DOE/NP-0007P, “New Production Reactors – Program Plan,” dated December 1990, which is available here: https://www.osti.gov/servlets/purl/6320732
The NPR program was cancelled in September 1992 (some say “deferred”) after DOE failed to select a preferred technology and failed to gain Congressional budgetary support for the program, at least in part due to the end of the Cold War.
DOE continued evaluating other options for tritium production, including commercial light water reactors (CLWRs) and accelerator tritium production (ATP).
4.2 Accelerator Tritium Production (ATP)
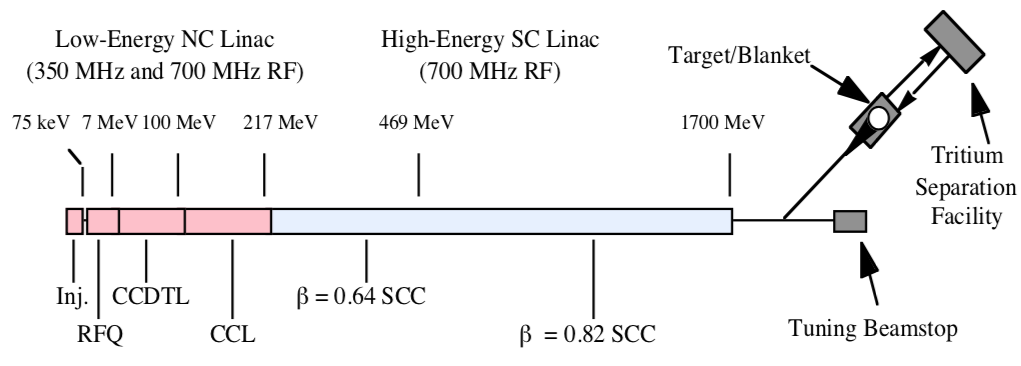
A candidate ATP design developed by Los Alamos National Laboratory (LANL) was based on a 1,700 MeV (million electron volt) linear accelerator that produced a 170 MW / 100 mA continuous proton beam. The ATP total electric power requirement was 486 MWe. The general arrangement of the ATP is shown in the following diagrams.
General arrangement of the ATP. Source: LANL
In this diagram, beam energy is indicated along the linear accelerator, increasing to the right and reaching a maximum of 1,700 MeV just before entering a magnetic switch that diverts the beam to the target/blanket or allows to beam to continue straight ahead to a tuning backstop.
Details of the Target / Blanket System. Source: LANL
The Target / Blanket System operates as follows:
The continuous proton beam is directed onto a tungsten target surrounded by a lead blanket, generating a huge flux of spallation neutrons.
Tubes filled with Helium-3 gas are located adjacent to the tungsten and within the lead blanket.
The spallation neutrons created by the energetic protons are moderated by the lead and cooling water and are absorbed by Helium-3 to create about 40 tritium atoms per incident proton.
The tritium is continuously removed from the Helium-3 gas in a nearby Tritium Separation Facility.
The unique feature of on-line, continuous tritium collection eliminates the time and processing required to extract tritium from the target elements used in production reactors.
ATP ultimately was rejected by DOE in December 1998 in favor of producing tritium in a commercial light water reactor (CLWR).
After the end of the Cold War, both the U.S. and Russia greatly reduced their respective stockpiles of nuclear weapons, as shown in the following chart.
Source: Wikipedia
The decommissioning of many nuclear weapons created an opportunity for the U.S. to temporarily maintain an adequate supply of tritium by recycling the tritium from the reservoirs no longer needed in warheads being retired from service. However, by 2020, after 32 years of exponential decay at a rate of 5.5% per year, the 1988 U.S. tritium inventory had decayed to only about 17% of the inventory in 1988, when the DOE stopped producing tritium. You can check my math using the following exponential decay formula:
y = a (1-b)x
where:
y = the fractional amount remaining after x periods
a = initial amount = 1
b = the decay rate per period (per year) = 0.055
x = number of periods (years) = 32
Recycling tritium from retired and aged reservoirs and precisely reloading reservoirs for installation in existing nuclear weapons are among the important functions performed today at DOE’s Savannah River Site (SRS). But, clearly, there is a point in time where simply recycling tritium reservoirs is no longer an adequate strategy for maintaining the current U.S. stockpile of nuclear weapons. A source of new tritium for military use was required.
5. The U.S. commercial light water reactor (CLWR) tritium production program (2003 to present)
In December 1998, Secretary of Energy Bill Richardson announced the decision to select commercial light water reactors (CLWRs) as the primary tritium supply technology, using government-owned Tennessee Valley Authority (TVA) reactors for irradiation services. A key commitment made by DOE was that the reactors would be required to use U.S.-origin low-enriched uranium (LEU) fuel. In their September 2018 report R45406, the Congressional Research Service noted: “Long-standing U.S. policy has sought to separate domestic nuclear power plants from the U.S. nuclear weapons program – this is not only an element of U.S. nuclear nonproliferation policy but also a result of foreign ‘peaceful-use obligations’ that constrain the use of foreign-origin nuclear materials.”
5.1 Structure of the CLWR program
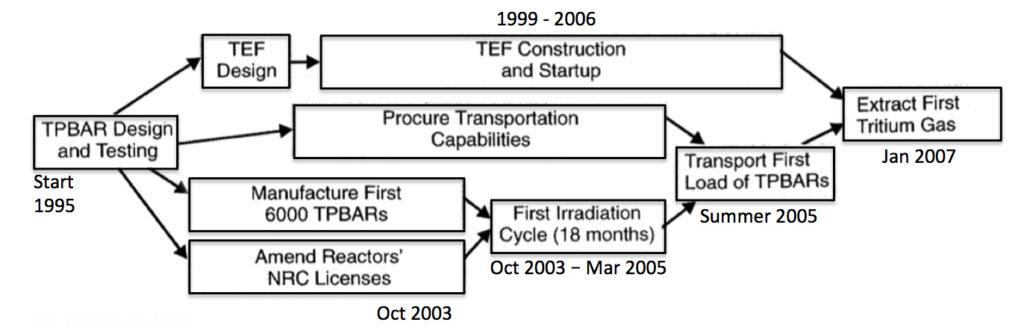
The current U.S. CLWR tritium production capability was deployed in about 12 years, between 1995 and 2007, as shown in the following high-level program plan.
CLWR tritium production program plan. Source: adapted from NNSA 2001
Since early 2007, NNSA has been getting its new tritium supply for nuclear stockpile maintenance from tritium-producing burnable absorber rods (TPBARs) that have been irradiated in the slightly-modified core of TVA’s Watts Bar Unit 1 (WBN 1) nuclear power plant, which is a Westinghouse commercial pressurized water reactor (PWR) licensed by the U.S. Nuclear Regulatory Commission (NRC).
TVA’s Watts Bar nuclear power plant. Source: Oak Ridge Today, 13 Feb 2019
The NRC’s June 2005 “Backgrounder” entitled, “Tritium Production,” provides a good synopsis of the development and nuclear licensing work that led to the approval of TVA nuclear power plants Watts Bar Unit 1 and Sequoyah Units 1 and 2 for use as irradiation sources for tritium production for NNSA. You find the NRC Backgrounder here:
The CLWR tritium production cycle is shown in the following NNSA diagram. Not included in this diagram are the following:
Supply of U.S.-origin LEU for the fuel elements.
Production of fuel elements using this LEU
Management of irradiated fuel elements at the TVA reactor sites
The current U.S. tritium production cycle. Source: NNSA and Art Explosion via GAO-11-100
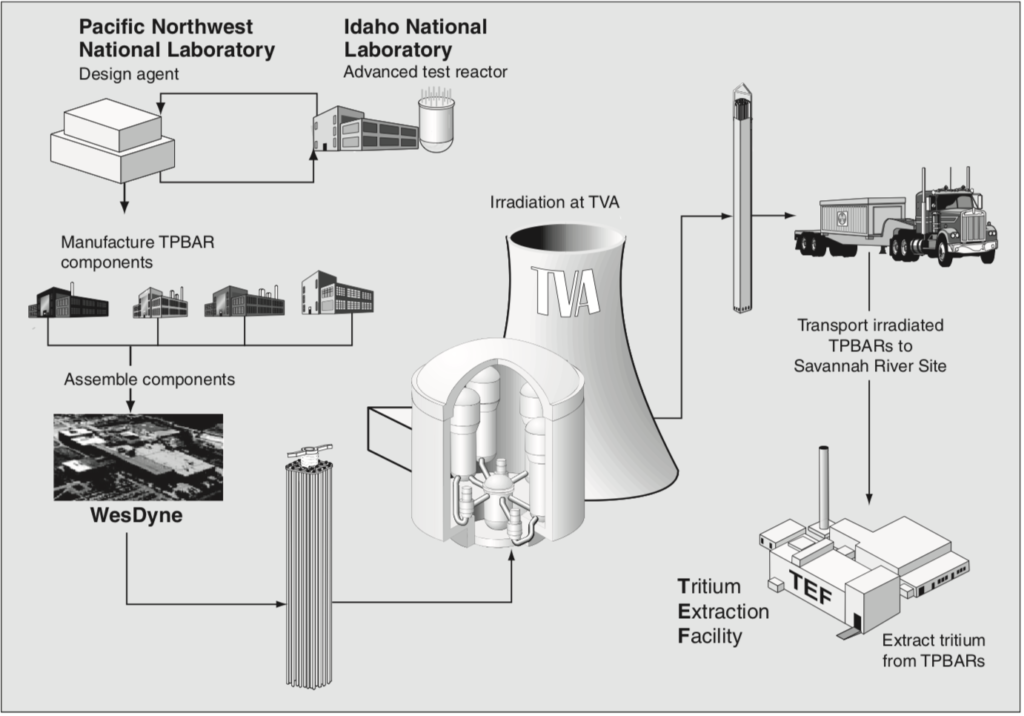
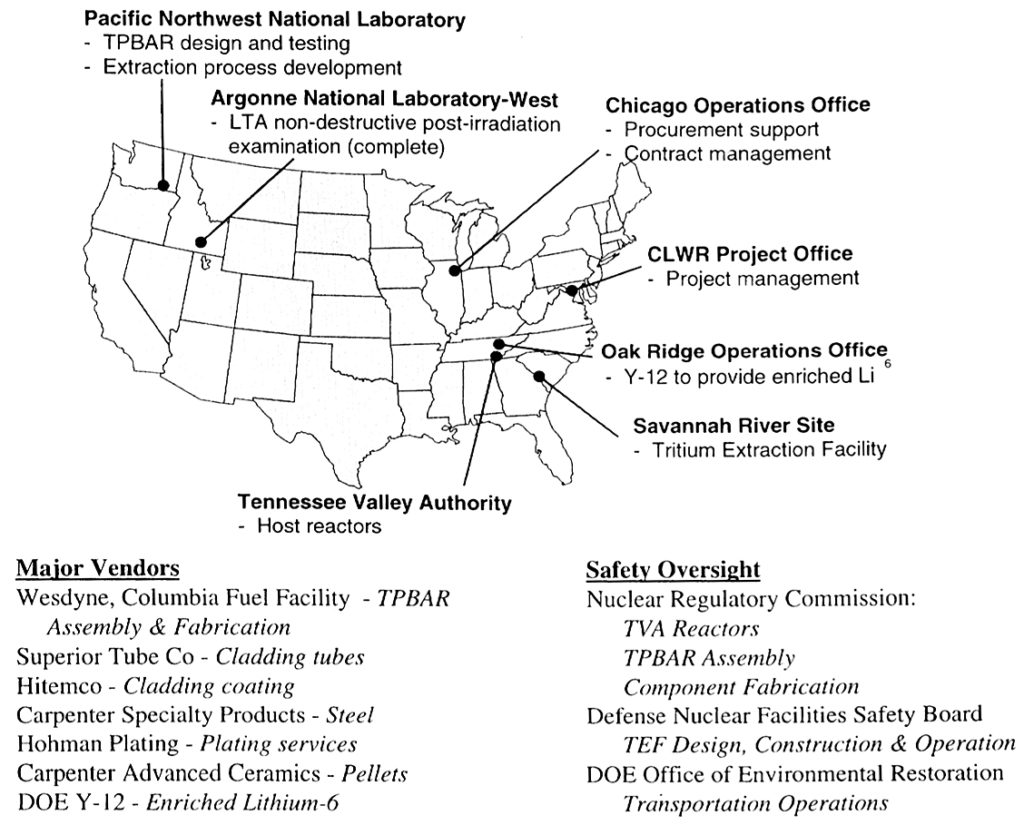
PNNL is the TPBAR design authority (agent) and is responsible for coordinating irradiation testing of TPBAR components in the Advanced Test Reactor (ATR) at the Idaho National Laboratory (INL). Production TPBAR components are manufactured by several contractors in accordance with specifications from PNNL, with WesDyne International responsible for assembling the complete TPBARs in Columbia, South Carolina. When needed, new TPBARs are shipped to TVA for installation in a designated reactor during a scheduled refueling outage and then irradiated for 18 months, until the next refueling outage. After being removed from the reactor, the irradiated TPBARs are allowed to cool at the TVA nuclear power plant for a period of time and then are shipped to the Savannah River Site.
SRS is the only facility in the nuclear security complex that has the capability to extract, recycle, purify, and reload tritium. Today, the Savannah River Tritium Enterprise (SRTE) is the collective term for the facilities, people, expertise, and activities at the SRS related to tritium production. SRTE is responsible for extracting new tritium from irradiated TPBARs at the Tritium Extraction Facility (TEF) that became operational in January 2007. They also are responsible for recycling tritium from reservoirs of existing warheads. The existing Tritium Loading Facility at SRS packages the tritium in sealed reservoirs for delivery to DoD. You’ll find the SRTE fact sheet at the following link:
Program participants and their respective roles are identified in the following diagram.
The current U.S. tritium production program participants. Source: NNSA 2001
5.2 What is a TPBAR?
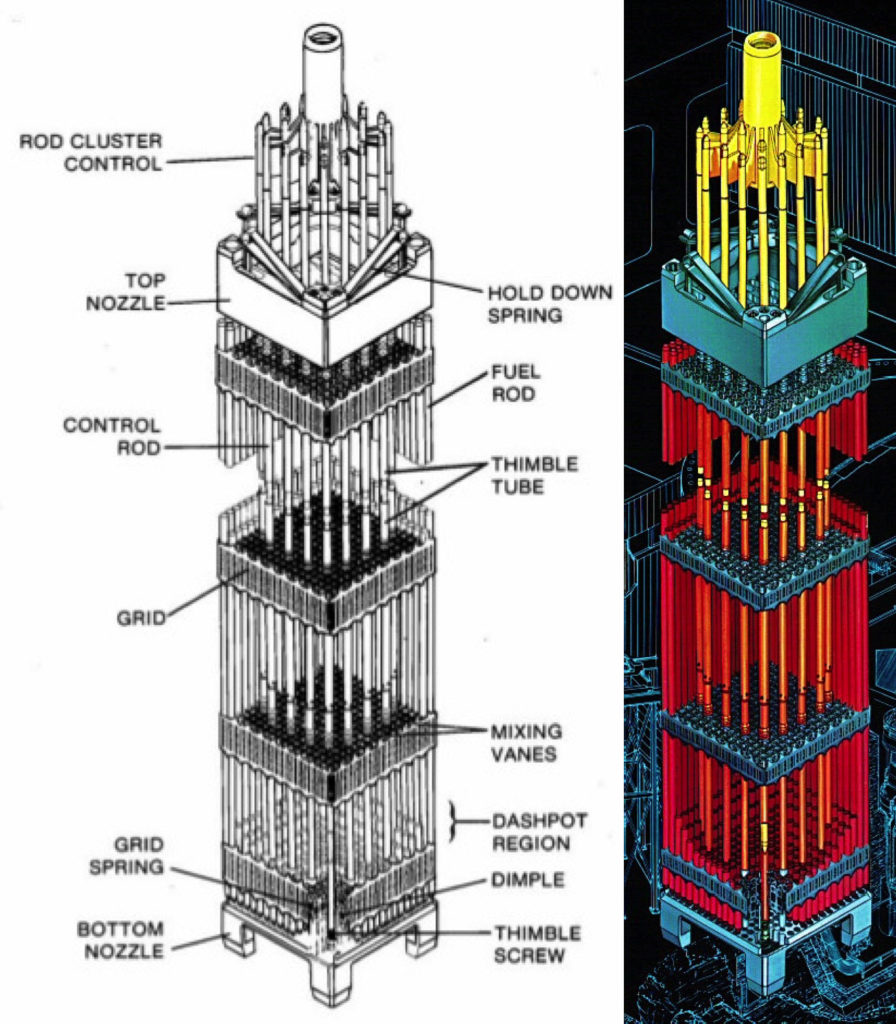
The reactor core in a Westinghouse commercial four-loop PWR like Watts Bar Unit 1 approximates a right circular cylinder with an active core measuring about 14 feet (4.3 meters) tall and 11.1 feet (3.4 meters) in diameter. The reactor core has 193 fuel elements, each of which is comprised of a 17 x 17 square array of 264 small-diameter, fixed fuel rods and 25 small-diameter empty thimbles, 24 of which serve as guide thimbles for control rods and one is an instrumentation thimble.
Rod cluster control assemblies (RCCAs) are used to control the reactor by moving arrays of small-diameter neutron-absorbing control rods into or out of selected fuel elements in the reactor core. Watts Bar has 57 RCCAs, each comprised of 24 Ag-In-Cd (silver-indium-cadmium) neutron-absorbing rods that fit into the control rod guide thimbles in selected fuel elements. Each RCCA is controlled by a separate control rod drive mechanism. The geometries of a Westinghouse 17 x 17 fuel element and the RCCA are shown in the following diagrams.
Cross-sectional view of a single Westinghouse 17 x 17 fuel element showing the lattice positions assigned to fuel rods (red) andthe thimbles available for instrumentation and control rods (blue).Source: Syeilendra Pramuditya Isometric view of a Westinghouse 17 x 17 fuel element showing the fixed fuel rods (red) and a rod cluster control assembly (yellow) that can be inserted or withdrawn for reactivity control. Sources: (L) Framatom ANP report BAW-10237, May 2001; (R) Westinghouse via NuclearTourist
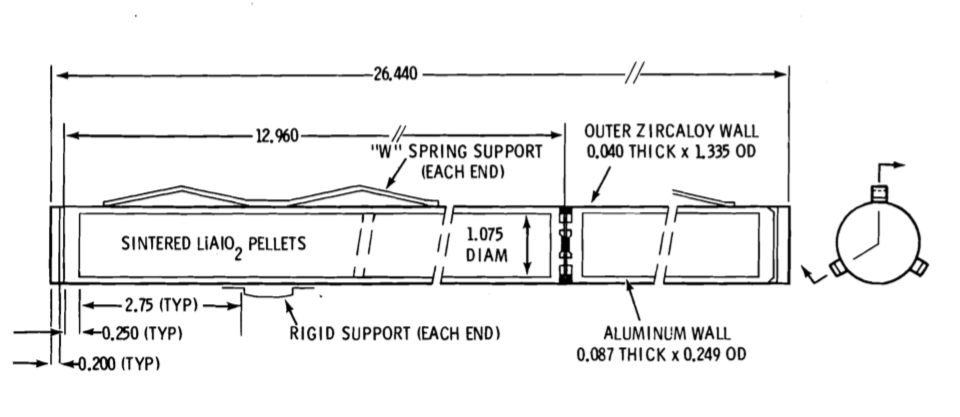
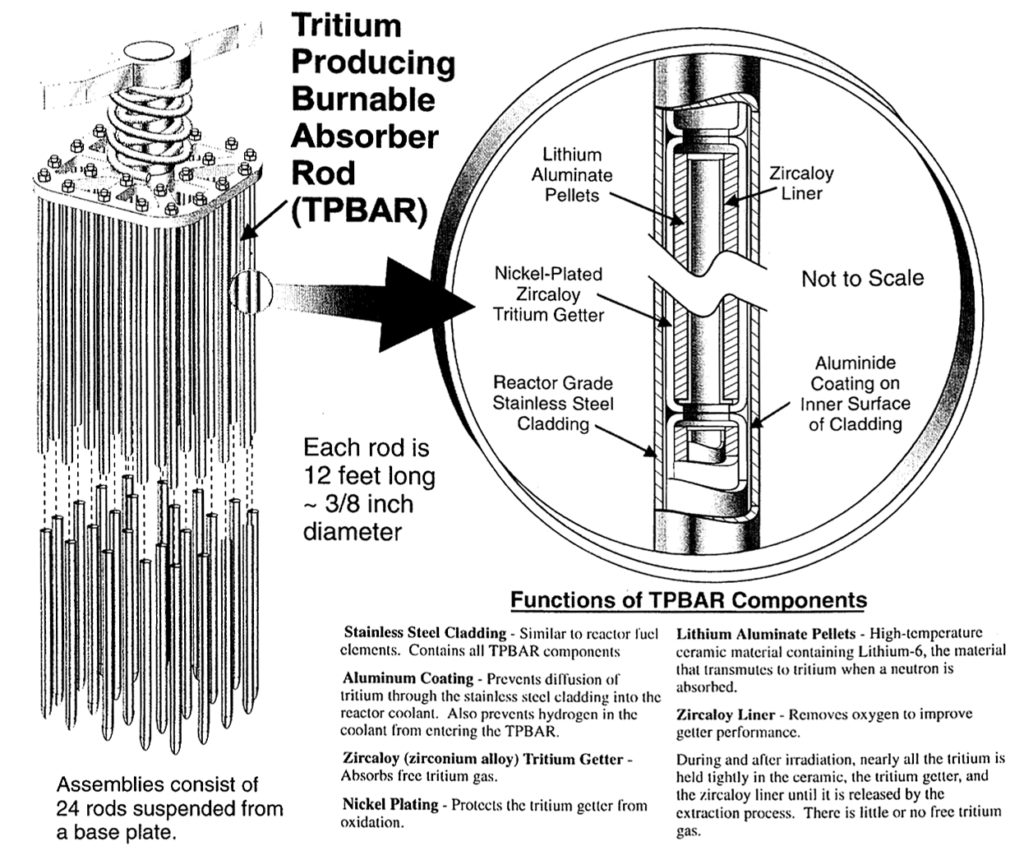
To produce tritium in a Westinghouse PWR core, lithium-6 targets, in the form of lithium aluminate (LiAlO2) ceramic pellets, are inserted into the core and irradiated. This is accomplished with the tritium-producing burnable absorber rods (TPBARs), each of which is a small-diameter rod (a “rodlet”) that externally looks quite similar to a single control rod in an RCCA. During one typical 18-month refueling cycle (actually, up to 550 equivalent full power days), the tritium production per rod is expected to be in a range from 0.15 to 1.2 grams. The ceramic lithium aluminate target is similar to the targets developed in the mid-1960s and used during the Hanford N-Reactor Coproduct Program for tritium production.
A TPBAR “feed batch” assembly generally resembles the shape of an RCCA, but with 12 or 24 TPBAR rodlets in place of the control rods. The feed batch assembly is a hanging structure supported by the top nozzle adapter plate of the fuel assembly and the TPBAR rodlets are hanging in the guide thimble tubes of the fuel assembly. The feed batch assembly does not move after it has been installed in the reactor core.
Since lithium-6 is a strong neutron absorber, the TPBAR functions in the reactor core in a manner similar to fixed burnable absorber rods, which use boron-10 as their neutron absorber. The reactivity worth of the TPBARs is slightly greater than the burnable absorber rods.
In 2001, Framatome ANP issued Report BAW-10237, “Implementation and Utilization of Tritium Producing Burnable Absorber Rods (TPBARS) in Sequoyah Units 1 and 2.” This report provides a good description of the modified core and TPBARs as they would be applied for tritium production at the Sequoyah nuclear plant. Watts Bar should be similar. The report is here:
The feed batch assembly and TPBAR rodlet configurations are shown in the following diagram.
TPBAR feed batch assembly (left); details of an individual TPBAR and target pellet (right). Source: NNSA 2001
TPBARs were designed for a low rate of tritium permeation from the target pellets, through the cladding and into the primary coolant water. Tritium permeation performance was expected to be less than 1.0 Curie/one TPBAR rod/year. With an assumed maximum of 2,304 TPBARs in the reactor core, the NRC initially licensed Watts Bar Unit 1 for a maximum annual tritium permeation of 2,304 Curies / year.
5.3. Operational use of TPBARs in TVA reactors
NRC issued WBN 1 License Amendment 40 in September 2002, approving the irradiation of up to 2,304 TPBARs per operating cycle.
For the first irradiation cycle (Cycle 6) starting in the autumn of 2003, TVA received NRC approval to operate with only 240 TPBARs because of issues related to Reactor Coolant System (RCS) boron concentration. Actual TPBAR performance during Cycle 6 demonstrated a significantly higher rate of tritium permeation than expected; reported to be about 4.0 Curies/one TPBAR/cycle.
TVA’s short-term response was to limit the number of TPBARs per core load to 240 in Cycles 7 and 8 to ensure compliance with its NRC license limits on tritium release. In their 30 January 2015 letter to TVA, NRC stated, “….the primary constraint on the number of TPBARs in the core is the TPBAR tritium release per year of 2,304 Curies per year.” This guidance gave TVA some flexibility on the actual number of TPBARs that could be irradiated per cycle. This NRC letter is available here: https://www.nrc.gov/docs/ML1503/ML15030A508.pdf
PNNL’s examinations of TPBARs revealed no design or production flaws. Nonetheless, PNNL developed design modifications intended to improve tritium permeation performance. These changes were implemented by the manufacturing contractors, resulting in the Mark 9.2 TPBAR, which was first used in 2008 in WBN 1 Cycle 9. PNNL also is conducting an ongoing irradiation testing programs in the Advanced Test Reactor (ATR) at INL, with the goal of finding a technical solution for the high permeation rate. You’ll find details on this program in a 2013 PNNL presentation at the following link: https://www.energy.gov/sites/prod/files/2015/08/f26/Senor%20-%20TMIST-3%20Irradiation%20Experiment.pdf
In October 2010, the General Accounting Office (GAO) reported: “no discernable improvement in TPBAR performance was made and tritium is still permeating from the TPBARs at higher-than-expected rates.” This GAO report is available here: https://www.gao.gov/products/GAO-11-100
In response to the high tritium permeation rate, the irradiation management strategy was revised based on an assumed permeation rate of 5.0 Curies per TPBAR per year (five times the original expected rate). Even at this higher permeation rate, WBN 1 can meet the NRC requirements in 10 CFR Part 20 and 10 CFR Part 50 Appendix I related to controlling radioactive materials in gaseous and liquid effluents produced during normal conditions, including expected occurrences.
The many NRC license amendments associated with WBN 1 tritium production are summarized below:
In License Amendment 40 (Sep 2002), the NRC originally approved WBN 1 to operate with up to 2,304 TPBARs.
Cycle 6: TVA limited the maximum number of TPBARs to be irradiated to 240 based on issues related to Reactor Coolant System (RCS) boron concentration. Approved by NRC in WBN 1 License Amendment 48 (Oct 2003).
Cycles 7 & 8: WBN 1 continued operating with 240 TPBARs.
Cycle 9: First use of TPBARs Mark 9.2 supported TVAs request to increase the maximum number of TPBARs to 400. Approved by NRC in WBN 1 License Amendment 67 (Jan 2008)
Cycle 10: TVA reduced the number of TPBARs irradiated to 240 after discovering that the Mark 9.2 TPBAR design changes deployed in Cycle 9 did not significantly reduce tritium permeation.
Cycles 11 to 14: NRC License Amendment 77 9May 2009) allowed a maximum of 704 TPBARs at WBN 1. TVA chose to irradiate only 544 TPBARs in Cycles 11 and 12, increasing to 704 TPBARs for Cycles 13 & 14.
Cycles 15 & beyond: NRC License Amendment 107 (Aug 2016) allows a maximum of 1,792 TPBARs at WBN 1.
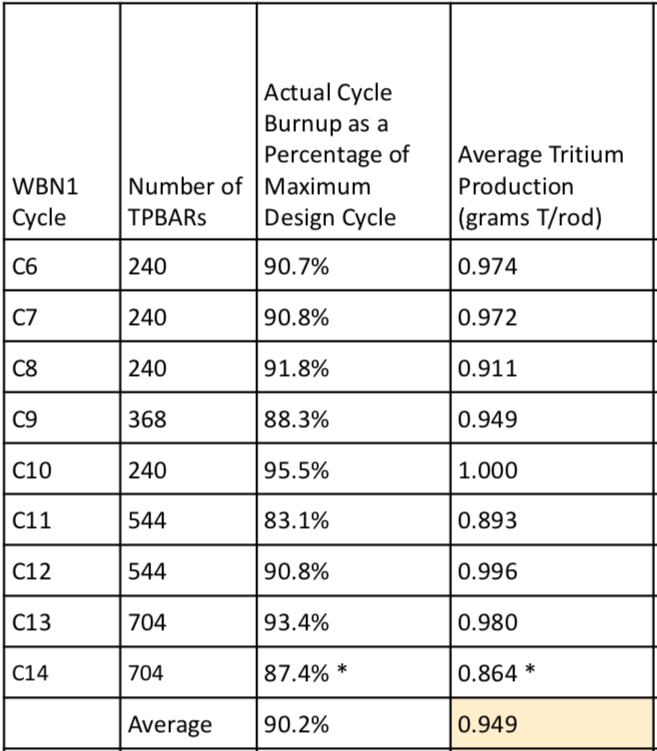
The actual number of TPBARs and the average tritium production per TPBAR during WBN 1 Cycles 6 to 14 are summarized in the 2017 PNNL presentation, “Tritium Production Assurance,” and are reproduced in the following table.
Tritium production, WBN 1 Cycles 6 to 14 (Cycle 14, completed in 2011, is an estimate). Source: PNNL, Tritium Production Assurance, 11 May 2017
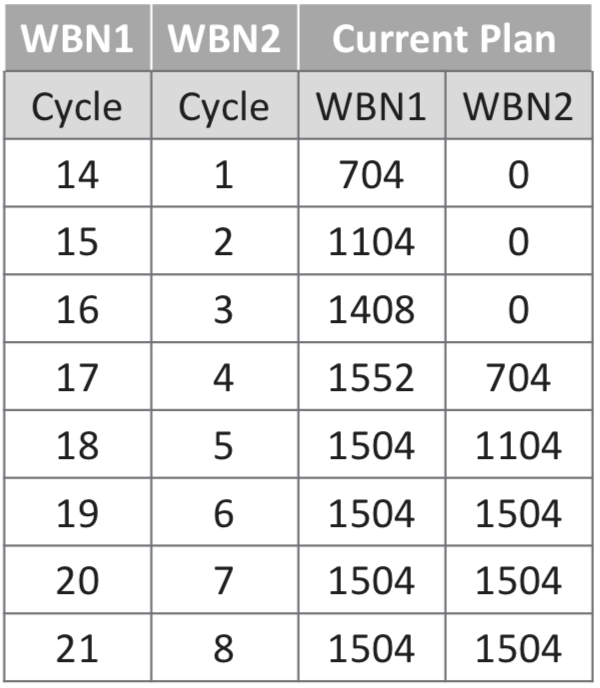
The current tritium production plan continues irradiation in WBN 1 and starts irradiation in Watts Bar Unit 2 (WBN 2) in Cycle 4, which will start after the spring 2022 refueling. Tritium is assumed to be delivered six months after the end of each cycle.
WBN 1 and WBN 2 TPBAR loading plans. Source: “Tritium Production Assurance”, report of the PNNL Tritium Focus Group, Richland, WA, May 11, 2017
As of early 2020, TVA and DOE are not delivering the quantity of tritium expected by NNSA. In July 2019, DOE and NNSA delivered their “Fiscal Year 2020 – Stockpile Stewardship and Management Plan” to Congress. In this plan, the top-level goal was to “recapitalize existing infrastructure to implement a plan to produce no less than 80 ppy (plutonium pits per year) by 2030.” To meet this goal, NNSA set a target for increasing tritium production to 2,800 grams per two 18-month reactor cycles of production at TVA by 2027. This means two TVA reactors will be producing tritium, and each will have a target of about 1,400 grams per cycle. This will be quite a challenge for TVA and DOE.
5.4 Where will the uranium fuel for the TVA reactors come from?
The tritium-producing TVA reactors are committed to using unobligated LEU fuel. That means that the uranium is not encumbered by international obligations that restrict its use for peaceful purposes only. Unobligated uranium has a very special pedigree. The uranium originated from U.S. mines, was processed in U.S. facilities, and was enriched in an unobligated U.S. enrichment facility.
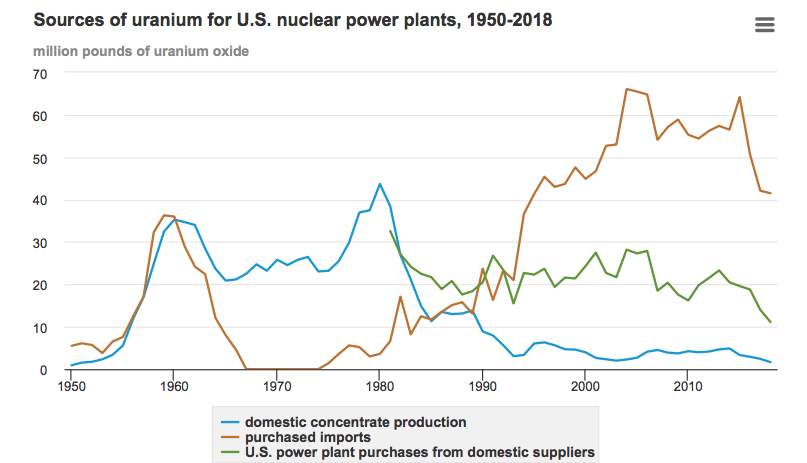
Today, that front-end of the U.S. nuclear fuel cycle has withered against international competition, as shown in the following chart from the Energy Information Administration (EIA).
Since the U.S. has not had an unobligated uranium enrichment facility since 2013, when the Paducah enrichment plant was closed by the Obama administration, there currently is no source of new unobligated LEU for the tritium-producing TVA reactors.
The impending shortage of unobligated enriched uranium eventually could affect tritium production, Navy nuclear reactor operation and other users. This matter has been addressed by the GAO in their 2018 report GAO-18-126, “NNSA Should Clarify Long-Term Uranium Enrichment Mission Needs and Improve Technology Cost Estimates,” which is available here:
The solution could be a mixture of measures, some of which are discussed briefly below.
Downblend unobligated HEU to buy time
Currently, the LEU for the TVA reactors is supplied from the U.S. inventory of unobligated LEU, which is supplemented by downblending unobligated HEU. In September 2018, NNSA awarded Nuclear Fuel Services (NFS) a $505 million contract to downblend 20.2 metric tons of HEU to produce LEU, which can serve as a short-term source of fuel for the tritium-producing TVA reactors. This contract runs from 2019 to 2025. Beyond 2025, additional HEU downblending may be needed to sustain tritium production until a longer-term solution is in place.
Build a new unobligated uranium enrichment facility and re-build the associated domestic uranium mining, milling and conversion infrastructure
NNSA is in the process of selecting the preferred technology for a new unobligated enrichment plant. There are two competing enrichment technologies: the Centrus AC-100 large advanced gas centrifuge and the Oak Ridge National Laboratory small advanced gas centrifuge, both of which are designed to enrich gaseous uranium hexafluoride (UF6).
NNSA failed to meet its goal of making the selection by the end of 2019. Regardless of the choice, it will take more than a decade to deploy such a facility. Perhaps a mid-2030’s date would be a possible target for initial operation of a new DOE uranium enrichment facility.
In the meantime, the atrophied / shutdown US uranium mining, milling and conversion industries need to be rebuilt to once again establish a reliable, domestic source of feed material for DOE’s uranium enrichment operations. This will be a daunting task given the current sad state of the US uranium production industry.
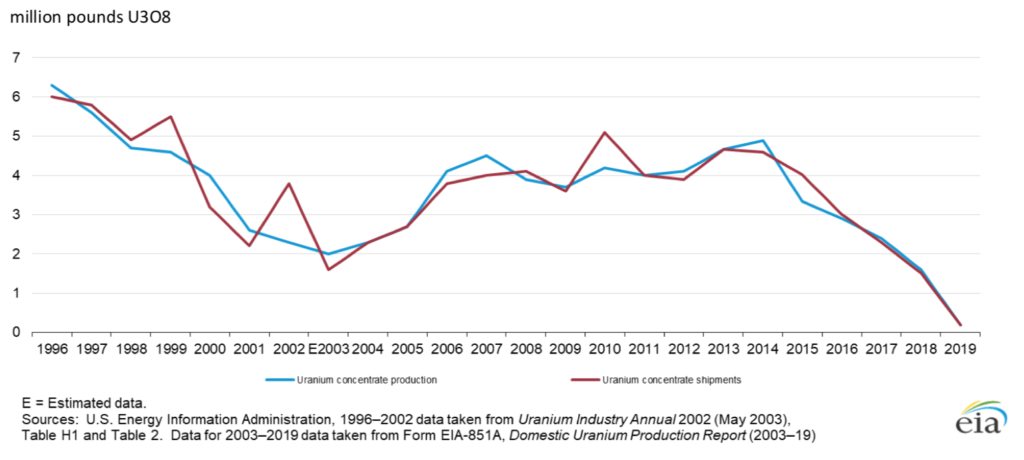
In May 2020, the US Energy Information Administration (EIA) released its 2019 Domestic Uranium Production Report. Mining uranium ore or in-situ leaching from underground uranium ore bodies, followed by the production of uranium (U3O8) concentrate (”yellowcake”), are the first steps at the front-end of the nuclear fuel cycle. The following EIA summary graphic shows the decline of US uranium production, which has been especially dramatic since 2013.
US uranium (U3O8) concentrate production and shipments, 1996–2019. Source: EIA
A key point reported by the EIA was that total US production of uranium concentrate from all domestic sources in 2019 was only 170,000 pounds (77,111 kg) of U3O8, 89% less than in 2018, from six facilities. In the graphic, you can see that US annual production in 1996 was about 35 times greater, approximately 6,000,000 pounds (2,721,554 kg). This EIA report is available at the following link: https://www.eia.gov/uranium/production/annual/
Conversion of U3O8 to UF6 is the next step in the front-end of the nuclear fuel cycle. Honeywell’s Metropolis Works was built in 1958 to produce UF6 for US government programs, including the nuclear weapons complex. Therefore, the Metropolis Works should be an unobligated conversion plant and, as such, is an important facility in the nuclear fuel cycle for the US tritium production reactors operated by TVA. In 2020, the Metropolis Works is the only US facility that can receives uranium ore concentrate and convert it to UF6.
In 1968, Metropolis Works began selling UF6 on the commercial nuclear market. However, since 2017, operations at the Metropolis Works have been curtailed due to weak market conditions for its conversion services and Honeywell has maintained the facility in a “ready-idle” status. In March 2020, the NRC granted the Metropolis Works a 40-year license renewal, permitting operations until March 24, 2060. When demand resumes, the Metropolis Works should be ready to resume operation.
Recognizing the US national interest in having a viable industrial base for the front-end of the nuclear fuel cycle, President Trump established a Nuclear Fuel Working Group in July 2019. On 13 April, 2020, the DOE released the “Strategy to Restore American Nuclear Energy Leadership,” which, among other things, includes recommendations to strengthen the US uranium mining and conversion industries and restore the viability of the entire front-end of the nuclear fuel cycle. You’ll find this DOE announcement and a link to the full report to the President here: https://www.energy.gov/articles/secretary-brouillette-announces-nuclear-fuel-working-groups-strategy-restore-american
Reprocess enriched DOE and naval fuel spent fuel
A large inventory of aluminum clad irradiated fuel exists at SRS, with a smaller quantity at INL. The only operating chemical separations (reprocessing) facility in the U.S. is the H-Canyon facility at SRS, which can only process aluminum clad fuel. However, the cost to operate H-Canyon to process the aluminum-clad fuel would be high.
There is a large inventory of irradiated, zirconium-clad naval fuel at INL. This fuel started life with a uranium enrichment level of 93% or higher. In 2017, INL completed a study examining the feasibility of processing zirconium-clad spent fuel through a new process called ZIRCEX. This process could enable reprocessing the spent naval fuel stored at INL as well as other types of zirconium-clad fuel.
In 2018, the U.S. Senate approved $15 million in funding for a pilot program at the INL to “recycle” irradiated (used) naval nuclear fuel and produce high-assay, low-enriched uranium (HALEU) fuel with an enrichment between 5% to 20% for use in “advanced reactors.” It seems that a logical extension would be to also produce LEU fuel to a specification that could be used in the TVA reactors.
In 2018, Idaho Senator Mike Crapo made the following report to the Senate: “HEU repurposing, from materials like spent naval fuel, can be done using hybrid processes that use advanced dry head-end technologies followed by material recovery, which creates the fuel for our new advanced reactors. Repurposing this spent fuel has the potential of reducing waste that would otherwise be disposed of at taxpayer expense, and approximately 1 metric ton of HEU can create 4 useable tons (of HALEU) for our new reactors.”
Perhaps there is a future for closing the back-end of the naval fuel cycle and recovering some of the investment that went into producing the very highly enriched uranium used in naval reactors. Because of the high burnup in long-life naval reactors, the resulting HALEU or LEU will have different uranium isotopic proportions than LEU produced in the front-end of the fuel cycle. This may introduce issues that would have to be reviewed and approved by the NRC before such LEU fuel could be used in the TVA reactors.
Other options
More information on options for obtaining enriched uranium without acquiring a new uranium enrichment facility is provided in Appendix II of GAO-18-126.
5.5 Where will the enriched lithium-6 target material come from?
A reliable source of lithium-6 target material is needed to produce the TPBARs for TVA’s tritium-producing reactors.
The U.S. has not had an operational lithium-6 production facility since 1963 when the last COLEX (column exchange) enrichment line was shutdown. COLEX was one of three lithium enrichment technologies employed at the Y-12 Plant in Oak Ridge, TN between 1950 and 1963. The others technologies were ELEX (electrical exchange) and OREX (organic exchange). All of these processes used large quantities of mercury. At the time lithium-6 enrichment operations ceased at Y-12, a stockpile of enriched lithium-6 and lithium-7 had been established along with a stockpile of unprocessed natural lithium feed material.
There has been a continuing decline in the national inventory of enriched lithium-6. To extend the existing supply, NNSA has instituted a program to recover and recycle lithium components from nuclear weapons that are being retired from the stockpile.
In May 2017, Y-12 lithium activities were adversely affected by the poor physical condition (and partial roof collapse) of the WW II-vintage Building 9204-2 (Beta 2).
Shortly thereafter, NNSA announced the approval of plans for a new Lithium Production Facility at Y-12 to replace Building 9204-2. The NNSA’s Fiscal Year 2020 – Stockpile Stewardship and Management Plan set an operational date of 2030 for the new facility.
5.6 Where is the tritium recovered?
Tritium is extracted from the irradiated TPBARs, purified and loaded into reservoirs at the Savannah River Site (SRS). These functions are performed by “Savannah River Tritium Enterprise” (SRTE), which is the collective term for the tritium facilities, people, expertise, and activities at the SRS.
The first load of irradiated TPBARs were consolidated at Watts Bar and delivered to SRS in August 2005 for storage pending completion of the new Tritium Extraction Facility (TEF). The TEF became fully operational and started extracting tritium from TPBARs in January 2007. The tritium extracted at TEF is transferred to the H Area New Manufacturing (HANM) Facility for purification. In February 2007, the first newly-produced tritium was delivered to the SRS Tritium Loading Facility for loading into reservoirs for nuclear weapons.
From 2007 until 2017, the TEF conducted only a single extraction each year because of the limited quantities of TPBARs being irradiated in the TVA reactors. During this period, the TEF sat idle for nine months each year between extraction cycles.
In 2017, for the first time, the TEF performed three extractions in a single year using the original vacuum furnace. Each extraction typically involved 300 TPBARs.
In November 2019, SRTE’s capacity for processing TPBARs and recovering tritium was increased by the addition of a second vacuum furnace.
6. Conclusions
In their “Fiscal Year 2020 – Stockpile Stewardship and Management Plan,” the NNSA’s top-level goal is to “recapitalize existing infrastructure to implement a plan to produce no less than 80 ppy (plutonium pits per year) by 2030.” This goal will drive tritium production demand, which in turn will drive demands for unobligated LEU to fuel TVA’s tritium-producing reactors and enriched lithium-6 for TPBARs.
The U.S. nuclear fuel cycle for the production of tritium currently is incomplete. It is able to produce tritium by using temporary measures that are not sustainable:
Downblending HEU to produce LEU
Recycling tritium as the primary means for meeting current demand
Recycling lithium components
The next 15 years will be quite a challenge for the NNSA, DOE and TVA as they work to reestablish a complete, modern nuclear fuel cycle for tritium production. There are several milestones on the critical path that would adversely impact tritium production if they are not met on schedule:
Higher tritium production goals for the TVA reactors: deliver 2,800 grams of tritium per two 18-month reactor cycles of production in TVA reactors by 2027
New Lithium Facility at Y-12 operational by 2030
New uranium enrichment facility operational, perhaps by the mid-2030s
There is a general lack of redundancy in the existing and planned future nuclear fuel cycle for tritium production. This makes tritium production vulnerable to a major outage at a single non-redundant facility.
“National Nuclear Security Administration Needs to Ensure Continued Availability of Tritium for the Weapons Stockpile,” Report GAO-11-100, General Accounting Office, October 2010: https://www.gao.gov/assets/320/311092.pdf
Sean Johnson, “Making the invisible engineer visible: DuPont and the recognition of nuclear expertise,” Technology and Culture, Volume 52, Number 3, July 2011, pp. 548-573: https://muse.jhu.edu/article/447781/pdf
For more information on Cold War-era Hanford tritium production:
Johnson AB, Jr., TJ Kabele, and WE Gurwell, “Tritium Production from Ceramic Targets: A Summary of the Hanford Coproduct Program,” BNWL-2097, Pacific Northwest National Laboratory, 1976: https://www.osti.gov/servlets/purl/7125831
Johnson AB, Jr., TJ Kabele, and WE Gurwell, “Tritium Production from Ceramic Targets: A Summary of the Hanford Coproduct Program,” BNWL-2097, Pacific Northwest National Laboratory, 1976: https://www.osti.gov/servlets/purl/7125831
On 23 August 2017, the Department of Energy (DOE) issued a report entitled, “Staff Report to the Secretary on Energy Markets and Reliability.” In his cover letter, Energy Secretary Rick Perry notes:
“It is apparent that in today’s competitive markets certain regulations and subsidies are having a large impact on the functioning of markets, and thereby challenging our power generation mix. It is important for policy makers to consider their intended and unintended effects.”
Among the consequences of the national push to implement new generation capacity from variable renewable energy (VRE) resources (i.e., wind & solar) are: (1) increasing grid perturbations due to the variability of the output from VRE generators, and (2) early retirement of many baseload generating plants because of several factors, including the desire of many states to meet their energy demand with a generating portfolio containing a greater percentage of VRE generators. Grid perturbations can challenge the reliability of the U.S. bulk power systems that comprise our national electrical grid. The reduction of baseload capacity reduces the resilience of the bulk power system and its ability dampen these perturbations.
The DOE staff report contains the following typical daily load curve. Baseload plants include nuclear and coal that operate at high capacity factor and generally do not maneuver in response to a change in demand. The intermediate load is supplied by a mix of generators, including VRE generators, which typically operate at relatively low capacity factors. The peak load generators typically are natural gas power plants that can maneuver or be cycled (i.e., on / off) as needed to meet short-term load demand. The operating reserve is delivered by a combination of power plants that can be reliably dispatched if needed.
The trends in new generation additions and old generation retirements is summarized in the following graphic from the DOE staff report.
Here you can see that recent additions (since 2006) have focused on VRE generators (wind and solar) plus some new natural gas generators. In that same period, retirements have focused on oil, coal and nuclear generators, which likely were baseload generators.
The DOE staff report noted that continued closure of baseload plants puts areas of the country at greater risk of power outages. It offered a list of policy recommendations to reverse the trend, including providing power pricing advantages for baseload plants to continue operating, and speeding up and reducing costs for permitting for baseload power and transmission projects.
Regarding energy storage, the DOE staff report states the following in Section 4.1.3:
“Energy storage will be critical in the future if higher levels of VRE are deployed on the grid and require additional balancing of energy supply and demand in real time.”
“DOE has been investing in energy storage technology development for two decades, and major private investment is now active in commercializing and the beginnings of early deployment of grid-level storage, including within microgrids.”
Options for energy storage are identified in the DOE staff report.
You can download the DOE staff report to the Secretary and Secretary Perry’s cover letter here:
Lyncean members should recall our 2 August 2017 meeting and the presentation by Patrick Lee entitled, “A fast, flexible & coordinated control technology for the electric grid of the future.” This presentation described work by Sempra Energy and its subsidiary company PXiSE Energy Solutions to address the challenges to grid stability caused by VRE generators. An effective solution has been demonstrated by adding energy storage and managing the combined output of the VER generators and the energy storage devices in real-time to match supply and demand and help stabilize the grid. This integrated solution, with energy storage plus real-time automated controls, appears to be broadly applicable to VRE generators and offers the promise, especially in Hawaii and California, for resilient and reliable electrical grids even with a high percentage of VRE generators in the state’s generation portfolio.
You can download Patrick Lee’s 2 August 2017 presentation to the Lyncean Group of San Diego at the following link:
The nuclear renaissance seemed to offer a path forward to deploy new generations of safer, more efficient power reactors to replace existing fleets of large power reactors. In the U.S., that transition is captured in the following diagram.
Source: Department of Energy
The current issues plaguing the U.S. nuclear power industry are largely financial, driven primarily by the low price of natural gas and the correspondingly low price of electricity generated by fossil power plants fueled by natural gas.
The recently implemented EPA Clean Power Plan (CPP) also is having an impact by failing to give appropriate credit to nuclear power plants as a means for minimizing greenhouse gas (GHG) emissions. This leaves renewable power generators (primarily hydro, wind and solar) to meet GHG emission targets in state and utility electric power portfolios. See my 27 November 2015, 8 July 2015 and 2 July 2015 posts for more information on the CPP.
Together, these issues have derailed the U.S. nuclear renaissance, which seemed to be gaining momentum more than a decade ago. Frankly, I think the nuclear renaissance in the U.S. is over because of the following factors:
Successfully operating nuclear power plants are being retired early for financial reasons.
Fewer large, new Generation III (Gen III) advanced light water reactor plants are being built than expected.
The prospects for small, modular reactors (SMRs) and advanced Generation IV (Gen IV) reactors will not be realized for a long time.
Important infrastructure facilities in the U.S. commercial reactor fuel cycle have been cancelled.
These issues are discussed in the following text.
1. Early retirement of successfully operating nuclear power plants for financial reasons
In a merchant energy market, nuclear power plants, even those operating at very high capacity factors, are undercut by natural gas generators, which can deliver electricity to market at lower prices. During the period from 2013 to 2015, the U.S. fleet of 99 power reactors (all considered to be “Generation II”) operated at an average net capacity factor of 90.41% (net capacity factor = actual power delivered / design electrical rating). This fleet of reactors has a combined generating capacity of about 100 GW, which represents about 20% of the total U.S. generating capacity.
Nuclear power plants do not currently receive subsidies commonly given to solar and wind power generators. For many U.S. utility executives, nuclear power plants are becoming financial liabilities in their generating portfolios. While some states are discussing ways to deliver financial relief for nuclear power plants operating within their borders, other states appear willing to let the plants close in spite of their real contributions to GHG reduction, grid stability, and the state and local economy.
Following are several examples of nuclear plant early retirements.
1.1. Exelon announced planned closure dates for Clinton and Quad Cities
The current operating license for the Clinton nuclear plant expires 29 September 2026 and the licenses for Quad Cities 1 & 2 expire on 14 December 2032. For the period 2013 – 2015, these nuclear power plants operated at very high capacity factors:
Quad Cities 1: 964 MWe @ 101.27%
Quad Cities 2: 957 MWe @ 92.68%
Clinton: 1,062 MWe @ 91.39%
On 2 June 2016, Exelon announced plans to retire the Clinton and Quad Cities nuclear plants on 1 June 2017 and 1 June 2018, respectively. This action was taken after the state failed to pass comprehensive energy legislation that would have offered financial relief to the utility. Also, Quad Cities was not selected in a reserve capacity auction that would have provided some needed future revenue. If the plants are closed as currently scheduled, Exelon will walk away from about 33 GW-years of carbon-free electric power generation.
You can read the Exelon press release at the following link:
The two-unit Diablo Canyon nuclear power plant is the last operating nuclear power station in California. In the three-year period from 2013 – 2015, unit performance was as follows:
Diablo Canyon 1: 1,138 MWe @ 90.29%
Diablo Canyon 2: 1,151 MWe @ 88.19%
Source: PGE
On 21 June 2016, PGE issued a press release announcing that they will withdraw their application to the NRC for a 20-year license extension for the Diablo Canyon 1 & 2 nuclear power plants and will close these plants by 2025 when their current operating licenses expire. PGE will walk away from about 41 GW-years of carbon-free electric power generation.
You can read the PGE press release at the following link:
1.3. Omaha Public Power District (OPPD) decided to close Fort Calhoun
With a net output of about 476 MWe, Fort Calhoun is the smallest power reactor operating in the U.S. In 2006, the Fort Calhoun operating license was extended to 2033. This plant operates as part of a power cooperative and is not subject to the same market forces as merchant plants. Nonetheless, the price of electricity delivered to customers is still an important factor.
On 16 June 2016, the OPPD Board announced their decision to close Fort Calhoun by the end of 2016 and stated that the closure was based simply on economic factors: it was much cheaper to buy electricity on the wholesale market than to continue operating Fort Calhoun. It cost OPPD about $71 per megawatt-hour in 2015 to generate power at Fort Calhoun. This is double the national industry average of $35.50 and much more than the open market price of about $20 per megawatt-hour.
You can read more about the Fort Calhoun closure in the OPPD press release at the following link:
1.4. Entergy announced plans to close the James A. FitzPatrick nuclear power plant
The license extension process for the 838 MWe James A. FitzPatrick nuclear power plant in upstate New York was completed in 2008 and the current operating license expires in October 2032. On 2 November 2015, Entergy announced plans to close the plant in late 2016 or early 2017 for economic reasons, primarily:
Sustained low current and long-term wholesale energy prices, driven by record low natural gas prices due to the plant’s proximity to the Marcellus shale formation, have reduced the plant’s revenues.
Flawed market design fails to recognize or adequately compensate nuclear generators for their benefits (i.e., large-scale 24/7 generation, contribution to grid reliability, carbon-free generation)
The plant carries a high cost structure because it is a single unit.
The region has excess power supply and low demand.
You can read the Entergy press release at the following link:
1.5. New Your state is considering operating subsidies for nuclear power plants
Finally, here’s some good news. In July 2016, the New York Public Services Commission (PSC) announced that it was considering subsidies for nuclear power plants operating in the state:
“The Public Service Commission is considering a proposed component of the Clean Energy Standard (CES) to encourage the preservation of the environmental values or attributes of zero-emission nuclear-powered electric generating facilities for the benefit of the electric system, its customers and the environment.”
This proposal offers to award zero-emissions credits (ZEC) in six 2-year tranches, beginning 1 April 2017. The price to be paid for ZECs would be determined by a formula that includes published estimates of the social cost of carbon (SCC). Under the PSC staff’s approach, “the zero-emission attribute payments will never exceed the calculated value they produce.”
Details of the PSC staff’s proposed methodology for determining subsidies for nuclear power plants are in a document entitled “Staff’s Responsive Proposal for Preserving Zero-Emissions Attributes,” which you can download at the following link:
No doubt this approach to establishing zero-emissions credits for nuclear power plants will be closely watched by other states that are faced with this same issue of nuclear power plant early retirement for economic reasons. Hopefully, Entergy will reconsider its planned closure of the James A. FitzPatrick nuclear power plant.
2. Fewer large, new Generation III advanced light water reactor plants are being built than expected
Since the start of the nuclear renaissance, 27 combined license (COL) applications were submitted to the NRC for construction and operation of new Gen III advanced light water reactor plants. You can see the current status of COLs for new reactors in the U.S. on the NRC’s website at the following link:
A summary of the current COL status is as follows:
7 withdrawn
6 NRC review suspended
7 under review
7 issued (Fermi 3, South Texas Project 3 & 4, V. C. Summer 2 & 3, and Vogtle 3 & 4)
Recent actions are highlighted below.
2.1 Entergy withdrew its NRC license application for the River Bend unit 3 nuclear power plant
The NRC confirmed that, effective 21 June 2016, Entergy had withdrawn its application for a COL for a single unit of the General Electric Economic Simplified Boiling Water Reactor (ESBWR) at the River Bend site in Louisiana. This is the end of a series of delays initiated by Entergy. On 9 June 2009, Entergy requested that the NRC temporarily suspend the COL application review, including any supporting reviews by external agencies, until further notice. The NRC granted this suspension. On 4 December 2015, Entergy Operations, Inc., filed to have their COL application withdrawn.
2.2 Three of the seven approved Gen III plants may never be built: Fermi-3 and STP 3 & 4.
Fermi 3: On 7 May 2015, NRC announced that the Fermi-3 COL had been issued. After the COL was issued, DTE Energy is reported to have said it has no immediate plans to build Fermi 3, and sought the approval as a long-term planning option. If built, Fermi 3 will be a GE-Hitachi ESBWR.
South Texas Project (STP) 3 & 4: In April 2015, NRG shelved plans to finance STP 3 & 4. NRG spokesman David Knox said, “The economics of new nuclear just don’t permit the construction of those units today.” Nonetheless, NRG continued the NRC review process and NRC issued the COLs for STP Units 3 and 4 on 12 February 2016. If built, STP 3 & 4 will be Toshiba Advanced Boiling Water Reactors (ABWRs).
2.3 Only four of the seven approved Gen III plants are actually under construction: V. C. Summer 2 & 3, and Vogtle 3 & 4.
So far, the net results of the nuclear renaissance in the U.S. are these four new Gen III plants, plus the resurrected Watts Bar 2 Gen II nuclear plant (construction stopped in 1980; not completed and operational until 2015).
C. Summer 2 & 3: Both units are under construction. These are Westinghouse AP-1000 PWR plants. In February 2016, South Carolina Electric and Gas Co. (SCE&G) reported that 85% of the major equipment necessary to build Units 2 and 3 was onsite. Most of the remaining equipment has been manufactured and was awaiting transport to the site.
Vogtle 3 & 4: Both units are both under construction. These are Westinghouse AP-1000 PWR plants. Southern Company provides an overview of their construction status at the following link:
Vogtle 3 & 4 under construction. Source: Southern Company
2.4. Good news: Blue Castle Holdings is planning a 2-unit AP-1000 plant in Utah
Blue Castle Holdings conducted a project overview “webinar” on July 21, 2016 to kickoff its contractor selection process for this new plant. The preliminary schedule calls for the start of work in 2020, “as permitted by the NRC.” This will be an important project to watch, since it may become the first new nuclear power plant project since the first round of applications at the start of the nuclear renaissance. You can read more about the Blue Castle plant at the following link:
3. The prospects for small, modular reactors (SMRs) and advanced Generation IV reactors will not be realized for a long time
Currently there are no SMRs or Gen IV reactors in any stage of a licensing process that could lead to a generic design certification or a combined license (COL) for a specific plant.
On 7 – 8 June 2016, the DOE and NRC co-hosted a second workshop on advanced non-light water reactors, which was a follow-on to a similar workshop held in September 2015. You can read the summary report and access all of the presentation material from the June 2016 workshop at the following link:
The DOE presentation by John E. Kelly entitled, “Vision and Strategy for the Development and Deployment of Advanced Reactors,” includes the following timeline that shows projected U.S. nuclear generating capacity for four scenarios.
The declining blue, brown and green curves show the generating capacity available from the existing fleet of power reactors depending on the length of their operating licenses (40, 60, or 80 years), and of course, assuming that there are few early plant closures for economic reasons.
The upper purple line represents total nuclear generating capacity needed to maintain nuclear at about 20% of the total U.S. generating capacity. Significant growth in demand is expected due to electrification of transportation and other factors, creating a demand for 200 GW of nuclear generated electricity by about 2050. This is double the current U.S. nuclear generating capacity!!
Source: DOE
Among all the presentations in the 2016 workshop, there is no mention of where the capital comes from to build all of the new nuclear power plants needed to meet the expectation of 200 GW of nuclear generating capacity by 2050. If the expected economic advantages of SMRs and Gen IV plants fail to materialize, then construction cost per gigawatt of electrical generating capacity could be similar to current Gen III construction costs, which are on the order of $5 to 6 billion per gigawatt. This puts a price tag of $1.0 to 1.2 trillion on the deployment of 200 GW of new nuclear generating capacity. The actual amount isn’t particularly important. Just be aware that it’s a very big number. This leads me to believe that the above timeline is quite optimistic.
3.1. mPower SMR program has faltered
There was considerable optimism when the mPower program was launched more than a decade ago. This program probably is further along in its design and development processes than other U.S. SMR candidates. Unfortunately, mPower has been in decline for the past two years, during which time the mPower team head count fell from about 600 to less than 200 people. That reduction in force and slowdown in development occurred after the B&W board of directors (parent of BWXT) decided to reduce spending on mPower from about $100 million per year to a maximum of $15 million per year. The official explanation was that the company had failed in its effort to find additional major investors to participate in the project.
On 4 March 2016, there was good news to report when Bechtel and BWXT issued a press release announcing that they had reached an agreement to accelerate the development of the mPower SMR. No timeline was given for submitting an application for design certification to the NRC. You can read this press release at the following link:
On 13 May 2016, Tennessee Valley Authority (TVA) applied to the NRC for an early site permit for SMRs at the Clinch River site in Tennessee. In its application, TVA did not specify the reactor type, but previously had considered mPower for that site. The NRC is expected to decide in July 2016 if the application contains sufficient information to start the early site permit review process.
3.2. Other U.S. SMR candidates have not gotten beyond pre-application meetings with the NRC
The other U.S. SMR candidates are:
NuScale (NuScale Power, LLC)
SMR-160 (SMR Inventec, a Holtec International Company)
Integrated PWR (Westinghouse)
None have submitted an application for design certification to the NRC.
3.3. The DOE Generation IV (Gen IV) reactor program continues to slip
Gen IV reactors are intended to be the next generation of commercial power reactors, incorporating a variety of advanced technologies to deliver improved safety, reliability and economics.
The Generation IV International Forum (GIF) was created in January 2000 by 9 countries, and today has 13 members, all of which are signatories of the founding document, the GIF Charter. For basic information, you can download DOE’s Gen IV fact sheet at the following Argonne National Laboratory link:
On this fact sheet, you will find the following claim:
“Generation IV nuclear energy systems target significant advances over current-generation and evolutionary systems in the areas of sustainability, safety and reliability, and economics. These systems are to be deployable by 2030 in both industrialized and developing countries.”
You can view a more detailed 2014 presentation by the GIF at the following link:
In this GIF presentation, you can see the significant schedule slip that has occurred between their 2002 and the 2013 roadmaps.
Source: Gen IV International Forum
At the slow rate that DOE and its international GIF partners are actually making progress, I suspect that there will not even be a working Gen IV demonstration plant of any type before 2030, and certainly none in the U.S.
4. Important infrastructure facilities in the U.S. commercial reactor fuel cycle have been cancelled
Nuclear power plants are part of a fuel cycle, which for the U.S. has been a once-through (“throw-away”) fuel cycle since President Carter’s 7 April 1977 decision to discontinue work on a closed fuel cycle with nuclear fuel reprocessing. “Head-end” fuel cycle facilities include mining, milling, conversion, enrichment, and fuel manufacturing. These are the facilities that take uranium and/or plutonium from various sources and produce the desired nuclear fuel that is incorporated into the fuel elements that ultimately are installed in a reactor. “Back-end” fuel cycle facilities deal with the spent fuel elements and nuclear waste generated from reactor operation and other fuel cycle activities. In the once-through fuel cycle, the spent fuel is stored at the nuclear reactor where it was used until it can be transported to a nuclear waste repository for final disposition.
Two important nuclear fuel cycle facilities have been cancelled by the Obama administration: the Yucca Mountain Nuclear Waste Repository and the Savannah River Mixed-oxide Fuel Fabrication Facility. These cancellations have the effect of adding cost and uncertainty for the utilities operating commercial power reactors.
4.1. DOE has not developed plans for a replacement for the Yucca Mountain Nuclear Waster Repository
As is well known by now, the DOE abrogated its responsibility to develop a deep geologic site as the national commercial nuclear waste repository. Congress established this DOE role in the Nuclear Waste Policy Act of 1982. Yucca Mountain in Nevada was designated as the national repository site in the Nuclear Waste Policy Act amendments of 1987. Congress approved the Yucca Mountain project in 2002, and the project was docketed for licensing by the NRC in 2008, as Docket 63-001.
Yucca Mountain effectively was terminated in 2011 when the Obama administration removed funding for the project from the DOE budget. The NRC licensing process was suspended at the same time.
In August 2013, the U.S. Court of Appeals (Wash DC) ruled that the NRC was obligated to continue their Yucca Mountain licensing process and either “approve or reject the Energy Department’s application for [the] never-completed waste storage site at Nevada’s Yucca Mountain.” Finally, in January 2015, the NRC staff completed the Safety Evaluation Report (SER) for Yucca Mountain, which is available at the following link:
Here are the basis conclusions presented in the SER:
NRC staff finds that DOE’s application meets most, but not all, of the applicable NRC regulatory requirements.
Requirements not met are related to certain conditions of land ownership and water rights.
NRC staff therefore does not recommend issuance of a construction authorization at this time.
The current status of Yucca Mountain licensing is summarized in a January 2016 NRC presentation, “NRC Review Activities for the Proposed High-level Radioactive Waste Repository at Yucca Mountain, Nevada,” which is available at the following link:
In this presentation, the author, James Rubenstone, identifies licensing actions still to be completed for the Yucca Mountain site and notes that, “Further progress of the review and licensing activities requires further appropriations.” In March 2015, the NRC reported that completing its Yucca Mountain licensing process would cost an additional $330 million.
On 5 May 2016, the NRC issued the final Environmental Impact Statement (EIS) supplement for Yucca Mountain. This is not the end of the EIS process. There still remain about 300 contentions against the project that must be adjudicated. However, the adjudicatory process remains suspended.
In his January 2016 presentation, James Rubenstone also noted that, “New approaches for waste management and disposal have been proposed, but require dedicated funding and (in some cases) changes to existing law.”
So the bottom line is simply that this nation is very far, probably several decades, from having a national repository for commercial nuclear waste and spent nuclear fuel.
The burden for managing spent nuclear fuel remains with the U.S. nuclear utilities, which had been paying DOE for decades to develop the national nuclear waste repository. The current utility approach involves on-site management of spent fuel, initially in the spent fuel storage pool, and later in dry storage in canisters or casks that provide radiation shielding and protect the spent fuel from external hazards. These dry storage facilities typically are called Independent Spent Fuel Storage Installations (ISFSI). Nuclear utilities have added ISFSIs specifically to cope with the failure of DOE to complete the national nuclear waste repository as required by Nuclear Waste Policy Act of 1982.
You can find a good overview of ISFSI design and deployment at commercial power reactor sites on the NRC website at the following link:
For those of you wanting more information on the Yucca Mountain project, I refer you to the recently published a two-volume, 920-page book entitled, “Waste of a Mountain,” by Michael Voegele and Donald Vieth. The book is on sale at the Pahrump Valley Museum with the proceeds going to the museum. You’ll find the book at the following link:
4.2. DOE plans to halt construction of the Savannah River mixed-oxide (MOX) fuel fabrication facility (MFFF)
Source: DOE
The commitment to build the MOX facility is part of a 2000 agreement between the U.S. and Russia known as the amended U.S.-Russia Plutonium Management and Disposition Agreement (PMDA). The goal of PDMA is to neutralize 34 metric tons of weapons-grade plutonium by using it in MOX fuel for commercial power reactors. In its FY-2017 budget proposal, DOE makes clear that MFFF will be terminated:
“Aerospace Corporation completed two reports documenting its assessment of the April 2014 analysis. Additionally, in June 2015 the Secretary of Energy assembled a Red Team to assess options for the disposition of surplus weapon-grade plutonium. These analyses confirm that the MOX fuel approach will be significantly more expensive than anticipated and will require approximately $800 million to $1 billion annually for decades. As a result, the FY 2017 budget proposes that the MOX project be terminated.”
Final termination is scheduled to be complete in fiscal year 2019.
Instead of MFFF, DOE will develop a “dilute and dispose” (D&D) process that involves storage of diluted plutonium in metal containers placed in the Waste Isolation Pilot Plant (WIPP) in Carlsbad, NM. This process will derive no economic value from the energy content of the weapons-grade plutonium. You will find the complete DOE budget proposal at the following link:
Senator Tim Scott (R-S.C.) said, “The reality of it is that without the MOX facility we cannot honor our agreement with the Russians.’’
4. In conclusion
The nuclear renaissance is over in the U.S. The expected long-term availability of low-price natural gas makes it difficult or impossible for nuclear power plants to generate electricity at a competitive price.
A future nuclear renaissance could be enabled if many states in this nation take the bold steps proposed by the New York Public Services Commission (PSC) to recognize the importance of nuclear power in the state’s generation portfolio and provide adequate financial incentives to nuclear utilities so they can operate profitably, extend the lives of existing nuclear plants, and build new nuclear plants.
The Joint BioEnergy Institute (JBEI) is a Department of Energy (DOE) bioenergy research center dedicated to developing advanced bio-fuels, which are liquid fuels derived from the solar energy stored in plant biomass. Such fuels currently are replacing gasoline, diesel and jet fuels in selected applications.
On 1 July 2016, a team of Lawrence Berkeley National Laboratory (LBNL) and Sandia National Laboratories (SNL) scientists working at JBEI published a paper entitled, “CO2 enabled process integration for the production of cellulosic ethanol using bionic liquids.” The new process reported in this paper greatly simplifies the industrial manufacturing of bio-fuel and significantly reduces waste stream volume and toxicity as well as manufacturing cost.
The abstract provides further information:
“There is a clear and unmet need for a robust and affordable biomass conversion technology that can process a wide range of biomass feedstocks and produce high yields of fermentable sugars and bio-fuels with minimal intervention between unit operations. The lower microbial toxicity of recently developed renewable ionic liquids (ILs), or bionic liquids (BILs), helps overcome the challenges associated with the integration of pretreatment with enzymatic saccharification and microbial fermentation. However, the most effective BILs known to date for biomass pretreatment form extremely basic pH solutions in the presence of water, and therefore require neutralization before the pH range is acceptable for the enzymes and microbes used to complete the biomass conversion process. Neutralization using acids creates unwanted secondary effects that are problematic for efficient and cost-effective biorefinery operations using either continuous or batch modes.
We demonstrate a novel approach that addresses these challenges through the use of gaseous carbon dioxide to reversibly control the pH mismatch. This approach enables the realization of an integrated biomass conversion process (i.e., “single pot”) that eliminates the need for intermediate washing and/or separation steps. A preliminary technoeconomic analysis indicates that this integrated approach could reduce production costs by 50–65% compared to previous IL biomass conversion methods studied.”
Regarding the above abstract, here are a couple of useful definitions:
Ionic liquids: powerful solvents composed entirely of paired ions that can be used to dissolve cellulosic biomass into sugars for fermentation.
Enzymatic saccharification: breaking complex carbohydrates such as starch or cellulose into their monosaccharide (carbohydrate) components, which are the simplest carbohydrates, also known as single sugars.
The paper was published on-line in the journal, Energy and Environmental Sciences, which you can access via the following link:
Let’s hope they’re right about the significant cost reduction for bio-fuel production.
2. Operational use of bio-fuel
One factor limiting the wide-scale use of bio-fuel is its higher price relative to the conventional fossil fuels it is intended to replace. The prospect for significantly lower bio-fuel prices comes at a time when operational use of bio-fuel is expanding, particularly in commercial airlines and in the U.S. Department of Defense (DoD). These bio-fuel users want advanced bio-fuels that are “drop-in” replacements to traditional gasoline, diesel, or jet fuel. This means that the advanced bio-fuels need to be compatible with the existing fuel distribution and storage infrastructure and run satisfactorily in the intended facilities and vehicles without introducing significant operational or maintenance / repair / overhaul (MRO) constraints.
You will find a fact sheet on the DoD bio-fuel program at the following link:
The “drop in” concept can be difficult to achieve because a bio-fuel may have different energy content and properties than the petroleum fuel it is intended to replace. You can find a Department of Energy (DOE) fuel properties comparison chart at the following link:
Another increasingly important factor affecting the deployment of bio-fuels is that the “water footprint” involved in growing the biomass needed for bio-fuel production and then producing the bio-fuel is considerably greater than the water footprint for conventional hydrocarbon fuel extraction and production.
A. Commercial airline use of bio-fuel:
Commercial airlines became increasingly interested in alternative fuels after worldwide oil prices peaked near $140 in 2008 and remained high until 2014.
A 2009 Rand Corporation technical report, “Near-term Feasibility of Alternative Jet Fuels,” provides a good overview of issues and timescales associated with employment of bio-fuels in the commercial aviation industry. Important findings included:
Drop-in” fuels have considerable advantages over other alternatives as practical replacements for petroleum-based aviation fuel.
Alcohols do not offer direct benefits to aviation, primarily because high vapor pressure poses problems for high-altitude flight and safe fuel handling. In addition, the reduced energy density of alcohols relative to petroleum-based aviation fuel would substantially reduced aircraft operating capabilities and would be less energy efficient.
Biodiesel and biokerosene, collectively known as FAMEs, are not appropriate for use in aviation, primarily because they leave deposits at the high temperatures found in aircraft engines, freeze at higher temperatures than petroleum-based fuel, and break down during storage
You can download this Rand report at the following link
After almost two years of collaboration with member airlines and strategic partners, the International Air Transport Association (IATA) published the report, “IATA Guidance Material for Biojet Fuel Management,” in November 2012. A key finding in this document is the following:
“To be acceptable to Civil Aviation Authorities, aviation turbine fuel must meet strict chemical and physical criteria. There exist several specifications that authorities refer to when describing acceptable conventional jet fuel such as ASTM D1655 and Def Stan 91-91. At the time of issue, blends of up to 50% biojet fuel produced through either the Fischer-Tropsch (FT) process or the hydroprocessing of oils and fats (HEFA – hydroprocessed esters and fatty acids) are acceptable for use under these specifications, but must first be certified under ASTM D7566. Once the blend has demonstrated compliance with the relevant product specifications, it may be regarded as equivalent to conventional jet fuel in most applications.“
You can download this IATA document at the following link:
In 2011, KLM flew the world’s first commercial bio-fuel flight, carrying passengers from Amsterdam to Paris. Also in 2011, Aeromexico flew the world’s first bio-fuel trans-Atlantic revenue passenger flight, from Mexico City to Madrid.
In March 2015, United Airlines (UA) inaugurated use of bio-fuel on flights between Los Angeles (LAX) and San Francisco (SFO). Eventually, UA plans to expand the use of bio-fuel to all flights operating from LAX. UA is the first U.S. airline to use renewable fuel for regular commercial operation.
Many other airlines worldwide are in various stages of bio-fuel testing and operational use.
B. U.S. Navy use of bio-fuel:
The Navy is deploying bio-fuel in shore facilities, aircraft, and surface ships. Navy Secretary Ray Mabus has established a goal to replace half of the Navy’s conventional fuel supply with renewables by 2020.
In 2012, the Navy experimented with a 50:50 blend of traditional petroleum-based fuel and biofuel made from waste cooking oil and algae oil. This blend was used successfully on about 40 U.S. surface ships that participated in the Rim of the Pacific (RIMPAC) exercise with ships of other nations. The cost of pure bio-fuel fuel for this demonstration was about $26.00 per gallon, compared to about $3.50 per gallon for conventional fuel at that time.
In 2016, the Navy established the “Great Green Fleet” (GGF) as a year-long initiative to demonstrate the Navy’s ability to transform its energy use.
Source: U.S. Navy
The Navy described this initiative as follows:
“The centerpiece of the Great Green Fleet is a Carrier Strike Group (CSG) that deploys on alternative fuels, including nuclear power for the carrier and a blend of advanced bio-fuel made from beef fat and traditional petroleum for its escort ships. These bio-fuels have been procured by DON (Department of Navy) at prices that are on par with conventional fuels, as required by law, and are certified as “drop-in” replacements that require no engine modifications or changes to operational procedures.”
Deployment of the Great Green Fleet started in January 2016 with the deployment of Strike Group 3 and its flagship, the nuclear-powered aircraft carrier USS John C. Stennis. The conventionally-powered ships in the Strike Group are using a blend of 10% bio-fuel and 90% petroleum. The Navy originally aimed for a 50:50 ratio, but the cost was too high. The Navy purchased about 78 million gallons of blended bio-fuel for the Great Green Fleet at a price of $2.05 per gallon.
C. U.S. Air Force use of bio-fuel:
The USAF has a goal of meeting half its domestic fuel needs with alternative sources by 2016, including aviation fuel.
The Air Force has been testing different blends of jet fuel and biofuels known generically as Hydrotreated Renewable Jet (HRJ). This class of fuel uses triglycerides and free fatty acids from plant oils and animal fats as the feedstock that is processed to create a hydrocarbon aviation fuel.
To meet its energy plan, the USAF plans to use a blend that combines military-grade fuel known as JP-8 with up to 50 percent HRJ. The Air Force also has certified a 50:50 blend of Fisher-Tropsch synthetic kerosene and conventional JP-8 jet fuel across its fleet.
The Air Force Civil Engineer Support Agency (AFCESA), headquartered at Tyndall Air Force Base, Florida is responsible for certifying the USAF aviation fuel infrastructure to ensure its readiness to deploy blended JP-8/bio-fuel.
The U.S. Geologic Survey produces a series of mineral commodity annual reports and individual commodity data sheets. The web page for the index to these reports and data sheets is at the following link:
One particularly interesting document, with a very dull sounding title, is, Mineral Commodity Summaries 2015, which you can download for free at the following link:
This USGS report starts by putting the non-fuel mineral business sector in context with the greater U.S. economy. In the USGS chart below, you can see that the non-fuel mineral business sector makes up 13.5% of the U.S. economy. By dollar volume, net imports of processed mineral materials make up only a small portion (about 1.6%) of the non-fuel mineral business.
In the, Mineral Commodity Summaries 2015, USGS also identified the U.S. reliance on non-fuel minerals imports. Their chart for 2014 is reproduced below.
Many of the above non-fuel minerals have very important uses in high-value products created in other business sectors. A good summary table on this matter appears in the National Academies Press report entitled, Emerging Workforce Trends in the U.S. Energy and Mining Industries: A Call to Action, published in August 2015. You can view or download this report for free at the following link:
In this report, refer to Table 2.5, Common or Essential Products and Some of Their Mineral Components.
Among the minerals with very important roles in modern electrical and electronic components and advanced metals is the family of rare earths, which is comprised of the 17 elements highlighted in the periodic table, below:
the 15 members of the Lanthanide series from 57La (Lanthanum) to 71Lu (Lutetium), and
the two Transitional elements 21Sc (Scandium) and 39Y (Yttrium).
Source: www.rareelementresources.com/
In the above 2014 import reliance chart, USGS reported that the U.S. continued to be a net importer of rare earth minerals (overall, 59% reliant), and that for Scandium the U.S was 100% reliant on imports.
In the Mineral Commodity Summaries 2015, USGS reported the following usage of rare earth minerals in the U.S.:
General uses: catalysts, 60%; metallurgical applications and alloys, 10%; permanent magnets, 10%; glass polishing, 10%; and other, 10%.
Scandium principal uses: solid oxide fuel cells (SOFCs) and aluminum-scandium alloys. Other uses are in ceramics, electronics, lasers, lighting, and radioactive isotopes used as a tracing agent in oil refining
China became the world’s dominant producer of rare earths in the 1990s, replacing U.S. domestic producers, none of which could not compete economically with the lower prices offered by the Chinese producers.
On March 22, 2015, the CBS TV show 60 Minutes featured a segment on the importance of rare earth elements and underscored the need to ensure a domestic supply chain of these critical minerals. You can view this segment at the following link:
In December 2011, the U.S. Department of Energy (DOE) issued a report entitled Critical Materials Strategy, which you can download for free at the following link:
The summary results of the DOE “criticality assessment” are reproduced below
“Sixteen elements were assessed for criticality in wind turbines, EVs (electric vehicles), PV (photovoltaic) cells and fluorescent lighting. The methodology used was adapted from one developed by the National Academy of Sciences. The criticality assessment was framed in two dimensions: importance to clean energy and supply risk. Five rare earth elements (REEs)—dysprosium, terbium, europium, neodymium and yttrium—were found to be critical in the short term (present–2015). These five REEs are used in magnets for wind turbines and electric vehicles or phosphors in energy-efficient lighting. Other elements—cerium, indium, lanthanum and tellurium—were found to be near-critical. Between the short term and the medium term (2015– 2025), the importance to clean energy and supply risk shift for some materials (Figures ES-1 and ES-2).”
While the results of the DOE criticality assessment focused on importance to the energy sector, the identified mineral shortages will impact all business sectors that depend on these minerals, including consumer electronics and national defense.
Further insight on the importance of rare earths is provided by an annual report to the Senate Select Committee on Intelligence entitled, U.S. Intelligence Community Worldwide Threat Assessment Statement for the Record. The report delivered on March 12, 2013 highlighted the national security threat presented by China’s monopoly on rare earth elements. You can download that report at the following link:
The 2013 threat assessment offered the following perspective on the strategic importance of rare earth minerals:
“Rare earth elements (REE) are essential to civilian and military technologies and to the 21st century global economy, including development of green technologies and advanced defense systems. China holds a commanding monopoly over world REE supplies, controlling about 95 percent of mined production and refining. China’s dominance and policies on pricing and exports are leading other countries to pursue mitigation strategies, but those strategies probably will have only limited impact within the next five years and will almost certainly not end Chinese REE dominance.”
While the above focus has been on rare earths, the discussion serves to illustrate that the U.S. is dependent on importing many minerals that are very important to the national economy.
On 15 June 2015, Rutgers University announced the discovery in uranium-contaminated groundwater of bacteria that can breathe uranium and employ it in a reduction chemical reaction that immobilizes the uranium and thereby removes it from solution in the groundwater. Professor Lee Kerkhof, in the School of Environmental and Biological Sciences, leads the Rutgers team that is working with U.S. Department of Energy (DOE) researchers on this project.
The bacteria were discovered in soil at an old uranium ore mill site in Rifle, Colorado, almost 200 miles west of Denver. The bacteria of interest are from a common class known as betaproteobacteria.
The Rifle, CO site today. Source: news.slac.stanford.edu
The Rutgers University announcement states:
“This bacterium can breathe either oxygen or uranium to drive the chemical reactions that provide life-giving energy”.
“Exactly how the strain evolved, Kerkhof said, ‘we are not sure.’ But, he explained, bacteria have the ability to pass genes to each other. So just like bacteria pick up resistance to things like antibiotics and heavy metal toxicity, this bacterium ‘picked up a genetic element that’s now allowing it to detoxify uranium, to actually grow on uranium.’ “
You can read the Rutgers University announcement at the following link:
You can read the April 2015 Rutgers paper, Spatial Distribution of an Uranium-Respiring Betaproteobacterium at the Rifle, CO Field Research Site, at the following link:
An earlier paper published in October 2011, entitled, Influence of Uranium on Bacterial Communities: A Comparison of Natural Uranium-Rich Soils with Controls, identified Acidobacteria, Proteobacteria, and seven others phyla in uraniferous samples. This French study, supported by the Centre National de la Recherche Scientifique, concluded that:
“…our results demonstrate that uranium exerts a permanent high pressure on soil bacterial communities and suggest the existence of a uranium redox cycle mediated by bacteria in the soil.”
You can read the paper written by the French team at the following link:
The TOP500 project was launched in 1993 to implement an improved statistical process for benchmarking the performance of large general purpose computer systems and maintain a list of the 500 most powerful general purpose computer systems in the world based on benchmark test results. The TOP500 website is at:
The TOP500 list ranks computers by their performance on a LINPAC Benchmark test to solve a dense system of linear equations. While this performance metric does not reflect overall performance of a given system, the systematic application of this benchmark test provides a good measure of peak performance and enables a meaningful relative ranking.
The TOP500 list is updated in June and November each year. Tianhe-2 (Milky Way), a supercomputer developed by China’s National University of Defense Technology has maintained the top position in four consecutive TOP500 lists with a performance of 33.86 petaflops [PFLOPS; 1015 floating-point operations per second (FLOPS)], using 17.8 MW (megawatts) of electric power. The growth in supercomputer performance over the past 20 years is shown in the following chart:
Source: TOP500
You can access the November 2014 TOP500 list at the following link:
On 9 April 2015, the U.S. Department of Energy announced a $200 million investment to deliver a next-generation U.S. supercomputer, known as Aurora, to the Argonne Leadership Computing Facility (ALCF) near Chicago. Read the DOE announcement at the following link:
Intel will work with Cray Inc. as the Aurora system integrator sub-contracted to provide its scalable system expertise together with its proven supercomputing technology and the HPC (Hewlett Packard) software stack. Aurora will be based on a next-generation Cray supercomputer, code-named “Shasta,” a follow-on to the Cray® XC™ series. Aurora is expected to have a peak performance of 180 petaflop/s. When commissioned in 2018, this supercomputer will be open to all scientific users.
Argonne and Intel will also provide an interim system, called Theta, to be delivered in 2016, which will help ALCF users transition their applications to the new technology to be used in Aurora.
DOE earlier announced a $325 million investment to build new, state-of-the-art supercomputers at its Oak Ridge and Lawrence Livermore laboratories.