Peter Lobner
The Human Development Index (HDI), which is a measure of the quality of life, was developed in 1990 by the United Nations to enable cross-national comparisons of the state of human development. You can read about the HDI and download the UN’s annual Human Development Reports at the following link:
As you might imagine, there are large HDI differences among the world’s many nations. In its 2016 Human Development Report, the following nations were at the top and bottom of the HDI international ranking:
- The top five places in the global HDI rankings are: Norway (0.949), Australia (0.939), Switzerland (0.939), Germany (0.926) with Denmark and Singapore (0.925) sharing the 5th spot.
- The bottom five countries in rank order of HDI are: Burundi (0.404), Burkina Faso (0.402), Chad (0.396), Niger (0.353) and Central African Republic (0.352).
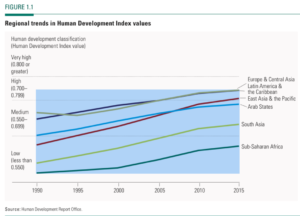
The UN reported that the regional HDI trends from 1990 to 2015 are up in all regions of the world, as shown in the following figure.
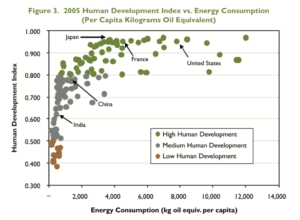
The U.S. Department of Energy (DOE) developed a general correlation between HDI and the annual per capita energy consumption in each nation, as shown in the following figure. Note that annual per capita energy consumption is not a factor in the UN’s determination of HDI.
Source: DOE “Nuclear Energy Research & Development Roadmap – Report to Congress”, April 2010
DOE reports:
“Figure 3 illustrates that a nation’s standard of living depends in part on energy consumption. Access to adequate energy is now and will continue to be required to achieve a high quality of life.”
Based on the 25-year HDI trends reported by the UN (Figure 1.1, above), nations generally have been moving up the HDI scale. Based on the DOE correlation (Figure 3, above), many of these nations, especially the least-developed nations, also should be moving up the scale for per capita energy consumption (to the right in the chart above) as their HDI increases. The net result should be a worldwide trend toward higher median per capita energy consumption. While conservation efforts may help reduce the per capita energy consumption in highly developed nations, there is a large fraction of the world’s population living in less developed nations. In these countries the per capita energy consumption will grow significantly as the local economies develop and the local populations demand basic goods and services that are commonplace in more developed nations.
In his commentary on global warming, Nobel laureate Dr. Ivar Giaever takes issue with CO2 being the cause of global warming by noting that the key “evidence” is a claimed global average temperature increase of 0.8 degrees (288 to 288.8 K) between 1880 and 2013 and a supposed correlation of this temperature increase with the increase of CO2 in the atmosphere. Dr. Giaever takes the position that measuring a worldwide average temperature trend is a difficult task, particularly with the modest number of measurement points available more than a hundred years ago, the consistency of measurement over the period of interest, and the still-modest number of measurement points in many parts of the world today. In addition, he notes that a 0.8 degree K change in worldwide average temperature over a period of 133 years seems to be a very high level of consistency rather than an alarming trend. During that same period, Dr. Giaever noted that world population increased from 1.5 to 7 billion and many human activities contributed to environmental change, yet the impacts of all these additional people are rarely mentioned in the climate change debate. You can watch one of Dr. Giaever lectures at the following link:
https://www.youtube.com/watch?v=SXxHfb66ZgM
What is the impact of having 5.5 billion more people in the world today (and their many ancestors for the past 133 years) on global CO2 emissions? That’s hard to determine, but a simpler starting point is to assess the impact of one additional person.
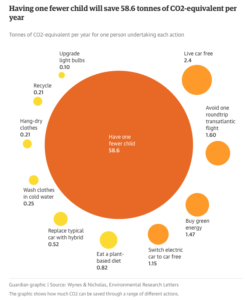
That matter was addressed in a 2017 article by Seth Wynes and Kimberly Nicholas entitled, “The climate mitigation gap: education and government recommendations miss the most effective individual actions,” which was published in Environmental Research Letters. The authors developed a ranking for a wide variety of human activities relative to their contribution to CO2 emission reduction measured in tonnes (metric tons, 2205 pounds) of CO2-equivalent per year. I can tell you that the results are surprising.
A synopsis of these results is published in The Guardian using the following simple graphic.
The study authors, Wynes and Nicholas, concluded:
“We recommend four widely applicable high-impact (i.e. low emissions) actions with the potential to contribute to systemic change and substantially reduce annual personal emissions: having one fewer child (an average for developed countries of 58.6 tonnes CO2-equivalent (tCO2e) emission reductions per year), living car-free (2.4 tCO2e saved per year), avoiding airplane travel (1.6 tCO2e saved per roundtrip transatlantic flight) and eating a plant-based diet (0.8 tCO2e saved per year). These actions have much greater potential to reduce emissions than commonly promoted strategies like comprehensive recycling (four times less effective than a plant-based diet) or changing household lightbulbs (eight times less).”
Surprise!! Population growth adds CO2 to the atmosphere and the biggest impact a person can have on their own carbon footprint is to not have an additional child.
The authors noted that average savings of 58.6 tCO2e per year for having one fewer child applies to developed countries, where we expect per-capita energy consumption to be high. In less developed nations, where we expect lower per-capita energy consumption, the average savings for having one fewer child will be smaller. However, as their HDI continues to increase, the per-capita energy consumption in less developed nations eventually will rise and may approach the values occurring now in medium- or high-developed countries.
You can read the synopsis of the Wynes and Nicholas analysis in The Guardian here:
https://www.theguardian.com/environment/2017/jul/12/want-to-fight-climate-change-have-fewer-children
You can read the full paper in Environmental Research Letters here:
http://iopscience.iop.org/article/10.1088/1748-9326/aa7541
The mathematical approach for estimating the CO2-equivalent per year of an additional child is based on a 2009 paper by Paul A. Murtaugh and Michael G. Schlax entitled, “Reproduction and the carbon legacies of individuals,” and published in Global Environmental Change. The authors state:
“Here we estimate the extra emissions of fossil carbon dioxide that an average individual causes when he or she chooses to have children. The summed emissions of a person’s descendants, weighted by their relatedness to him, may far exceed the lifetime emissions produced by the original parent.”
“It is important to remember that these analyses focus on the carbon legacies of individuals, not populations. For example, under the constant-emission scenario, an extra child born to a woman in the United States ultimately increases her carbon legacy by an amount (9441 metric tons) that is nearly seven times the analogous quantity for a woman in China (1384 tons), but, because of China’s enormous population size, its total carbon emissions (from its human population) currently exceed those of the United States.”
“…..ignoring the consequences of reproduction can lead to serious under-estimation of an individual’s long-term impact on the global environment.”
You can read this complete paper here:
https://www.biologicaldiversity.org/programs/population_and_sustainability/pdfs/OSUCarbonStudy.pdf
How’s your carbon legacy doing?


