Category Archives: Extreme weather

Kelvin-Helmholtz Clouds Look Like Ocean Waves in the Sky

Peter Lobner

I recently saw the following spectacular photos of Kelvin-Helmholtz clouds that had occurred a few days earlier in Wyoming. The website EarthSky, which posted the first photo, reported, “Kelvin-Helmholtz clouds are named for Lord Kelvin and Hermann von Helmholtz, who studied the physics of the instability that leads to this type of cloud formation.” 

 Kelvin-Helmholtz clouds in Sheridan, Wyoming, 6 December 2022.
Source: Abbie Long, via EarthSky Community Photos: https://earthsky.org/earthsky-community-photos/entry/54020/
Kelvin-Helmholtz clouds in Wyoming, 9 December 2022
Source: Rachel Gordon / Facebook via BBC: https://www.bbc.com/news/world-us-canada-63912257

The Hydrometeorology Group website (https://hydrometeology-group1.weebly.com/kelvinndashhelmholtz-instability.html) reports, “Kelvin-Helmholtz clouds are the product of a strong wind shear. Wind shear refers to the rate of change of wind speed, or wind direction, over a set distance. The formation of Kelvin-Helmholtz clouds requires the presence of two vertical air layers of different densities that travel at different speeds. The upper layer must be the warmer and less dense of the two. Given a great enough wind shear, eddies will develop where the two air layers meet.”This type of process is illustrated in the following diagram.

Formation of Kelvin-Helmholtz clouds. 
Source: SKYbrary (https://www.skybrary.aero/articles/kelvin-helmholtz-waves)

You’ll find more photos and details on Kelvin-Helmholtz clouds in the following March 2022 EarthSky article, which notes that Kelvin-Helmholtz formations also can be observed at the interfaces of some cloud bands encircling Jupiter and Saturn: https://earthsky.org/earth/kelvin-helmholtz-clouds/

Kelvin-Helmholtz clouds pattern formed between two of Saturn’s cloud bands.
Source: Astronomy.com (https://astronomy.com/news/2004/10/turbulent-clouds-and-a-rock-steadied-ring

Could Kelvin-Helm clouds have been the inspiration for Vincent Van Gogh’s post-impressionistic masterpiece, The Starry Night, which he painted while recovering in an asylum in Saint Rémy (Provence) France in June 1889?

Source: MoMA, https://www.moma.org/collection/works/79802

For more information

First-ever Lower Colorado River Basin Water Shortage Declaration

Peter Lobner, updated 17 September 2011

At its maximum capacity, Lake Mead water level is at an elevation of 1,220 feet (372 meters) at the Hoover Dam and holds 9.3 trillion gallons (36 trillion liters) of water. It was last at its maximum capacity in 2000 and has been declining since then as shown in the following graph.

Source: Universe Today, data via US Bureau of Reclamation & NASA

In my 18 June 2021 post, I discussed the Lake Mead water supply for Las Vegas and the alarming trend of decreasing water level in Lake Mead as a result of the persistent drought in the watershed for the Colorado River. 

In July, the Bureau of Reclamation began releasing additional water from reservoirs upstream of Lake Powell (which is upstream of Lake Mead) in an attempt to stabilize the lake level and maintain hydropower generation at the Glen Canyon dam (which forms Lake Powell). 

The following chart shows that the Lake Mead water level was at 1,067.72 feet on 17 August 2021, more than seven feet below the 1,075 foot threshold for triggering a water shortage declaration.  The lake level appears to have temporarily stabilized, possibly benefiting from the increased releases into upstream Lake Powell.

Source: Universe Today, data via US Bureau of Reclamation & NASA

On 16 August 2021, the Bureau of Reclamation issued their much anticipated projection of 2022 operating conditions for Lake Powell and Lake Mead. They reported: 

“Given ongoing historic drought and low runoff conditions in the Colorado River Basin, downstream releases from Glen Canyon Dam and Hoover Dam will be reduced in 2022 due to declining reservoir levels. In the Lower Basin the reductions represent the first “shortage” declaration—demonstrating the severity of the drought and low reservoir conditions.”

The planned actions in response to this first-ever shortage declaration take effect on 1 January 2022, as described in the Bureau’s news release here: https://www.usbr.gov/newsroom/#/news-release/3950

In summary, the following cuts in Colorado River water allocations are expected:

  • Arizona:  Loses 18% of the state’s annual apportionment
  • Nevada:  Loses 7% of the state’s annual apportionment
  • Mexico:  Loses about 5% of the country’s annual allotment

California has more senior water rights than Arizona and Nevada and will be spared immediate cutbacks when they are implemented on 1 January 2022.

Additional cuts in water allocations will be triggered if Lake Mead water level continues to decline to the following thresholds:  1,050 feet, 1,045 feet, and 1,025 feet.

Let’s pray for a lot of wet weather in the US southwest.

For more information

NOAA’s Monthly Climate Summaries are Worth Your Attention

Peter Lobner

The National Oceanic and Atmospheric Administration’s (NOAA’s) National Centers for Environmental Information (NCEI) are responsible for “preserving, monitoring, assessing, and providing public access to the Nation’s treasure of climate and historical weather data and information.”  The main NOAA / NCEI website is here:

https://www.ncdc.noaa.gov

The “State of the Climate” is a collection of monthly summaries recapping climate-related occurrences on both a global and national scale.  Your starting point for accessing this collection is here:

https://www.ncdc.noaa.gov/sotc/

The following monthly summaries are available.

I’d like to direct your attention to two particularly impressive monthly summaries:

  • Global Summary Information, which provides a comprehensive top-level view, including the Sea Ice Index
  • Global Climate Report, which provides more information on temperature and precipitation, but excludes the Sea Ice Index information

Here are some of the graphics from the Global Climate Report for June 2019.

Source: NOAA NCEI
Source: NOAA NCEI

NOAA offered the following synopsis of the global climate for June 2019.

  • The month of June was characterized by warmer-than-average temperatures across much of the world. The most notable warm June 2019 temperature departures from average were observed across central and eastern Europe, northern Russia, northeastern Canada, and southern parts of South America.
  • Averaged as a whole, the June 2019 global land and ocean temperature departure from average was the highest for June since global records began in 1880.
  • Nine of the 10 warmest Junes have occurred since 2010.

For more details, see the online June 2019 Global Climate Reportat the following link:

https://www.ncdc.noaa.gov/sotc/global/201906

A complementary NOAA climate data resource is the National Snow & Ice Data Center’s (NSIDC’s) Sea Ice Index, which provides monthly and daily quick looks at Arctic-wide and Antarctic-wide changes in sea ice. It is a source for consistently processed ice extent and concentration images and data values since 1979. Maps show sea ice extent with an outline of the 30-year (1981-2010) median extent for the corresponding month or day. Other maps show sea ice concentration and anomalies and trends in concentration.  In addition, there are several tools you can use on this website to animate a series of monthly images or to compare anomalies or trends.  You’ll find the Sea Ice Index here:

https://nsidc.org/data/seaice_index/

The Arctic sea ice extent for June 2019 and the latest daily results for 23 July 2019 are shown in the following graphics, which show the rapid shrinkage of the ice pack during the Arctic summer.  NOAA reported that the June 2019 Arctic sea ice extent was 10.5% below the 30-year (1981 – 2010) average.  This is the second smallest June Arctic sea ice extent since satellite records began in 1979.

Source:  NOAA NSIDC
Source:  NOAA NSIDC

The monthly Antarctic results for June 2019 and the latest daily results for 23 July 2019 are shown in the following graphics, which show the growth of the Antarctic ice pack during the southern winter season. NOAA reported that the June 2019 Antarctic sea ice extent was 8.5% below the 30-year (1981 – 2010) average.  This is the smallest June Antarctic sea ice extent on record.

Source:  NOAA NSIDC
Source:  NOAA NSIDC

I hope you enjoy exploring NOAA’s “State of the Climate” collection of monthly summaries.

Remote Sensing Shows the Extent of Flooding from Hurricane Harvey and Other Large Flooding Events

Peter Lobner

Dartmouth Flood Observatory, at the University of Colorado, Boulder, CO, integrates international satellite data to develop a worldwide view of surface water issues, and can provide regional maps that show the extent of flooding in areas of interest. Data from many satellite sources are used, including NASA’s MODIS (Moderate Resolution Imaging Spectrometer) and Landsat, European Space Agency’s (ESA) Sentinel 1, ASI (Agenzia Spaziale Italiana) Cosmos-SkyMed, and Canadian Space Agency’s Radarsat 2.

The Dartmouth Flood Observatory homepage is here:

http://floodobservatory.colorado.edu

The world view of large flooding events as of 26 August 2017 is shown in the graphic.

Source: Dartmouth Flood Observatory

The following 31 August 2017 maps show the areas in Texas and Louisiana that were flooded by Hurricane Harvey also known as DFO flood event 4510). Red represents flooded areas, blue represents normal water extent, and dark grey represents urban areas.

Area mapSource: Dartmouth Flood Observatory

Here’s the link to these detailed flooding maps for Hurricane Harvey:

http://floodobservatory.colorado.edu/Events/2017USA4510/2017USA4510.html

This webpage also provides links to other information sources related to Hurricane Harvey.

The Dartmouth Flood Observatory maintains an archive of large flood events from 1985 to present. This archive is accessible online at the following link:

http://floodobservatory.colorado.edu/Archives/index.html

Dartmouth Flood Observatory is a member of the Global Flood Partnership (GFP), which describes itself as, “a cooperation framework between scientific organizations and flood disaster managers worldwide to develop flood observational and modeling infrastructure, leveraging on existing initiatives for better predicting and managing flood disaster impacts and flood risk globally.” For more information on the Global Flood Partnership, visit their homepage and portal at the following links:

https://gfp.jrc.ec.europa.eu/about-us

http://portal.gdacs.org/Global-Flood-Partnership

Is it Possible to Attribute Specific Extreme Weather Events to Global Climate Change?

Peter Lobner

On 7 September 2016, the National Oceanic and Atmospheric Administration (NOAA) reported that climate change increased the chance of record rains in Louisiana by at least 40%. This finding was based on a rapid assessment conducted by NOAA and partners after unusually severe and prolonged rains affected a broad area of Louisiana in August 2016. You can read this NOAA news release at the following link:

http://www.noaa.gov/media-release/climate-change-increased-chances-of-record-rains-in-louisiana-by-at-least-40-percent

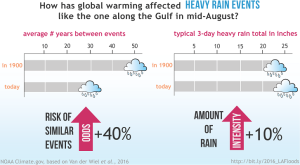
NOAA reported that models indicated the following:

  • The return period for extreme rain events of the magnitude of the mid-August 2016 downpour in Louisiana has decreased from an average of 50 years to 30 years.
  • A typical 30-year event in 1900 would have had 10% less rain than a similar event today; for example, 23 inches instead of 25 inches.

NOAA notes that “return intervals” are statistical averages over long periods of time, which means that it’s possible to have more than one “30-year event” in a 30-year period.

NOAA Lousiana Aug2016 extreme rain graphSource: NOAA

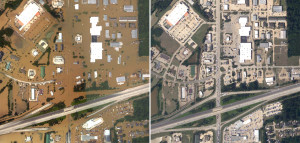
In their news release NOAA included the following aerial photos of Denham Springs, Louisiana. The photo on the left was at the height of the flooding on August 15, 2016. The photo on the right was taken three days later when floodwaters had receded.

NOAA Lousiana Aug2016 extreme rain photosSource: NOAA / National Geodetic Survey

World Weather Attribution (WWA) is an international effort that is, “designed to sharpen and accelerate the scientific community’s ability to analyze and communicate the possible influence of climate change on extreme-weather events such as storms, floods, heat waves and droughts”. Their website is at the following link:

https://wwa.climatecentral.org

WWA attempts to address the question: “Did climate change have anything to do with this?” but on their website, WWA cautions:

“Scientists are now able to answer this for many types of extremes. But the answer may vary depending on how the question is framed……..it is important for every extreme event attribution study to clearly define the event and state the framing of the attribution question.”

To get a feeling for how they applied this principal, you can read the WWA report, “Louisiana Downpours, August 2016,” at the following link:

https://wwa.climatecentral.org/analyses/louisiana-downpours-august-2016/

I find this report quite helpful in putting the Louisiana extreme precipitation event in perspective. I object to the reference to “human-caused climate change,” in the report because the findings should apply regardless of the source of the observed change in climate between 1900 and 2016.

On the WWA website, you can easily navigate to several other very interesting analyses of extreme weather events, and much more.

The National Academies Press (NAP) recently published the following two reports on extreme weather attribution, both of which are worth your attention.

The first NAP report, “Attribution of Extreme Weather Events in the Context of Climate Change,” applies to the type of rapid assessment performed by NOAA after the August 2016 extreme precipitation event in Louisiana. The basic premise of this report is as follows:

“The media, the public, and decision makers increasingly ask for results from event attribution studies during or directly following an extreme event. To meet this need, some groups are developing rapid and/or operational event attribution systems to provide attribution assessments on faster timescales than the typical research mode timescale, which can often take years.”

NAP Attribution of Severe Weather Events  Source: NAP

If you have established a free NAP account, you can download a pdf copy of this report for free at the following link:

http://www.nap.edu/catalog/21852/attribution-of-extreme-weather-events-in-the-context-of-climate-change

The second NAP report, “Frontiers of Decadal Climate Variability,” addresses a longer-term climate issue. This report documents the results of a September 2015 workshop convened by the National Academies of Sciences, Engineering, and Medicine to examine variability in Earth’s climate on decadal timescales, which they define as 10 to 30 years.

NAP Decadal Climate Variation   Source: NAP

This report puts the importance of understanding decadal climate variability in the following context:

“Many factors contribute to variability in Earth’s climate on a range of timescales, from seasons to decades. Natural climate variability arises from two different sources: (1) internal variability from interactions among components of the climate system, for example, between the ocean and the atmosphere, and (2) natural external forcing (functions), such as variations in the amount of radiation from the Sun. External forcing (functions) on the climate system also arise from some human activities, such as the emission of greenhouse gases (GHGs) and aerosols. The climate that we experience is a combination of all of these factors.

Understanding climate variability on the decadal timescale is important to decision-making. Planners and policy makers want information about decadal variability in order to make decisions in a range of sectors, including for infrastructure, water resources, agriculture, and energy.”

While decadal climate variability is quite different than specific extreme weather events, the decadal variability establishes the underlying climate patterns on which extreme weather events may occur.

You can download a pdf copy of this report for free at the following link:

http://www.nap.edu/catalog/23552/frontiers-in-decadal-climate-variability-proceedings-of-a-workshop

I think it’s fair to say that, in the future, we will be seeing an increasing number of “quick response” attributions of extreme weather events to climate change. Each day in the financial section of the newspaper (Yes, I still get a printed copy of the daily newspaper!), there is an attribution from some source about why the stock market did what it did the previous day. Some days these financial attributions seem to make sense, but other days they’re very much like reading a fortune cookie or horoscope, offering little more than generic platitudes.

Hopefully there will be real science behind attributions of extreme weather events to climate change and the attributors will heed WWA’s caution:

“…it is important for every extreme event attribution study to clearly define the event and state the framing of the attribution question.”