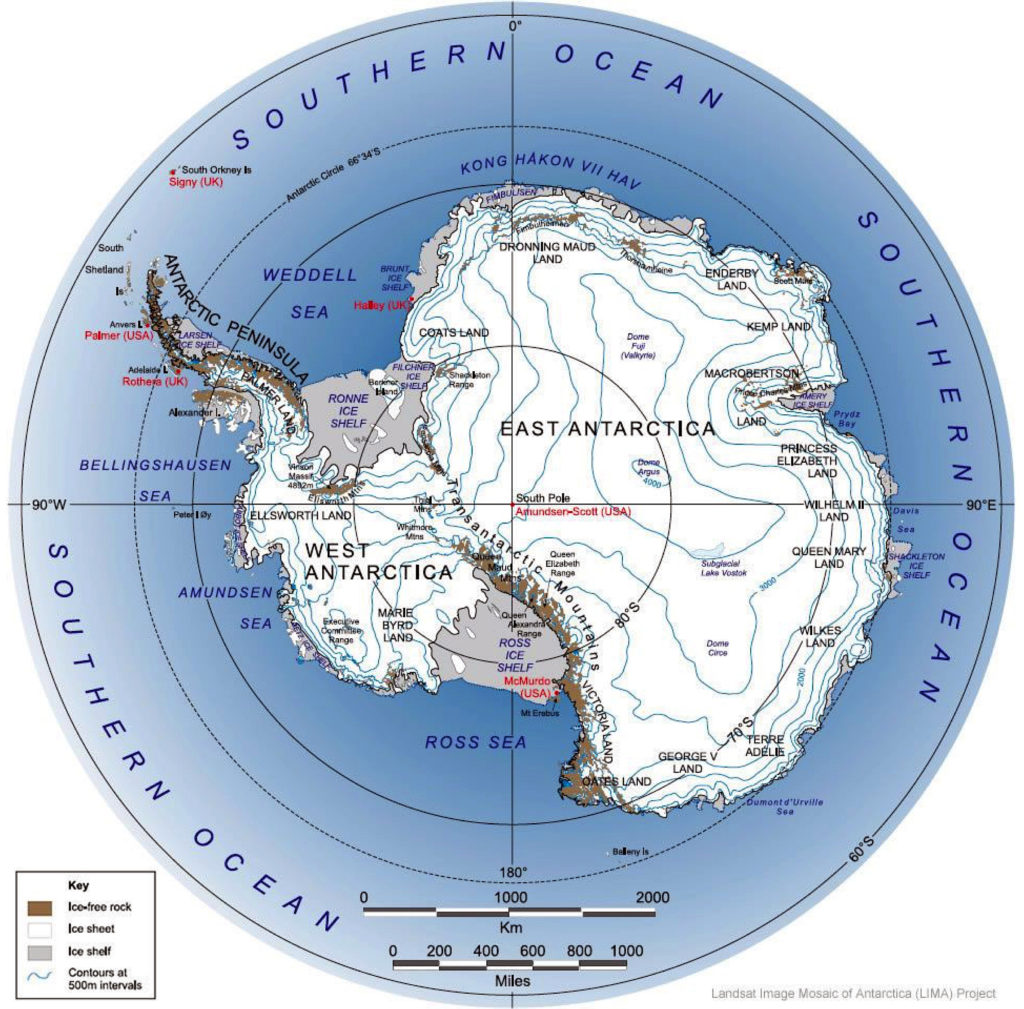
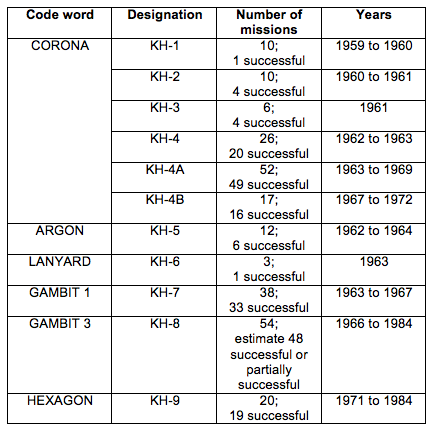
Category Archives: Global Climate

The Earth 300 Eco-Yacht Could Serve as a Prototype for De-carbonizing the World’s Commercial Marine Transportation Fleets

Peter Lobner

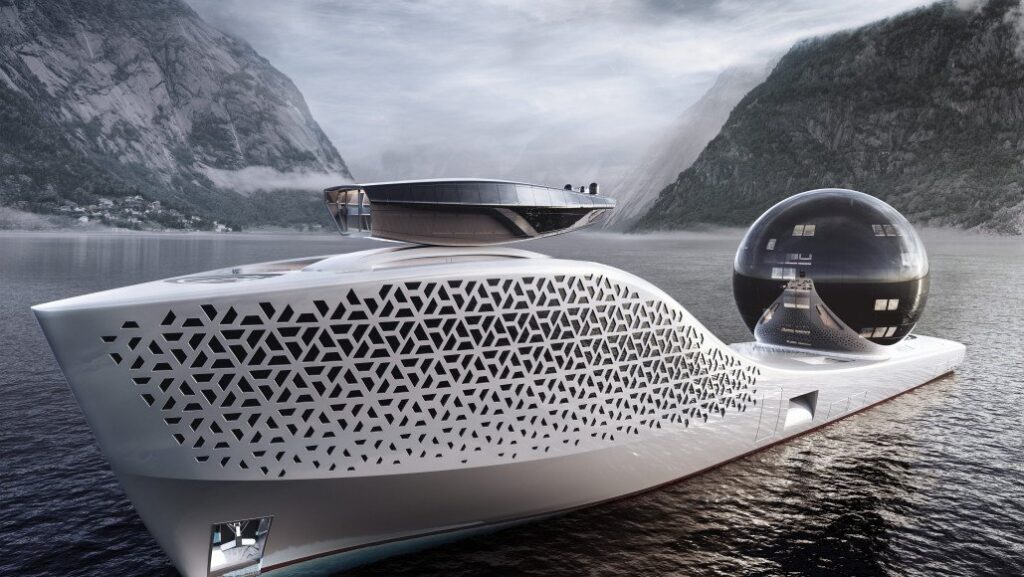
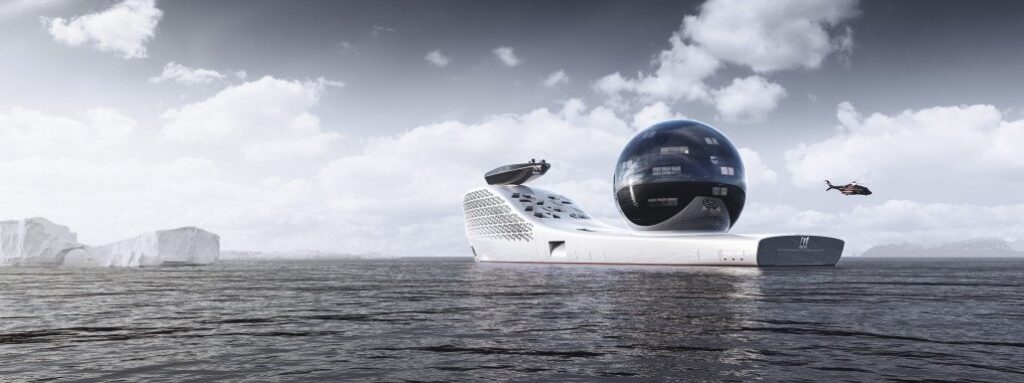
In early April 2021, a flurry of articles described the beautiful, futuristic, nuclear-powered eco-yacht conceived by entrepreneur Aaron Olivera, CEO of Earth 300 (https://earth300.com), and introduced in Singapore as his concept for a signature vessel for conducting environmental research and raising environmental awareness around the world.

Aaron Olivera and the Earth 300 eco-yacht. Source: Archyde.com

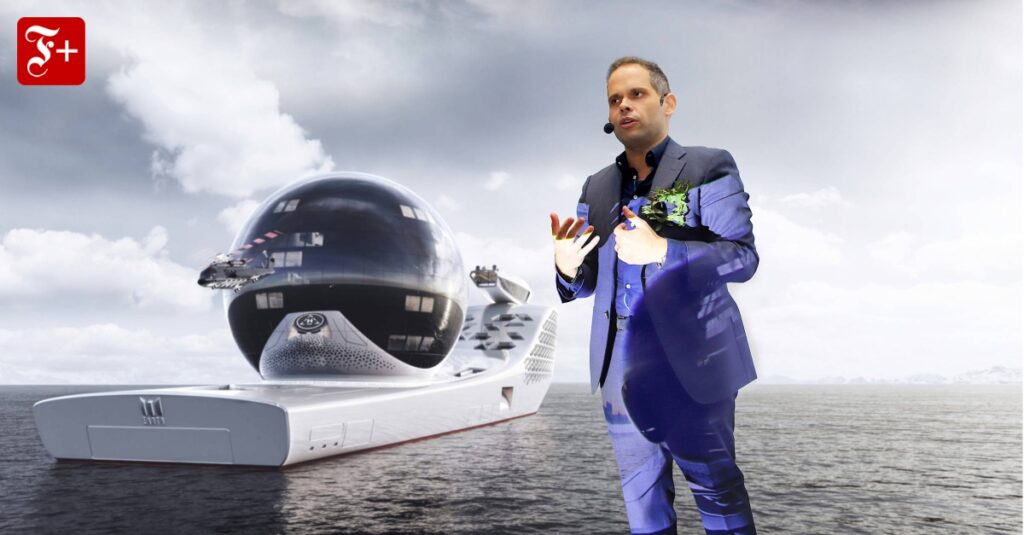
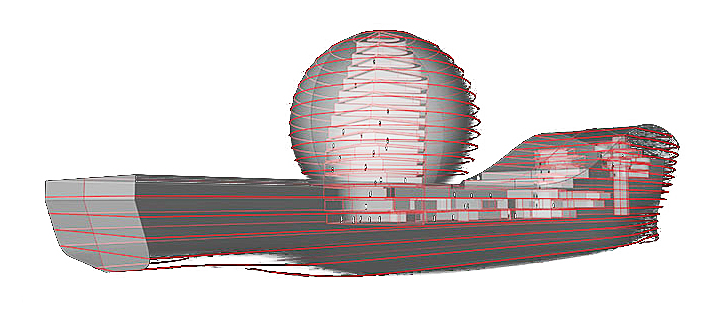
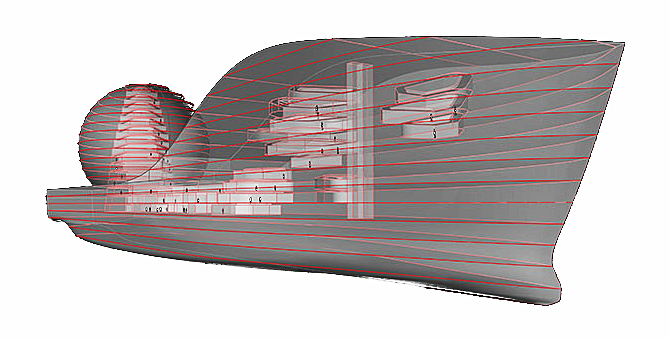
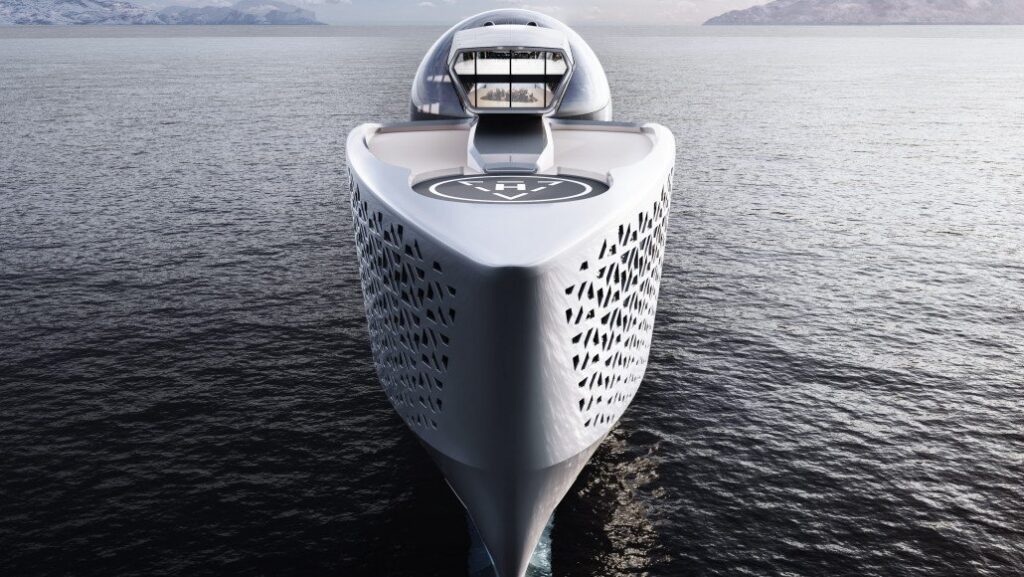
This sleek yacht is almost 300 meters long with a prominent cantilevered observation deck near the bow and a 13-story glass “science sphere” amidships. Olivera describes this vessel as follows: 

“Earth 300 it is an extreme technology platform for science, exploration and innovation at sea. Its mission is to ring the ecological alarm on a global scale and combat climate change. Using technology it will quickly scale and deploy solutions to market. Its ultimate ambition is to inspire billions of people to contribute to the preservation of our shared planet, and becoming a sustainable and future worthy civilization.”

The ship’s design was developed by Ivan Salas Jefferson, founder of Iddes Yachts (https://iddesyachts.com), in collaboration with the Polish naval architecture firm NED (https://www.ned-project.eu). Mikal Bøe is the CEO of London-based Core Power (https://corepower.energy), which will supply the next-generation, inherently safe marine molten salt reactor (m-MSR) power plant, using MSR technology developed by the US nuclear company TerraPower (https://www.terrapower.com) that was co-founded by Bill Gates. 

The general arrangement of the ship’s inhabited spaces.
Source: Earth 300

The current design has taken six years and $5 million to develop.  Earth 300 reports that it is making good progress toward getting an Approval in Principle (AIP) from RINA (formerly Registro Italiano Navale). RINA is a founding member of the International Association of Classification Societies (IACS), which promotes safer and cleaner shipping worldwide.  The AIP is a framework used by RINA to review and approve innovative and novel concepts that are not covered by traditional classification prescriptive rules, so that a level of safety in line with the current marine industry practice is provided. The AIP process is a risk-based approach to classification that allows for new designs and novel concepts to be validated with safety equivalencies.

Following the AIP, Earth 300 should be able to request construction quotes from one or more shipyards, likely in Europe and/or South Korea. The ship will be equipped with 22 laboratories for about 160 scientists, cutting-edge artificial intelligence (AI) and robotics systems, and facilities for operating helicopters and submersible and semi-submersible vehicles.  Earth 300 executives reportedly estimated that the total construction cost will be between $500 million and $700 million.

The observation deck is located atop the bow section of the ship.
Source: Earth 300
Foredeck helipad and hangar for a helicopter. Source: Earth 300
The sphere houses a “science city” where most of the shipboard research facilities are located.  Source: Earth 300

Once in operation, the ship is certain to command attention wherever it goes, as a recognizable symbol for environmental protection.  This notoriety may be enough to attract wealthy tourists willing to pay $3 million for a 10-day cruise in the 10 luxury suites with private balconies and accommodations for personal staff in a separate set of cabins.  That sort of money will buy a lot of selfies, instagrams and some durable bragging rights. 

The ship is designed to accommodate 425 people, including the ship’s crew, scientists, and the group of wealthy tourists paying full price. In addition, it has been reported that Olivera envisages inviting groups of other people to travel at a lower price or even for free. For example, 10 suites would be made available to what Olivera calls Very Interesting Persons – people from all walks of life who would bring unique experience or knowledge to the voyage. In addition, some lucky artists, explorers and students may travel for free.

While I’m impressed with the general concept of this ship, I feel that the primary benefit of this grand vessel can’t be to serve as a mobile marine “mixer” for a few very wealthy individuals to associate with scientists, some elite Very Interesting Persons, and a patchwork of others interested in environmental protection.

Like the 3 AM infomercial says, “But wait, there’s more.” Research performed aboard the ship would be “open source” and shared with other research efforts around the world.  That’s great, but more information is needed on the meaningful research programs that would be conducted on the Earth 300 vessel in segments that match the schedule and route of what is essentially a cruise ship.  It seems that a much less expensive dedicated vessel could accomplish the same research while not serving as an environmental sideshow on a cruise ship.

With the ship scheduled to launch in 2025, the vessel itself will be ready many years before the planned marine molten salt reactors (m-MSRs) have been developed and approved by the appropriate nuclear and marine regulatory agencies.  Therefore, it is likely that the vessel will be designed to operate initially with a conventional marine power plant running on synthetic “renewable” fuels.  This isn’t exactly a big step in the right direction for helping to reduce the carbon emissions from worldwide commercial marine transportation.

Like the 3 AM infomercial says, “But wait, there’s more,” or at least, there should be.

Core Power, the developer of the m-MSR planned for the Earth 300 vessel, is designing their 15 MWe inherently safe micro-reactor system as a zero-carbon replacement power source for the fossil-fueled power plants in many commercial marine vessels. On their website, Core Power presents the following business case:

“Over the next few decades as many as 60,000 ships must transition from combustion of fossil fuels to zero-emission propulsion. The UN’s maritime agency IMO has mandated with unanimous approval from 197 countries that shipping must reduce emissions by 50% of the 2008 total, before 2050. This means an actual emission reduction of almost 90%, by 2050. MSR technology being developed by the consortium could achieve that goal, by powering production of green sustainable fuels for smaller ships and providing onboard electric power for large ships, with zero emissions as standard.”

A set of six small, compact Core Power m-MSRs could generate
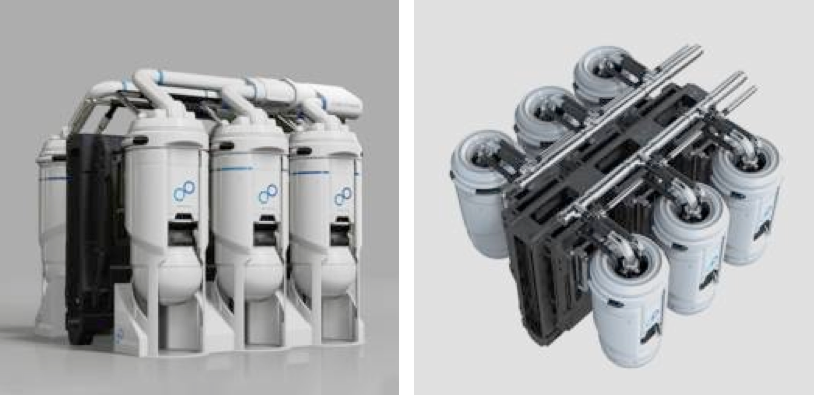
90 MWe (about 120,000 hp). Source: Core Power

I think it is actually fortuitous that the Earth 300 vessel will start its life as a fossil-fueled vessel.  From this starting point, Earth 300 will be at the vanguard of a new generation of inherently safe marine nuclear power system development and deployment.

Converting the Earth 300 vessel to nuclear power will move the discussions on commercial marine nuclear power from the academic domain, where it has languished for many decades, to the commercial marine nuclear safety regulatory domain, which has been inactive for decades and likely is not prepared for this new applicant.  By being first in line, Earth 300 and Core Power take on substantial licensing risk that certainly will add to the time and cost of their nuclear licensing efforts.  However, they are in unique positions as a reactor supplier and a vessel operator to help shape the licensing dialogue pertaining to the use of inherently safe micro-reactors in marine vessels, and the worldwide operation of vessels using such reactors.

The experience gained from converting Earth 300 from fossil to nuclear power will de-risk the nuclear power conversion process for the entire marine transportation industry.  

  • Regulatory precedents will have been established for the reactor designer and the vessel operator. 
  • The conversion experience will yield many metrics and lessons learned that will help in planning and executing subsequent conversions. 
  • Ports around the world will be on notice that commercial nuclear-powered vessels once again are a reality and appropriate port-specific nuclear safety plans may be required

In this role alone, Earth 300 will create a path for the commercial marine transportation industry to meet the IMO’s 2050 emission goal.  This would be a truly substantive accomplishment that will far outweigh the ship’s public relations accomplishments as a symbol of environmental protection and showcase for environmental research.

I hope Aaron Olivera gets the support he needs to build the Earth 300 ship and subsequently convert it to nuclear power.  At one level, the ship is a grand gesture.  On another level, the nuclear powered ship is a substantive step toward a future with zero-carbon commercial marine transportation.

For more information

Antarctica – What’s Under All That Ice?

Peter Lobner, Updated 24 August 2021

From space, Antarctica gives the appearance of a large, ice-covered continental land mass surrounded by the Southern Ocean.  The satellite photo mosaic, below, reinforces that illusion.  Very little ice-free rock is visible, and it’s hard to distinguish between the continental ice sheet and ice shelves that extend into the sea.

Satellite mosaic image of Antarctica created by Dave Pape, 
adapted to the same orientation as the following maps. 
 Source.  https://geology.com/world/antarctica-satellite-image.shtml

The following topographical map presents the surface of Antarctica in more detail, and shows the many ice shelves (in grey) that extend beyond the actual coastline and into the sea.  The surface contour lines on the map are at 500 meter (1,640 ft) intervals.

Map of Antarctica and the Southern Ocean showing the topography of Antarctica (as blue lines), research stations of the United States and the United Kingdom (in red text), ice-free rock areas (in brown), ice shelves (in gray) and names of the major ocean water bodies (in blue uppercase text).
Source: LIMA Project (Landsat Image Mosaic of Antarctica) via Wikipedia

The highest elevation of the ice sheet is 4,093 m (13,428 ft) at Dome Argus (aka Dome A), which is located in the East Antarctic Ice Sheet, about 1,200 kilometers (746 miles) inland.  The highest land elevation in Antarctica is Mount Vinson, which reaches 4,892 meters (16,050 ft) on the north part of a larger mountain range known as Vinson Massif, near the base of the Antarctic Peninsula.  This topographical map does not provide information on the continental bed that underlies the massive ice sheets.

A look at the bedrock under the ice sheets: Bedmap2 and BedMachine

In 2001, the British Antarctic Survey (BAS) released a topographical map of the bedrock that underlies the Antarctic ice sheets and the coastal seabed derived from data collected by international consortia of scientists since the 1950s. The resulting dataset was called  BEDMAP1.  

In a 2013 paper, P. Fretwell, et al. (a very big team of co-authors), published the paper, “Bedmap2: Improved ice bed, surface and thickness datasets for Antarctica,” which included the following bed elevation map, with bed elevations color coded as indicated in the scale on the left.  As you can see, large portions of the Antarctic “continental” bedrock are below sea level.

Bedmap2 bed elevation grid.  Source:  Fretwell 2013, Fig. 9

You can read the 2013 Fretwell paper here:  https://www.the-cryosphere.net/7/375/2013/tc-7-375-2013.pdf

For an introduction to Antarctic ice sheet thickness, ice flows, and the topography of the underlying bedrock, please watch the following short (1:51) 2013 video, “Antarctic Bedrock,” by the National Aeronautics and Space Administration’s (NASA’s) Scientific Visualization Studio:

NASA explained:

  • “In 2013, BAS released an update of the topographic dataset called BEDMAP2 that incorporates twenty-five million measurements taken over the past two decades from the ground, air and space.”
  • “The topography of the bedrock under the Antarctic Ice Sheet is critical to understanding the dynamic motion of the ice sheet, its thickness and its influence on the surrounding ocean and global climate. This visualization compares the new BEDMAP2 dataset, released in 2013, to the original BEDMAP1 dataset, released in 2001, showing the improvements in resolution and coverage.  This visualization highlights the contribution that NASA’s mission Operation IceBridge made to this important dataset.”

On 12 December 2019, a University of California Irvine (UCI)-led team of glaciologists unveiled the most accurate portrait yet of the contours of the land beneath Antarctica’s ice sheet.  The new topographic map, named “BedMachine Antarctica,”  is shown below.

BedMachine Antarctica topographical map showing the underlying ground features and the large portions of the continental bed that are below sea level.  
 Credit: Mathieu Morlighem / UCI

UCI reported:

  • “The new Antarctic bed topography product was constructed using ice thickness data from 19 different research institutes dating back to 1967, encompassing nearly a million line-miles of radar soundings. In addition, BedMachine’s creators utilized ice shelf bathymetry measurements from NASA’s Operation IceBridge campaigns, as well as ice flow velocity and seismic information, where available. Some of this same data has been employed in other topography mapping projects, yielding similar results when viewed broadly.”
  • “By basing its results on ice surface velocity in addition to ice thickness data from radar soundings, BedMachine is able to present a more accurate, high-resolution depiction of the bed topography. This methodology has been successfully employed in Greenland in recent years, transforming cryosphere researchers’ understanding of ice dynamics, ocean circulation and the mechanisms of glacier retreat.”
  • “BedMachine relies on the fundamental physics-based method of mass conservation to discern what lies between the radar sounding lines, utilizing highly detailed information on ice flow motion that dictates how ice moves around the varied contours of the bed.”

The net result is a much higher resolution topographical map of the bedrock that underlies the Antarctic ice sheets.  The authors note:“This transformative description of bed topography redefines the high- and lower-risk sectors for rapid sea level rise from Antarctica; it will also significantly impact model projections of sea level rise from Antarctica in the coming centuries.”

You can take a visual tour of BedMachine’s high-precision model of Antarctic’s ice bed topography here.  Enjoy your trip.

There is significant geothermal heating under parts of Antarctica’s bedrock

West Antarctica and the Antarctic Peninsula form a connected rift / fault zone that includes about 60 active and semi-active volcanoes, which are shown as red dots in the following map.  

Volcanoes located along the branching West Antarctic Fault/Rift System.
Source:  James Kamis, Plate Climatology, 4 July 2017

In a 29 June 2018 article on the Plate Climatology website, author James Kamis presents evidence that the fault / rift system underlying West Antarctica generates a significant geothermal heat flow into the bedrock and is the source of volcanic eruptions and sub-glacial volcanic activity in the region.  The heat flow into the bedrock and the observed volcanic activity both contribute to the glacial melting observed in the region.  You can read this article here:

http://www.plateclimatology.com/geologic-forces-fueling-west-antarcticas-larsen-ice-shelf-cracks/

The correlation between the locations of the West Antarctic volcanoes and the regions of higher heat flux within the fault / rift system are evident in the following map, which was developed in 2017 by a multi-national team.

Geothermal heat flux distribution at the ice-rock interface superimposed on subglacial topography.  Source:  Martos, et al., Geophysical Research Letter 10.1002/2017GL075609, 30 Nov 2017

The authors note: “Direct observations of heat flux are difficult to obtain in Antarctica, and until now continent-wide heat flux maps have only been derived from low-resolution satellite magnetic and seismological data. We present a high-resolution heat flux map and associated uncertainty derived from spectral analysis of the most advanced continental compilation of airborne magnetic data. …. Our high-resolution heat flux map and its uncertainty distribution provide an important new boundary condition to be used in studies on future subglacial hydrology, ice sheet dynamics, and sea level change.”  This Geophysical Research Letter is available here:  

https://agupubs.onlinelibrary.wiley.com/doi/pdf/10.1002/2017GL075609

The results of six Antarctic heat flux models developed from 2004 to 2017 were compared by Brice Van Liefferinge in his 2018 PhD thesis.  His results, shown below, are presented on the Cryosphere Sciences website of the European Sciences Union (EGU). 

Spatial distributions of geothermal heat flux: (A) Pollard et al. (2005) constant values, (B) Shapiro and Ritzwoller (2004): seismic model, (C) Fox Maule et al. (2005): magnetic measurements, (D) Purucker (2013): magnetic measurements, (E) An et al. (2015): seismic model and (F) Martos et al. (2017): high resolution magnetic measurements.  Source:  Brice Van Liefferinge (2018) PhD Thesis.

Regarding his comparison of Antarctic heat flux models, Van Liefferinge reported:  

  • “As a result, we know that the geology determines the magnitude of the geothermal heat flux and the geology is not homogeneous underneath the Antarctic Ice Sheet:  West Antarctica and East Antarctica are significantly distinct in their crustal rock formation processes and ages.”
  • “To sum up, although all geothermal heat flux data sets agree on continent scales (with higher values under the West Antarctic ice sheet and lower values under East Antarctica), there is a lot of variability in the predicted geothermal heat flux from one data set to the next on smaller scales. A lot of work remains to be done …” 

The effects of geothermal heating are particularly noticeable at Deception Island, which is part of a collapsed and still active volcanic crater near the tip of the Antarctic Peninsula.  This high heat flow volcano is in the same major fault zone as the rapidly melting / breaking-up Larsen Ice Shelf.  The following map shows the faults and volcanoes in this region.  

Key geological features in the Larsen “C” sea ice segment area.  
Source:  James Kamis, Plate Climatology, 4 July 2017
Tourists enjoying the geothermally heated ocean water at Deception Island.  
Source: Public domain

So, if you take a cruise to Antarctica and the Cruise Director offers a “polar bear” plunge, I suggest that you wait until the ship arrives at Deception Island.  Remember, this warm water is not due to climate change.  You’re in a volcano.

For more information on Bedmap 2 and BedMachine:

  • “Antarctic Bedrock,” Visualizations by Cindy Starr,  NASA Scientific Visualization Studio, Released on June 4, 2013:  https://svs.gsfc.nasa.gov/4060
  • Morlighem, M., Rignot, E., Binder, T. et al. “Deep glacial troughs and stabilizing ridges unveiled beneath the margins of the Antarctic ice sheet,” Nature Geoscience (2019) doi:10.1038/s41561-019-0510-8:  https://www.nature.com/articles/s41561-019-0510-8

More information on geothermal heating in the West Antarctic rift / fault zone:

Many European Union (EU) “Green Deal” Energy Advocates are Hypocrites

Updated 16 December 2019, 20 March & 5 May 2020

Peter Lobner

In a 12 December 2019 NUCNET article, David Dalton, reporting on the United Nations Framework Convention on Climate Change (COP25) in Madrid, summarized the following points made by International Atomic Energy Agency (IAEA) director-general Rafael Mariano Grossi:

  • The world is “well off the mark” from reaching the climate goals of the Paris Agreement.
  • Around two-thirds of the world’s electricity still is generated through burning fossil fuels.
  • Greater use of low-carbon nuclear power is needed to ensure the global transition to clean energy includes a baseload backup to variable renewable energy sources such as solar and wind.
  • Greater deployment of a diverse mix of low-carbon sources such as hydro, wind and solar, as well as nuclear power, and battery storage, will be needed to reverse that trend and set the world on track to meet climate goals.

I concur with these points and feel that Mr. Grossi has laid out a reasonable and responsible position on the future role of nuclear power in “green” energy solutions that are focused on the primary goal of  reducing worldwide carbon dioxide emissions.  The commercial nuclear power industry has demonstrated the ability to reliably generate carbon-free electricity, 24 hours a day, seven days a week, in units of a thousand megawatts or more per power plant.  Except for the largest hydroelectric facilities, no other component of a carbon-neutral energy infrastructure offers such capabilities, which are essential for delivering 24/7 service to large users and stabilizing the grid.  Unfortunately, Mr. Grossi’s view is not shared by many EU energy advocates seeking to get member states to agree to the EU “Green Deal.”

You can read David Dalton’s complete article here:  https://www.nucnet.org/news/nuclear-and-renewables-are-not-in-competition-with-each-other-12-4-2019

The EU Energy Union and the “Green Deal”

The European Energy Union is the implementation of the 2019 Juncker Commission’s Priority #3 recommendation for a resilient energy union with a forward-looking climate change policy.  You can read a summary of the Commission’s recommendations here: http://www.europarl.europa.eu/RegData/etudes/IDAN/2019/637943/EPRS_IDA(2019)637943_EN.pdf

The Energy Union has quite a challenge, starting with the EU’s energy mix (circa 2016) as shown in the following chart:

EU 2016 energy mix.  Source:  EU Statistical Pocketbook 2018

Complicating matters, the EU currently imports nearly 40% of its natural gas from Russia. 

The European Union’s Green Deal is described as “a new growth strategy that aims to transform the EU into a fair and prosperous society, with a modern, resource-efficient and competitive economy where there are no net emissions of greenhouse gases in 2050 and where economic growth is decoupled from resource use.”  You’ll find the EU’s 11 December 2019 detailed description of the Green Deal here: https://eur-lex.europa.eu/legal-content/EN/TXT/?qid=1576150542719&uri=COM%3A2019%3A640%3AFIN

For more information, see the EU “Green Deal” website here: https://ec.europa.eu/info/index_en

To enforce this “Green Deal,” the EU intends to adopt a “climate law” that is scheduled to be presented to Member States in March 2020.

The EU’s “Green Deal” is strongly biased against almost anything except renewable energy sources

On 11 December 2019, Reuters reported that, “European Union states have blocked a set of new rules governing which financial products can be called ‘green’ and ‘sustainable’, EU officials said, in a major setback for the bloc’s climate ambitions.”  The Reuters report noted that EU lawmakers wanted nuclear and fossil fuel funding clearly excluded from the definition of “green” investments. You can read this Reuters report here: https://af.reuters.com/article/commoditiesNews/idAFL8N28L3GD

This EU position is a particular problem for France, where nuclear power provided 71.7% of total French generating capacity in 2018 and about 90% of total electrical capacity was provided by low-carbon sources (nuclear + renewables).  In October 2019, Électricité de France announced that it is planning to make a decision in 2021 on building several more large nuclear power plants, which will be needed in the next decade as its oldest 900 MWe pressurized water reactor (PWR) plants start reaching their retirement age.

In contrast, nuclear power provided 11.8% of total German generating capacity in 2018 and about 47% of total electrical capacity was provided by low-carbon sources (nuclear + renewables), while 48.3% of total generating capacity was provided by a fossil fuel sources.  Germany plans to decommission the last of its seven remaining nuclear power plants, representing an aggregate of 9,256 MWe of carbon-free electric generating capacity, in the next three years, by December 2022.  It will be a challenge for new renewable energy sources to be deployed in time to make up for the lost carbon-free generating capacity from nuclear power.  It is notable that Germany gets 7% of its total generating capacity from burning biomass, which the EU, in its great wisdom, defines as a carbon-neutral renewable energy source.  More on that later.

How does the EU define “clean energy”?

The EU’s definition of “clean energy” is rather elusive.  On the EU Green Deal website, the Clean Energy fact sheet identifies the following three “key principle:” 

  • Prioritize energy efficiency and develop a power sector based largely on renewable sources
  • Secure and affordable EU energy supply
  • Fully integrated, interconnected and digitalized EU energy market

Only “renewable sources” are actually defined as sources for “clean energy.”  Nuclear power is not identified as a “clean” energy source.  I was unable to find on the EU Green Deal website any performance metrics related to “clean” energy source performance relative to carbon emissions.

Here’s the link to the EU Clean Energy Fact Sheet:  https://ec.europa.eu/commission/presscorner/detail/en/fs_19_6723

Another EU description of “clean energy” can be found the “Clean Energy for all Europeans” program, which focuses on the following:

  • Energy efficiency first, focusing on energy saving opportunities and “smarter” / “greener” buildings.
  • More renewables, with a new target of at least 32% in renewable energy by 2030
  • Better governance of the Energy Union, including a new energy “rulebook” under which each EU Member State drafts a National Energy and Climate Plan (NECP)
  • More rights for consumers to produce, store or sell their own energy
  • Smarter and more efficient electricity market

The Clean Energy for all Europeans program is described here: https://ec.europa.eu/info/news/clean-energy-all-europeans-package-completed-good-consumers-good-growth-and-jobs-and-good-planet-2019-may-22_en

The focus is on a distributed electric power infrastructure that takes advantage of many ways to improve energy efficiency, manage power consumption and generate power from distributed renewable energy sources.  Nuclear power is not mentioned at all in this document.  However, “large scale biopower” from agricultural and forest sources is addressed. 

How does the EU define “renewable energy sources”?

The latest EU directive on the promotion of energy use from renewable sources is Directive (EU) 2018/2001, dated 11 December 2018.  The definition of “renewable energy sources” traces back to Directive 2003/54/EC, dated 26 June 2003:

“Renewable energy sources” means renewable non-fossil energy sources (wind, solar, geothermal, wave, tidal, hydropower, biomass, landfill gas, sewage treatment plant gas and biogases)

So, fossil energy sources are excluded and nuclear energy sources are not included.

This seems logical but the devil is in the details.  The main problem is that EU energy policy equates “renewable” with being “carbon free,” when, for some renewable energy sources, this is far from the truth.  As an example, existing EU policy treats burning wood fuel in power plants as carbon-neutral while this fuel generates 15 to 20% more carbon dioxide per megawatt than the coal fuel it replaces.  This has resulted in a trend among EU coal-burning power plants to switch to wood pellets and claim the emission credit while actually polluting more than before.  See my 7 January 2017 post, “Hey, EU!! Wood may be a Renewable Energy Source, but it isn’t a Clean Energy Source,” for details.  The direct link to this post is here: https://lynceans.org/all-posts/hey-eu-wood-may-be-a-renewable-energy-source-but-it-isnt-a-clean-energy-source/

Fortunately, this matter may be on its way to being addressed in an EU court.  A 4 March 2019 article by Karen Savage, writing for Climate Liability News, reports, “The suit, which was filed in the European General Court in Luxembourg, asks the court to prevent EU countries from counting forest wood as a renewable energy source under the 2018 revised Renewable Energy Directive known as RED II.”  Major sources of wood pellets used in EU power plants are in the southeast U.S., where greatly increased logging activities are depleting established, slow-growth hardwood forests.  So the EU is OK with a “clean” energy policy that, in practice, increases current pollution locally in the EU while simultaneously stripping hardwood forests in a location outside of the EU. It seems to me that this is an environmental “double whammy” that can only make sense on paper, but not in practice.  You can read Karen Savage’s article here: https://www.climateliabilitynews.org/2019/03/04/biomass-european-union-lawsuit/

Conclusions

Regarding the EU Green Deal and Energy Union, I’m certain that the devil is in the details, and EU Member States need to have the opportunity to assess these details so there is no misunderstanding when EU climate laws are passed.  

The EU’s Green Deal has major flaws and needs to be recast to acknowledge the important role that nuclear power can play as a large, carbon-free source of electric power while also helping to ensure 24/7 grid stability.  Failing to recognize the role of nuclear power as a carbon-free source of electric power will serve to highlight the strong bias and hypocrisy of an EU energy leadership that has lost its way.  It also would serve as another example of why Brexit makes sense.

Even fossil power, with appropriate advanced environmental controls, should have a role in the Green Deal.  For example, a rapid shift away from coal to natural gas would significantly decrease near-term carbon dioxide emissions.  Similarly, abandoning the laughable EU policy on “carbon-neutral” biomass would eliminate a significant source of carbon dioxide emissions within the EU, and it would save environmentally valuable hardwood forests in the southeast U.S. and elsewhere.

Update: 16 December 2019 – Finally, some common sense prevailed, but only under very intense political pressure and, probably, fear of failure

In an article by Samuel Petrequin, “EU leaders include nuclear energy in green transition,” the Associated Press reported: 

“EU heads of state and government agreed that nuclear energy will be recognized as a way to fight climate change as part of a deal that endorsed the climate target. While Poland did not immediately agree to the plan, the concessions on nuclear energy were enough for the Czech Republic and Hungary to give their approval.  The two nations had the support of France, which relies on nuclear power for 60% of its electricity. They managed to break the resistance of skeptical countries, including Luxembourg, Austria and Germany to get a clear reference to nuclear power in the meeting’s conclusions. ‘Nuclear energy is clean energy,’ Czech Prime Minister Andrej Babiš said. ‘I don’t know why people have a problem with this.’”

You can read the complete AP article here: https://apnews.com/faae3503fe497af36e8d2e9a4d13b62a

The European Council memorandum contains only a single reference to “nuclear,” more in the form of a resigned acknowledgement rather than an endorsement.  

“The European Council acknowledges the need to ensure energy security and to respect the right of the Member States to decide on their energy mix and to choose the most appropriate technologies. Some Member States have indicated that they use nuclear energy as part of their national energy mix.”

You can read the European Council memorandum here: https://www.consilium.europa.eu/media/41768/12-euco-final-conclusions-en.pdf

Congratulations to the representatives from France, Czech Republic, Hungary, Poland and others for fighting the hard political fight and winning a place for nuclear power in the EU’s Green Deal.  But be watchful because the EU anti-nuclear forces are still there.

Update:  20 March 2020 – Yes, the EU anti-nuclear forces are still there.

On 10 March 2020 the European Commission issued a press release announcing its new industrial strategy, “Making Europe’s businesses future-ready: A new Industrial Strategy for a globally competitive, green and digital Europe.”  You can read the press release and download related documents here:  https://ec.europa.eu/commission/presscorner/detail/en/ip_20_416

While the plan highlights the need to “secure a sufficient and constant supply of low-carbon energy at competitive prices,” the word “nuclear” is notably absent from the EU’s industrial strategy.  Not much of a surprise, considering the EU’s behavior on the Green New Deal.

The next day, on 11 March, the Brussels-based nuclear industry group Foratom called on the EU decision-makers to support the nuclear sector’s important role within the EU economy.  Foratom’s Director General,  Yves Desbazeille, noted, “Not only is it (nuclear) low-carbon, it is also flexible, dispatchable and cost-effective”.

Foratom highlighted the following key attributes of nuclear energy in the context of the EU industrial strategy:

  • Maintain the competitiveness of Europe’s industry as energy often accounts for a significant share of manufacturing costs,
  • Decarbonize industry and thus contribute towards the 2050 carbon neutrality target,
  • Provide industry with the energy it needs when it needs it, which is particularly important for processes which run 24/7,
  • Other industries by offering alternative sources of decarbonized energy such as hydrogen and heat (sector coupling).

You can read Foratom’s complete statement here: https://www.foratom.org/press-release/foratom-calls-for-the-eu-to-recognise-nuclear-as-a-strategic-industry/

This is further evidence that EU nuclear energy advocates are fighting an uphill battle for recognition by the entrenched EU bureaucracy that nuclear power is a zero-carbon source of power and it can make an important (and maybe essential) contribution to meeting the EU’s 2050 carbon neutrality goal.

Best wishes to Foratom in their efforts to secure a place in the EU industrial strategy for nuclear power.

Update 5 May 2020 – More support for EU nuclear power

SNETP (Sustainable Nuclear Energy Technology Platform) was established in 2007, with EC support, as a group of non-governmental organizations that promote and coordinate research on nuclear fission.  

On 24 April 2020, SNETP sent a letter, endorsed by more than 100 organizations, to the Vice-presidents of the European Commission and the EU Commissioner for Energy calling for a “just and timely assessment of nuclear energy in the EU Taxonomy of Sustainable Finance.”

When enacted, the EU’sTaxonomy Regulation is intended to be a tool to guide future energy investments by providing investors with information on which activities and technologies contribute to the EU’s sustainability goals.  In their March 2020 final recommendations, the technical expert group (TEG) currently advising the EC on sustainable energy finance did not include nuclear power as a low-carbon and sustainable electricity source.

You can download the SNETP letter and see the logos of the many endorsing organizations here:  http://www.snetp.eu/wp-content/uploads/2020/04/NGO-Civil-society-on-Taxonomy-2020.pdf

Clearly, the battle lines have formed, with the anti-nuclear elements of the EU bureaucracy on one side and organizations like Foratom and SNETP on the other.  Against the behemoth EU bureaucracy, my best wishes go out to the underdogs, Foratom, SNETP, and other organizations and individuals that understand how nuclear power can play important roles in helping the EU achieve climate neutrality by 2050.

For more information:

NOAA’s Monthly Climate Summaries are Worth Your Attention

Peter Lobner

The National Oceanic and Atmospheric Administration’s (NOAA’s) National Centers for Environmental Information (NCEI) are responsible for “preserving, monitoring, assessing, and providing public access to the Nation’s treasure of climate and historical weather data and information.”  The main NOAA / NCEI website is here:

https://www.ncdc.noaa.gov

The “State of the Climate” is a collection of monthly summaries recapping climate-related occurrences on both a global and national scale.  Your starting point for accessing this collection is here:

https://www.ncdc.noaa.gov/sotc/

The following monthly summaries are available.

I’d like to direct your attention to two particularly impressive monthly summaries:

  • Global Summary Information, which provides a comprehensive top-level view, including the Sea Ice Index
  • Global Climate Report, which provides more information on temperature and precipitation, but excludes the Sea Ice Index information

Here are some of the graphics from the Global Climate Report for June 2019.

Source: NOAA NCEI
Source: NOAA NCEI

NOAA offered the following synopsis of the global climate for June 2019.

  • The month of June was characterized by warmer-than-average temperatures across much of the world. The most notable warm June 2019 temperature departures from average were observed across central and eastern Europe, northern Russia, northeastern Canada, and southern parts of South America.
  • Averaged as a whole, the June 2019 global land and ocean temperature departure from average was the highest for June since global records began in 1880.
  • Nine of the 10 warmest Junes have occurred since 2010.

For more details, see the online June 2019 Global Climate Reportat the following link:

https://www.ncdc.noaa.gov/sotc/global/201906

A complementary NOAA climate data resource is the National Snow & Ice Data Center’s (NSIDC’s) Sea Ice Index, which provides monthly and daily quick looks at Arctic-wide and Antarctic-wide changes in sea ice. It is a source for consistently processed ice extent and concentration images and data values since 1979. Maps show sea ice extent with an outline of the 30-year (1981-2010) median extent for the corresponding month or day. Other maps show sea ice concentration and anomalies and trends in concentration.  In addition, there are several tools you can use on this website to animate a series of monthly images or to compare anomalies or trends.  You’ll find the Sea Ice Index here:

https://nsidc.org/data/seaice_index/

The Arctic sea ice extent for June 2019 and the latest daily results for 23 July 2019 are shown in the following graphics, which show the rapid shrinkage of the ice pack during the Arctic summer.  NOAA reported that the June 2019 Arctic sea ice extent was 10.5% below the 30-year (1981 – 2010) average.  This is the second smallest June Arctic sea ice extent since satellite records began in 1979.

Source:  NOAA NSIDC
Source:  NOAA NSIDC

The monthly Antarctic results for June 2019 and the latest daily results for 23 July 2019 are shown in the following graphics, which show the growth of the Antarctic ice pack during the southern winter season. NOAA reported that the June 2019 Antarctic sea ice extent was 8.5% below the 30-year (1981 – 2010) average.  This is the smallest June Antarctic sea ice extent on record.

Source:  NOAA NSIDC
Source:  NOAA NSIDC

I hope you enjoy exploring NOAA’s “State of the Climate” collection of monthly summaries.

Declassified Military Satellite Imagery has Applications in a Wide Variety of Civilian Geospatial Studies

Peter Lobner, updated 26 October 2023

1. Overview of US military optical reconnaissance satellite programs

The National Reconnaissance Office (NRO) is responsible for developing and operating space reconnaissance systems and conducting intelligence-related activities for US national security.  NRO developed several generations of classified Keyhole (KH) military optical reconnaissance satellites that have been the primary sources of Earth imagery for the US Department of Defense (DoD) and intelligence agencies.  NRO’s website is here:

https://www.nro.gov

NRO’s early generations of Keyhole satellites were placed in low Earth orbits, acquired the desired photographic images on film during relatively short-duration missions, and then returned the film to Earth in small reentry capsules for airborne recovery. After recovery, the film was processed and analyzed.  The first US military optical reconnaissance satellite program, code named CORONA, pioneered the development and refinement of the technologies, equipment and systems needed to deploy an operational orbital optical reconnaissance capability. The first successful CORONA film recovery occurred on 19 August 1960.

Specially modified US Air Force C-119J aircraft recovers a
CORONA film canister in flight.  Source: US Air Force
First reconnaissance picture taken in orbit and successfully recovered on Earth;  taken on 18 August 1960 by a CORONA KH-1 satellite dubbed Discoverer 14.  Image shows the Mys Shmidta airfield in the Chukotka region of the Russian Arctic, with a resolution of about 40 feet (12.2 meters).  Source: Wikipedia

Keyhole satellites are identified by a code word and a “KH” designator, as summarized in the following table.

In 1976, NRO deployed its first electronic imaging optical reconnaissance satellite known as KENNEN KH-11 (renamed CRYSTAL in 1982), which eventually replaced the KH-9, and brought an end to reconnaissance satellite missions requiring film return.  The KH-11 flies long-duration missions and returns its digital images in near real time to ground stations for processing and analysis.  The KH-11, or an advanced version sometimes referred to as the KH-12, is operational today.

US film-return reconnaissance satellites from KH-1 to KH-9 shown to scale
with the KH-11 electronic imaging reconaissance satellite.  
Credit: Giuseppe De Chiara and The Space Review.

Geospatial intelligence, or GEOINT, is the exploitation and analysis of imagery and geospatial information to describe, assess and visually depict physical features and geographically referenced activities on the Earth. GEOINT consists of imagery, imagery intelligence and geospatial information.  Satellite imagery from Keyhole reconnaissance satellites is an important information source for national security-related GEOINT activities.

The National Geospatial-Intelligence Agency (NGA), which was formed in 2003, has the primary mission of collecting, analyzing, and distributing GEOINT in support of national security.  NGA’s predecessor agencies, with comparable missions, were:

  • National Imagery and Mapping Agency (NIMA), 1996 – 2003
  • National Photographic Interpretation Center (NPIC), a joint project of the Central Intelligence Agency (CIA) and DoD, 1961 – 1996

The NGA’s web homepage, at the following link: https://www.nga.mil/Pages/Default.aspx

The NGA’s webpage for declassified satellite imagery is here: https://www.nga.mil/ProductsServices/Pages/Imagery.aspx

2. The advent of the US civilian Earth observation programs

Collecting Earth imagery from orbit became an operational US military capability more than a decade before the start of the joint National Aeronautics & Space Administration (NASA) / US Geological Survey (USGS) civilian Landsat Earth observation program.  The first Landsat satellite was launched on 23 July 1972 with two electronic observing systems, both of which had a spatial resolution of about 80 meters (262 feet). 

Since 1972, Landsat satellites have continuously acquired low-to-moderate resolution digital images of the Earth’s land surface, providing long-term data about the status of natural resources and the environment. Resolution of the current generation multi-spectral scanner on Landsat 9 is 30 meters (98 feet) in visible light bands. 

You’ll find more information on the Landsat program on the USGS website here: https://www.usgs.gov/land-resources/nli/landsat

3. Declassification of certain military reconnaissance satellite imagery

All military reconnaissance satellite imagery was highly classified until 1995, when some imagery from early defense reconnaissance satellite programs was declassified.  The USGS explains:

“The images were originally used for reconnaissance and to produce maps for U.S. intelligence agencies. In 1992, an Environmental Task Force evaluated the application of early satellite data for environmental studies. Since the CORONA, ARGON, and LANYARD data were no longer critical to national security and could be of historical value for global change research, the images were declassified by Executive Order 12951 in 1995”

You can read Executive Order 12951 here: https://www.govinfo.gov/content/pkg/WCPD-1995-02-27/pdf/WCPD-1995-02-27-Pg304.pdf

Additional sets of military reconnaissance satellite imagery were declassified in 2002 and 2011 based on extensions of Executive Order 12951.

The declassified imagery is held by the following two organizations:

  • The original film is held by the National Archives and Records Administration (NARA).
  • Duplicate film held in the USGS Earth Resources Observation and Science (EROS) Center archive is used to produce digital copies of the imagery for distribution to users.

The declassified military satellite imagery available in the EROS archive is summarized below:

USGS EROS Archive – Declassified Satellite Imagery – 1 (1960 to 1972)

  • This set of photos, declassified in 1995, consists of more than 860,000 images of the Earth’s surface from the CORONA, ARGON, and LANYARD satellite systems.
  • CORONA image resolution improved from 40 feet (12.2 meters) for the KH-1 to about 6 feet (1.8 meters) for the KH-4B.
  • KH-5 ARGON image resolution was about 460 feet (140 meters).
  • KH-6 LANYARD  image resolution was about 6 feet (1.8 meters).

USGS EROS Archive – Declassified Satellite Imagery – 2 (1963 to 1980)

  • This set of photos, declassified in 2002, consists of photographs from the KH-7 GAMBIT surveillance system and KH-9 HEXAGON mapping program.
  • KH-7 image resolution is 2 to 4 feet (0.6 to 1.2 meters).  About 18,000 black-and-white images and 230 color images are available.
  • The KH-9 mapping camera was designed to support mapping requirements and exact positioning of geographical points. Not all KH-9 satellite missions included a mapping camera.  Image resolution is 20 to 30 feet (6 to 9 meters); significantly better than the 98 feet (30 meter) resolution of LANDSAT imagery.  About 29,000 mapping images are available.

USGS EROS Archive – Declassified Satellite Imagery – 3 (1971 to 1984)

  • This set of photos, declassified in 2011, consists of more photographs from the KH-9 HEXAGON mapping program.  Image resolution is 20 to 30 feet (6 to 9 meters).

More information on the declassified imagery resources is available from the USGS EROS Archive – Products Overview webpage at the following link (see heading “Declassified Data”): https://www.usgs.gov/centers/eros/science/usgs-eros-archive-products-overview?qt-science_center_objects=0#qt-science_center_objects

4.  Example applications of declassified military reconnaissance satellite imagery

The declassified military reconnaissance satellite imagery provides views of the Earth starting in the early 1960s, more than a decade before civilian Earth observation satellites became operational.  The military reconnaissance satellite imagery, except from ARGON KH-5, is higher resolution than is available today from Landsat civilian earth observation satellites. The declassified imagery is an important supplement to other Earth imagery sources.  Several examples applications of the declassified imagery are described below.

4.1 Assessing Aral Sea depletion

USGS reports: “The Aral Sea once covered about 68,000 square kilometers, a little bigger than the U.S. state of West Virginia. It was the 4th largest lake in the world. It is now only about 10% of the size it was in 1960…..In the 1990s, a dam was built to prevent North Aral water from flowing into the South Aral. It was rebuilt in 2005 and named the Kok-Aral Dam…..The North Aral has stabilized but the South Aral has continued to shrink and become saltier. Up until the 1960s, Aral Sea salinity was around 10 grams per liter, less than one-third the salinity of the ocean. The salinity level now exceeds 100 grams per liter in the South Aral, which is about three times saltier than the ocean.”

On the USGS website, the “Earthshots: Satellite Images of Environmental Change” webpages show the visible changes at many locations on Earth over a 50+ year time period.  The table of contents to the Earthshots webpages is shown below and is at the following link: http:// https://earthshots.usgs.gov/earthshots/

USGS Earthshots Table of Contents

For the Aral Sea region, the Earthshots photo sequences start with ARGON KH-5 photos taken in 1964.  Below are three screenshots  of the USGS Earthshots pages showing the KH-5 images for the whole the Aral Sea, the North Aral Sea region and the South Aral Sea region. You can explore the Aral Sea Earthshots photo sequences at the following link: https://earthshots.usgs.gov/earthshots/node/91#ad-image-0-0

4.2 Assessing Antarctic ice shelf condition

In a 7 June 2016 article entitled, ”Spy satellites reveal early start to Antarctic ice shelf collapse,” Thomas Sumner reported:

“Analyzing declassified images from spy satellites, researchers discovered that the downhill flow of ice on Antarctica’s Larsen B ice shelf was already accelerating as early as the 1960s and ’70s. By the late 1980s, the average ice velocity at the front of the shelf was around 20 percent faster than in the preceding decades,….”

You can read the complete article on the ScienceNews website here: https://www.sciencenews.org/article/spy-satellites-reveal-early-start-antarctic-ice-shelf-collapse

Satellite images taken by the ARGON KH-5 satellite have revealed how the accelerated movement that triggered the collapse of the Larsen B ice shelf on the east side of the Antarctic Peninsula began in the 1960s. The declassified images taken by the satellite on 29 August 1963 and 1 September 1963 are pictured right.  
Source: Daily Mail, 10 June 2016

4.3 Assessing Himalayan glacier condition

In a 19 June 2019 paper “Acceleration of ice loss across the Himalayas over the past 40 years,” the authors, reported on the use of HEXAGON KH-9 mapping camera imagery to improve their understanding of trends affecting the Himalayan glaciers from 1975 to 2016:

“Himalayan glaciers supply meltwater to densely populated catchments in South Asia, and regional observations of glacier change over multiple decades are needed to understand climate drivers and assess resulting impacts on glacier-fed rivers. Here, we quantify changes in ice thickness during the intervals 1975–2000 and 2000–2016 across the Himalayas, using a set of digital elevation models derived from cold war–era spy satellite film and modern stereo satellite imagery.”

“The majority of the KH-9 images here were acquired within a 3-year interval (1973–1976), and we processed a total of 42 images to provide sufficient spatial coverage.”

“We observe consistent ice loss along the entire 2000-km transect for both intervals and find a doubling of the average loss rate during 2000–2016.”

“Our compilation includes glaciers comprising approximately 34% of the total glacierized area in the region, which represents roughly 55% of the total ice volume based on recent ice thickness estimates.”

You can read the complete paper by J. M. Maurer, et al., on the Science Advances website here: https://advances.sciencemag.org/content/5/6/eaav7266

3-D image of the Himalayas derived from HEXAGON KH-9 satellite mapping photographs taken on December 20, 1975. Source:  J. M. Maurer/LDEO

4.4 Discovering archaeological sites

A. CORONA Atlas Project

The Center for Advanced Spatial Technologies, a University of Arkansas / U.S. Geological Survey collaboration, has undertaken the CORONA Atlas Project using military reconnaissance satellite imagery to create the “CORONA Atlas & Referencing System”. The current Atlas focuses on the Middle East and a small area of Peru, and is derived from 1,024 CORONA images taken on 50 missions. The Atlas contains 833 archaeological sites.

“In regions like the Middle East, CORONA imagery is particularly important for archaeology because urban development, agricultural intensification, and reservoir construction over the past several decades have obscured or destroyed countless archaeological sites and other ancient features such as roads and canals. These sites are often clearly visible on CORONA imagery, enabling researchers to map sites that have been lost and to discover many that have never before been documented. However, the unique imaging geometry of the CORONA satellite cameras, which produced long, narrow film strips, makes correcting spatial distortions in the images very challenging and has therefore limited their use by researchers.”

Screenshot of the CORONA Atlas showing regions in the Middle East
with data available.

CAST reports that they have “developed methods for efficient 

orthorectification of CORONA imagery and now provides free public access to our imagery database for non-commercial use. Images can be viewed online and full resolution images can be downloaded in NITF format.”  

The can explore the CORONA Atlas & Referencing System here: https://corona.cast.uark.edu

B. Dartmouth “Fertile Crescent” Study

In October 2023, a team from Dartmouth College published a paper that described their recent discovery of 396 Roman-era forts using declassified CORONA and HEXAGON spy satellite imagery of regions of Syria, Iraq and nearby “fertile crescent” territories of the eastern Mediterranean. The study area is shown in the following map. A previous aerial survey of the area in 1934 had identified 116 other forts in the same region.

Dartmouth study area. Source: J. Casana, et al. (26 October 2023)

The authors noted, “Perhaps the most significant realization from our work concerns the spatial distribution of the forts across the landscape, as this has major implications for our understanding of their intended purpose as well as for the administration of the eastern Roman frontier more generally.”

Comparison of the distribution of forts documented in the 1934 aerial survey (top)and forts found recently on declassified satellite imagery (bottom). Source: Figure 9, J. Casana, et al. (26 October 2023)

Examples of the new forts identified by the Dartmouth team in satellite imagery are shown in the following figures.

CORONA images showing three major sites: (A) Sura (NASA1401); (B) Resafa (NASA1398); and (C) Ain Sinu (CRN999). Source: Figure 3, J. Casana, et al. (26 October 2023)

Castellum at Tell Brak site in multiple images: (A) CORONA (1102, 17 December 1967); (B) CORONA (1105, 4 November 1968); (C) HEXAGON (1204, 17 November 1974); and (D) modern satellite imagery. Source: Figure 4, J. Casana, et al. (26 October 2023)

The teams paper concludes: “Finally, the discovery of such a large number of previously undocumented ancient forts in this well-studied region of the Near East is a testament to the power of remote-sensing technologies as transformative tools in contemporary archaeological research.”

4.5 Conducting commercial geospatial analytics over a broader period of time

The firm Orbital Insight, founded in 2013, is an example of commercial firms that are mining geospatial data and developing valuable information products for a wide range of customers. Orbital Insight reports:

“Orbital Insight turns millions of images into a big-picture understanding of Earth. Not only does this create unprecedented transparency, but it also empowers business and policy decision makers with new insights and unbiased knowledge of socio-economic trends. As the number of Earth-observing devices grows and their data output expands, Orbital Insight’s geospatial analytics platform finds observational truth in an interconnected world. We map out and quantify the world’s complexities so that organizations can make more informed decisions.”

“By applying artificial intelligence to satellite, UAV, and other geospatial data sources, we seek to discover and quantify societal and economic trends on Earth that are indistinguishable to the human eye. Combining this information with terrestrial data, such as mobile and location-based data, unlocks new sources of intelligence.”

The Orbital Insight website is here: https://orbitalinsight.com/company/

5. Additional reading related to US optical reconnaissance satellites

You’ll find more information on the NRO’s film-return, optical reconnaissance satellites (KH-1 to KH-9) at the following links:

  • Robert Perry, “A History of Satellite Reconnaissance,” Volumes I to V, National Reconnaissance Office (NRO), various dates 1973 – 1974; released under FOIA and available for download on the NASA Spaceflight.com website, here: https://forum.nasaspaceflight.com/index.php?topic=20232.0

You’ll find details on NRO’s electronic optical reconnaissance satellites (KH-11, KH-12) at the following links:

6. Additional reading related to civilian use of declassified spy satellite imagery

General:

Assessing Aral Sea depletion:

Assessing Antarctic ice sheet condition:

Assessing Himalayan glacier condition:

Discovering archaeological sites:

Converting Carbon Dioxide into Useful Products

Peter Lobner

In my 19 December 2016 post, “What to do with Carbon Dioxide,” I provided an overview of the following three technologies being developed for underground storage (sequestration) or industrial utilization of carbon dioxide:

  • Store in basalt formations by making carbonate rock
  • Store in fractures in deep crystalline rock
  • Make ethanol

You can read this post here:

https://lynceans.org/all-posts/what-to-do-with-carbon-dioxide/

In the past two years, significant progress has been made in the development of processes to convert gaseous carbon dioxide waste streams into useful products.   This post is intended to highlight some of the advances being made and provide links to additional current sources of information on this subject.

1. Carbon XPrize:  Transforming carbon dioxide into valuable products

The NRG / Cosia XPrize is a $20 million global competition to develop breakthrough technologies that will convert carbon dioxide emissions from large point sources like power plants and industrial facilities into valuable products such as building materials, alternative fuels and other items used every day.  You’ll find details on this competition on the XPrize website at the following link:

https://www.xprize.org/prizes/carbon

As shown in the following timeline from the above website, this competition started in September 2015.

Carbon XPrize schedule

In April 2018, the following ten international teams were selected as finalists:

  • Four teams from Canada:  Carbicrete, Carbon Upcycling Technologies, CarbonCure and CERT
  • Three teams from USA:  C2CNT, Carbon Upcycling UCLA and Newlight
  • One team from UK:  Carbon Capture Machine
  • One team from India:  Breathe
  • One team from China:  C4X

The processes being developed by these teams will produce a range of valuable products:

You can read more about each of the competing teams and their intended products in the XPrize finalist selection report here:

https://assets-us-01.kc-usercontent.com/5cb25086-82d2-4c89-94f0-8450813a0fd3/ec5aba69-e68b-48c8-99b0-151e21749d67/XPRIZE%20Carbon%20Finalist%20Team%20Deck.pdf

The competition is now in the testing and certification phase.  Each team is expected to scale up their pilot systems by a factor of 10 for the operational phase, which starts in June 2019 at the Wyoming Integrated Test Center and the Alberta (Canada) Carbon Conversion Technology Center.  

The teams will be judged by the amount of carbon dioxide converted into usable products and the value of those products.  We’ll have to wait until the spring of 2020 for the results of this competition.

2. World’s largest post-combustion carbon capture project

Post-combustion carbon capture refers to capturing carbon dioxide from flue gas after a fossil fuel (e.g., coal, natural gas or oil) has been burned and before the flue gas is exhausted to the atmosphere.  You’ll find a 2016 review of post-combustion carbon capture technologies in the paper by Y. Wang, et al., “A Review of Post-combustion Carbon Dioxide  Capture Technologies from Coal-fired Power Plants,” which is available on the ScienceDirect website here:

https://reader.elsevier.com/reader/sd/pii/S1876610217313851?token=477195C9DBC9D5A1FCDBD7EB6CF04B595E1E377350690F4D2EC6E3D945DA570279962F3A75EE2B281A209A2F52B42A81

In January 2017, NRG Energy reported the completion of the Petra Nova post-combustion carbon capture project, which is designed to remove 90% of the carbon dioxide from a 240 MW “slipstream” of flue gas at the existing W. A. Parish generating plant Unit 8.  The “slipstream” represents 40% of the total flue gas flow from the coal-fired 610 MW Unit 8.  To date, this is the largest post-combustion carbon capture project in the world.  Approximately 1.4 million metric tons of carbon dioxide will be captured annually using a process jointly developed by Mitsubishi Heavy Industries, Ltd. (MHI) and the Kansai Electric Power Co.  The US Department of Energy (DOE) supported this project with a $190 million grant.

The DOE reported: “The project will utilize a proven carbon capture process, which uses a high-performance solvent for carbon dioxide absorption and desorption. The captured carbon dioxide will be compressed and transported through an 80 mile pipeline to an operating oil field where it will be utilized for enhanced oil recovery (EOR) and ultimately sequestered (in the ground).”

Process flow diagram for Petra Nova carbon dioxide capture and processing.  
Source: National Energy Technology Laboratory
The Petra Nova site.  Source: Petra Nova, a joint venture between NRG Energy and JX Nippon Oil & Gas Exploration
The Petra Nova large-scale carbon dioxide scrubber.  
Source: Business Wire

You’ll find more information on the Petra Nova project at the following links:

3. Pilot-scale projects to convert carbon dioxide to synthetic fuel

Thyssenkrupp pilot project for conversion of steel mill gases into methanol

In September 2018, Thyssenkrupp reported that it had “commenced production of the synthetic fuel methanol from steel mill gases. It is the first time anywhere in the world that gases from steel production – including the carbon dioxide they contain – are being converted into chemicals. The start-up was part of the Carbon2Chem project, which is being funded to the tune of around 60 million euros by Germany’s Federal Ministry of Education and Research (BMBF)……..‘Today the Carbon2Chem concept is proving its value in practice,’ said Guido Kerkhoff, CEO of Thyssenkrupp. ‘Our vision of virtually carbon dioxide-free steel production is taking shape.’”

You can read the Thyssenkrupp press release here:

https://www.thyssenkrupp.com/en/newsroom/press-releases/press-release-141984.html

Berkeley Laboratory developing a copper catalyst that yields high efficiency carbon dioxide-to-fuels conversion

The DOE Lawrence Berkeley National Laboratory (Berkeley Lab) has been engaged for many years in creating clean chemical manufacturing processes that can put carbon dioxide to good use.  In September 2017, Berkeley Lab announced that its scientists has developed a new electrocatalyst comprised of copper nanoparticles that can directly convert carbon dioxide into multi-carbon fuels and alcohols (e.g., ethylene, ethanol, and propanol) using record-low inputs of energy.  For more information, see the Global Energy World article here:

http://www.globalenergyworld.com/news/30336/copper_catalyst_yields_high_efficiency_co2-to-fuels_conversion.htm

4. Pilot-scale “Negative Emissions Technology” plants

The term negative emissions technology (NET) refers to an industrial processes designed to remove and sequester carbon dioxide directly from the ambient atmosphere rather than from a large point source of carbon dioxide generation (e.g. the flue gas from a fossil-fueled power generating station or a steel mill).  Think of a NET facility as a carbon dioxide removal “factory” that can be sited independently from the sources of carbon dioxide generation.

The Swiss firm Climeworks is in the business of developing carbon dioxide removal factories using the following process:

“Our plants capture atmospheric carbon with a filter. Air is drawn into the plant and the carbon dioxide within the air is chemically bound to the filter.  Once the filter is saturated with carbon dioxide it is heated (using mainly low-grade heat as an energy source) to around 100 °C (212 °F). The carbon dioxide is then released from the filter and collected as concentrated carbon dioxide gas to supply to customers or for negative emissions technologies.  Carbon dioxide-free air is released back into the atmosphere. This continuous cycle is then ready to start again. The filter is reused many times and lasts for several thousand cycles.”

This process is shown in the following Climeworks diagram:

Source: Climeworks

You’ll find more information on Climeworks on their website here:

http://www.climeworks.com

Climeworks NET in Iceland

In 2017, Climeworks began operation in Iceland of their first pilot facility to remove carbon dioxide from ambient air and produce concentrated carbon dioxide that is injected into underground basaltic rock formations, where the carbon dioxide gets converted into carbonite minerals in a relatively short period of time (1 – 2 years) and remains fixed in the rock.  Climeworks uses waste heat from a nearby geothermal generating plant to help run their carbon capture system.  This process is shown in the following diagram.

Source: Climeworks

This small-scale pilot facility is capable of removing only about 50 tons of carbon dioxide from the atmosphere per year, but can be scaled up to a much larger facility.  You’ll find more information on this Climeworks project here:

https://www.popularmechanics.com/science/green-tech/news/a28629/first-negative-emissions-plant/

Climeworks NET in Italy

In October 2018, Climeworks began operation in Italy of another pilot-scale NET facility designed to remove carbon dioxide from the atmosphere.  This facility is designed to remove 150 tons of carbon dioxide from the atmosphere per year and produce a natural gas product stream from the atmospheric carbon dioxide, water, and electricity.  You’ll find more information on this Climeworks project here:

https://www.popularmechanics.com/science/green-tech/a23621438/climeworks-co2-methane-facility/

5. Consensus reports on waste stream utilization and negative emissions technologies (NETs)

The National Academies Press (NAP) recently published a consensus study report entitled, “Gaseous Carbon Waste Streams Utilization, Status and Research Needs,”  which examines the following processes:

  • Mineral carbonation to produce construction material
  • Chemical conversion of carbon dioxide into commodity chemicals and fuels
  • Biological conversion (photosynthetic & non-photosynthetic) of carbon dioxide into commodity chemicals and fuels
  • Methane and biogas waste utilization

The authors note that, “previous assessments have concluded that …… > 10 percent of the current global anthropogenic carbon dioxide emissions….could feasibly be utilized within the next several decades if certain technological advancements are achieved and if economic and political drivers are in place.”

Source: National Academies Press

You can download a free pdf copy of this report here:

https://www.nap.edu/catalog/25232/gaseous-carbon-waste-streams-utilization-status-and-research-needs

Also on the NAP website is a prepublication report entitled, “Negative Emissions Technologies and Reliable Sequestration.” The authors note that NETs “can have the same impact on the atmosphere and climate as preventing an equal amount of carbon dioxide from being emitted from a point source.”

Source: National Academies Press

You can download a free pdf copy of this report here:

https://www.nap.edu/catalog/25259/negative-emissions-technologies-and-reliable-sequestration-a-research-agenda

In this report, the authors note that recent analyses found that deploying NETs may be less expensive and less disruptive than reducing some emissions at the source, such as a substantial portion of agricultural and land-use emissions and some transportation emissions. “ For example, NAPs could be a means for mitigating the methane generated from enteric fermentation in the digestive systems of very large numbers of ruminant animals (e.g., in the U.S., primarily beef and dairy cattle).  For more information on this particular matter, please refer to my 31 December 2016 post, “Cow Farts Could be Subject to Regulation Under a New California Law,” which you’ll find here:

https://lynceans.org/all-posts/cow-farts-could-be-subject-to-regulation-under-a-new-california-law/

Human Activities are Contributing to Global Carbon Dioxide Levels, but Possibly not in the Way You Think They Are

Peter Lobner

The Human Development Index (HDI), which is a measure of the quality of life, was developed in 1990 by the United Nations to enable cross-national comparisons of the state of human development. You can read about the HDI and download the UN’s annual Human Development Reports at the following link:

http://hdr.undp.org

As you might imagine, there are large HDI differences among the world’s many nations. In its 2016 Human Development Report, the following nations were at the top and bottom of the HDI international ranking:

  • The top five places in the global HDI rankings are: Norway (0.949), Australia (0.939), Switzerland (0.939), Germany (0.926) with Denmark and Singapore (0.925) sharing the 5th spot.
  • The bottom five countries in rank order of HDI are: Burundi (0.404), Burkina Faso (0.402), Chad (0.396), Niger (0.353) and Central African Republic (0.352).

The UN reported that the regional HDI trends from 1990 to 2015 are up in all regions of the world, as shown in the following figure.

The U.S. Department of Energy (DOE) developed a general correlation between HDI and the annual per capita energy consumption in each nation, as shown in the following figure. Note that annual per capita energy consumption is not a factor in the UN’s determination of HDI.

Source: DOE “Nuclear Energy Research & Development Roadmap – Report to Congress”,     April 2010

DOE reports:

“Figure 3 illustrates that a nation’s standard of living depends in part on energy consumption. Access to adequate energy is now and will continue to be required to achieve a high quality of life.”

Based on the 25-year HDI trends reported by the UN (Figure 1.1, above), nations generally have been moving up the HDI scale. Based on the DOE correlation (Figure 3, above), many of these nations, especially the least-developed nations, also should be moving up the scale for per capita energy consumption (to the right in the chart above) as their HDI increases. The net result should be a worldwide trend toward higher median per capita energy consumption. While conservation efforts may help reduce the per capita energy consumption in highly developed nations, there is a large fraction of the world’s population living in less developed nations. In these countries the per capita energy consumption will grow significantly as the local economies develop and the local populations demand basic goods and services that are commonplace in more developed nations.

In his commentary on global warming, Nobel laureate Dr. Ivar Giaever takes issue with CO2 being the cause of global warming by noting that the key “evidence” is a claimed global average temperature increase of 0.8 degrees (288 to 288.8 K) between 1880 and 2013 and a supposed correlation of this temperature increase with the increase of CO2 in the atmosphere. Dr. Giaever takes the position that measuring a worldwide average temperature trend is a difficult task, particularly with the modest number of measurement points available more than a hundred years ago, the consistency of measurement over the period of interest, and the still-modest number of measurement points in many parts of the world today. In addition, he notes that a 0.8 degree K change in worldwide average temperature over a period of 133 years seems to be a very high level of consistency rather than an alarming trend. During that same period, Dr. Giaever noted that world population increased from 1.5 to 7 billion and many human activities contributed to environmental change, yet the impacts of all these additional people are rarely mentioned in the climate change debate. You can watch one of Dr. Giaever lectures at the following link:

https://www.youtube.com/watch?v=SXxHfb66ZgM

What is the impact of having 5.5 billion more people in the world today (and their many ancestors for the past 133 years) on global CO2 emissions? That’s hard to determine, but a simpler starting point is to assess the impact of one additional person.

That matter was addressed in a 2017 article by Seth Wynes and Kimberly Nicholas entitled, “The climate mitigation gap: education and government recommendations miss the most effective individual actions,” which was published in Environmental Research Letters. The authors developed a ranking for a wide variety of human activities relative to their contribution to CO2 emission reduction measured in tonnes (metric tons, 2205 pounds) of CO2-equivalent per year. I can tell you that the results are surprising.

A synopsis of these results is published in The Guardian using the following simple graphic.

The study authors, Wynes and Nicholas, concluded:

“We recommend four widely applicable high-impact (i.e. low emissions) actions with the potential to contribute to systemic change and substantially reduce annual personal emissions: having one fewer child (an average for developed countries of 58.6 tonnes CO2-equivalent (tCO2e) emission reductions per year), living car-free (2.4 tCO2e saved per year), avoiding airplane travel (1.6 tCO2e saved per roundtrip transatlantic flight) and eating a plant-based diet (0.8 tCO2e saved per year). These actions have much greater potential to reduce emissions than commonly promoted strategies like comprehensive recycling (four times less effective than a plant-based diet) or changing household lightbulbs (eight times less).”

Surprise!! Population growth adds CO2 to the atmosphere and the biggest impact a person can have on their own carbon footprint is to not have an additional child.

The authors noted that average savings of 58.6 tCO2e per year for having one fewer child applies to developed countries, where we expect per-capita energy consumption to be high. In less developed nations, where we expect lower per-capita energy consumption, the average savings for having one fewer child will be smaller. However, as their HDI continues to increase, the per-capita energy consumption in less developed nations eventually will rise and may approach the values occurring now in medium- or high-developed countries.

You can read the synopsis of the Wynes and Nicholas analysis in The Guardian here:

https://www.theguardian.com/environment/2017/jul/12/want-to-fight-climate-change-have-fewer-children

You can read the full paper in Environmental Research Letters here:

http://iopscience.iop.org/article/10.1088/1748-9326/aa7541

The mathematical approach for estimating the CO2-equivalent per year of an additional child is based on a 2009 paper by Paul A. Murtaugh and Michael G. Schlax entitled, “Reproduction and the carbon legacies of individuals,” and published in Global Environmental Change. The authors state:

“Here we estimate the extra emissions of fossil carbon dioxide that an average individual causes when he or she chooses to have children. The summed emissions of a person’s descendants, weighted by their relatedness to him, may far exceed the lifetime emissions produced by the original parent.”

“It is important to remember that these analyses focus on the carbon legacies of individuals, not populations. For example, under the constant-emission scenario, an extra child born to a woman in the United States ultimately increases her carbon legacy by an amount (9441 metric tons) that is nearly seven times the analogous quantity for a woman in China (1384 tons), but, because of China’s enormous population size, its total carbon emissions (from its human population) currently exceed those of the United States.”

“…..ignoring the consequences of reproduction can lead to serious under-estimation of an individual’s long-term impact on the global environment.”

You can read this complete paper here:

https://www.biologicaldiversity.org/programs/population_and_sustainability/pdfs/OSUCarbonStudy.pdf

How’s your carbon legacy doing?

Significant Progress has Been Made in Implementing the Arctic Council’s Arctic Marine Strategic Plan (AMSP)

Peter Lobner

The Arctic Council describes itself as, “….the leading intergovernmental forum promoting cooperation, coordination and interaction among the Arctic States, Arctic indigenous communities and other Arctic inhabitants on common Arctic issues, in particular on issues of sustainable development and environmental protection in the Arctic.” The council consists of representatives from the eight Arctic states:

  • Canada,
  • Kingdom of Denmark (including Greenland and the Faroe Islands)
  • Finland
  • Iceland
  • Norway
  • Russia
  • Sweden
  • United States

In addition, six international organizations representing Arctic indigenous people have permanent participant status. You’ll find the Arctic Council’s website at the following link:

http://www.arctic-council.org/index.php/en/

One outcome of the Arctic Council’s 2004 Senior Arctic Officials (SAO) meeting in Reykjavik, Iceland was a call for the Council’s Protection of the Arctic Marine Environment (PAME) working group to conduct a comprehensive Arctic marine shipping assessment as outlined in the AMSP. The key result of that effort was The Arctic Marine Shipping Assessment 2009 Report (AMSA), which you can download here:

https://oaarchive.arctic-council.org/handle/11374/54

Source: Arctic Council

This report provided a total of 17 summary recommendations for Arctic states in the following three areas:

I. Enhancing Arctic marine safety

A. Coordinating with international organizations to harmonize a regulatory framework for Arctic maritime safety.

B. Supporting International Maritime Organization (IMO) standards for vessels operating in the Arctic.

C. Developing uniform practices for Arctic shipping governance, including in areas of the central Arctic ocean that are beyond the jurisdiction of any Arctic state.

D. Strengthening passenger ship safety in Arctic waters

E. Supporting development of a multi-national Arctic search and rescue capability.

II. Protecting Arctic people and the environment

A. Conducting surveys of Arctic marine use by indigenous people

B. Ensuring effective engagement with Arctic coastal communities

C. Identifying and protecting areas of heightened ecological and cultural significance.

D. Where appropriate, designating “Special Areas” or “Particularly Sensitive Areas”

E. Protecting against introduction of invasive species

F. Preventing oil spills

G. Determining impacts on marine animals and take mitigating actions

H. Reducing air emissions (CO2, NOx, SO2 and black carbon particles)

III. Building the Arctic marine infrastructure

A. Improving the Arctic infrastructure to support development while enhancing safety and protecting the Arctic people and environment, including icebreakers to assist in response.

B. Developing a comprehensive Arctic marine traffic awareness system and cooperate in development of national monitoring systems.

C. Developing a circumpolar environmental response capability.

D. Investing in hydrographic, meteorological and oceanographic data needed to support safe navigation and voyage planning.

The AMSA 2009 Report is a useful resource, with thorough descriptions and findings related to the following:

  • Arctic marine geography, climate and sea ice
  • History of Arctic marine transport
  • Governance of Arctic shipping
  • Current marine use and the AMSA shipping database
  • Scenarios, futures and regional futures to 2020 (Bering Strait, Canadian Arctic, Northern Sea Route)
  • Human dimensions (for a total Arctic population of about 4 M)
  • Environmental considerations and impacts
  • Arctic marine infrastructure

Four status reports from 2011 to 2017 documented the progress by Arctic states in implementing the 17 summary recommendations in AMSA 2009. The fourth and final progress report entitled, “Status of Implementation of the AMSA 2009 Report Recommendations; May 2017,” is available at the following link:

https://www.isemar.fr/wp-content/uploads/2017/09/Conseil-de-Arctic-rapport-Arctic-Marine-Shipping-Assessment-AMSA-mai-2017.pdf

Source: Arctic Council

Through PAME and other working groups, the Arctic Council will continue its important role in implementing the Arctic Marine Strategic Plan. You can download the current version of that plan, for the period from 2015 – 2025, here:

https://oaarchive.arctic-council.org/handle/11374/413

Source: Arctic Council

For example, on 6 November 2017, the Arctic Council will host a session entitled, “The global implications of a rapidly-changing Arctic,” at the UN Climate Change Conference COP23 meeting in Bonn, Germany. For more information on this event, use this link:

http://www.arctic-council.org/index.php/en/our-work2/8-news-and-events/473-cop23

Doomsday Clock Reset

Peter Lobner

This year is the 70th anniversary of the Doomsday Clock, which the Bulletin of the Atomic Scientists describes as follows:

“The Doomsday Clock is a design that warns the public about how close we are to destroying our world with dangerous technologies of our own making. It is a metaphor, a reminder of the perils we must address if we are to survive on the planet.”

You’ll find an overview on the Doomsday Clock here:

http://thebulletin.org/overview

The Clock was last changed in 2015 from five to three minutes to midnight. In January 2016, the Doomsday Clock’s minute hand did not change.

On 26 January 2017, the Bulletin of the Atomic Scientists Science and Security Board, in consultation with its Board of Sponsors, which includes 15 Nobel Laureates, decided to reset the Doomsday Clock to 2-1/2 minutes to midnight. This is the closest it has been to midnight in 64 years, since the early days of above ground nuclear device testing.

Two and a half minutes to midnight

The Science and Security Board warned:

“In 2017, we find the danger to be even greater (than in 2015 and 2016), the need for action more urgent. It is two and a half minutes to midnight, the Clock is ticking, global danger looms. Wise public officials should act immediately, guiding humanity away from the brink. If they do not, wise citizens must step forward and lead the way.”

You can read the Science and Security Board’s complete statement at the following link:

http://thebulletin.org/sites/default/files/Final%202017%20Clock%20Statement.pdf

Their rationale for resetting the clock is not based on a single issue, but rather, the aggregate effects of the following issues, as described in their statement:

A dangerous nuclear situation on multiple fronts

  • Stockpile modernization by current nuclear powers, particularly the U.S. and Russia, has the potential to grow rather than reduce worldwide nuclear arsenals
  • Stagnation in nuclear arms control
  • Continuing tensions between nuclear-armed India and Pakistan
  • North Korea’s continuing nuclear development
  • The Iran nuclear deal has been successful in accomplishing its goals in its first year, but its future is in doubt under the new U.S. administration
  • Careless rhetoric about nuclear weapons is destabilizing; for example, the U.S. administration’s suggestion that South Korea and Japan acquire their own nuclear weapons to counter North Korea

The clear need for climate action

  • The Paris Agreement went into effect in 2016
  • Continued warming of the world was measured in 2016
  • S. administration needs to make a clear, unequivocal statement that it accepts climate change, caused by human activity, as a scientific reality

Nuclear power: An option worth careful consideration

  • Nuclear power a tempting part of the solution to the climate change problem
  • The scale of new nuclear power plant construction does not match the need for clean energy
  • In the short to medium term, governments should discourage the premature closure of existing reactors that are safe and economically viable
  • In the longer term, deploy new types of reactors that can be built quickly and are at least as safe as the commercial nuclear plants now operating
  • Deal responsibly with safety issues and with the commercial nuclear waste problem

Potential threats from emerging technologies

  • Technology continues to outpace humanity’s capacity to control it
  • Cyber attacks can undermining belief in representative government and thereby endangering humanity as a whole
  • Autonomous machine systems open up a new set of risks that require thoughtful management
  • Advances in synthetic biology, including the Crispr gene-editing tool, have great positive potential, but also can be misused to create bioweapons and other dangerous manipulations of genetic material
  • Potentially existential threats posed by a host of rapidly emerging technologies need to be monitored, and to the extent possible anticipated and managed.

Reducing risk: Expert advice

  • The Board is extremely concerned about the willingness of governments around the world— including the incoming U.S. administration—to ignore or discount sound science and considered expertise during their decision-making processes

Prior to the formal decision on the 2017 setting of the Doomsday Clock, the Bulletin took a poll to determine public sentiment on what the setting should be. Here are the results of this public pole.

Results of The Bulletin Public Poll

How would you have voted?

Hey, EU!! Wood may be a Renewable Energy Source, but it isn’t a Clean Energy Source

Peter Lobner

EU policy background

The United Nations Framework Convention on Climate Change (The Paris Agreement) entered into force on 4 November 2016. To date, the Paris Agreement has been ratified by 122 of the 197 parties to the convention. This Agreement does not define renewable energy sources, and does not even use the words “renewable,” “biomass,” or “wood”. You can download this Agreement at the following link:

http://unfccc.int/paris_agreement/items/9485.php

The Renewable Energy Policy Network for the 21st Century (REN21), based in Paris, France, is described as, “a global renewable energy multi-stakeholder policy network that provides international leadership for the rapid transition to renewable energy.” Their recent report, “Renewables 2016 Global Status Report,” provides an up-to-date summary of the status of the renewable energy industry, including the biomass industry, which accounts for the use of wood as a renewable biomass fuel. The REN21 report notes:

“Ongoing debate about the sustainability of bioenergy, including indirect land-use change and carbon balance, also affected development of this sector. Given these challenges, national policy frameworks continue to have a large influence on deployment.”

You can download the 2016 REN21 report at the following link:

http://www.ren21.net/wp-content/uploads/2016/05/GSR_2016_Full_Report_lowres.pdf

For a revealing look at the European Union’s (EU) position on the use of biomass as an energy source, see the September 2015 European Parliament briefing, “Biomass for electricity and heating opportunities and challenges,” at the following link:

http://www.europarl.europa.eu/RegData/etudes/BRIE/2015/568329/EPRS_BRI(2015)568329_EN.pdf

Here you’ll see that burning biomass as an energy source in the EU is accorded similar carbon-neutral status to generating energy from wind, solar and hydro. The EU’s rationale is stated as follows:

“Under EU legislation, biomass is carbon neutral, based on the assumption that the carbon released when solid biomass is burned will be re-absorbed during tree growth. Current EU policies provide incentives to use biomass for power generation.”

This policy framework, which treats biomass as a carbon neutral energy source, is set by the EU’s 2009 Renewable Energy Directive (Directive 2009/28/EC), which requires that renewable energy sources account for 20% of the EU energy mix by 2020. You can download this directive at the following link:

http://eur-lex.europa.eu/legal-content/EN/TXT/?qid=1436259271952&uri=CELEX:02009L0028-20130701

The EU’s equation seems pretty simple: renewable = carbon neutral

EU policy assessment

In 2015, the organization Climate Central produced an assessment of this EU policy in a three-part document entitled, “Pulp Fiction – The European Accounting Error That’s Warming the Planet.” Their key points are summarized in the following quotes extracted from “Pulp Fiction”:

“Wood has quietly become the largest source of what counts as ‘renewable’ energy in the EU. Wood burning in Europe produced as much energy as burning 620 million barrels of oil last year (both in power plants and for home heating). That accounted for nearly half of all Europe’s renewable energy. That’s helping nations meet the requirements of EU climate laws on paper, if not in spirit.”

Pulp Fiction chart

“The wood pellet mills are paying for trees to be cut down — trees that could be used by other industries, or left to grow and absorb carbon dioxide. And the mills are being bankrolled by climate subsidies in Europe, where wood pellets are replacing coal at a growing number of power plants.”

”That loophole treats electricity generated by burning wood as a ‘carbon neutral’ or ‘zero emissions’ energy source — the same as solar panels or wind turbines. When power plants in major European countries burn wood, the only carbon dioxide pollution they report is from the burning of fossil fuels needed to manufacture and transport the woody fuel. European law assumes climate pollution released directly by burning fuel made from trees doesn’t matter, because it will be re-absorbed by trees that grow to replace them.”

“Burning wood pellets to produce a megawatt-hour of electricity produces 15 to 20 percent more climate-changing carbon dioxide pollution than burning coal, analysis of Drax (a UK power plant) data shows. And that’s just the CO2 pouring out of the smokestack. Add in pollution from the fuel needed to grind, heat and dry the wood, plus transportation of the pellets, and the climate impacts are even worse. According to Enviva (a fuel pellet manufacturer), that adds another 20 percent worth of climate pollution for that one megawatt-hour.”

“No other country or U.S. region produces more wood and pulp every year than the Southeast, where loggers are cutting down roughly twice as many trees as they were in the 1950s.”

“But as this five-month Climate Central investigation reveals, renewable energy doesn’t necessarily mean clean energy. Burning trees as fuel in power plants is heating the atmosphere more quickly than coal.”

You can access the first part of “Pulp Fiction” at the following link and then easily navigate to the other two parts.

http://reports.climatecentral.org/pulp-fiction/1/

In the U.S., the Natural Resources Defense Council (NRDC) has made a similar finding. Check out the NRDC’s May 2015 Issue Brief, “Think Wood Pellets are Green? Think Again,” at the following link:

https://www.nrdc.org/sites/default/files/bioenergy-modelling-IB.pdf

NRDC examined three cases of cumulative emissions from fuel pellets made from 70%, 40% and 20% whole trees. The NRDC chart for the 70% whole tree case is shown below.

NRDC cumulative emissions from wood pellets

You can see that the NRDC analysis indicates that cumulative emissions from burning wood pellets exceeds the cumulative emissions from coal and natural gas for many decades. After about 50 years, forest regrowth can recapture enough carbon to offset the cumulative emissions from wood pellets to below the levels for of fossil fuels. It takes about 15 – 20 more years to reach “carbon neutral” (zero net CO2 emissions) in the early 2080s.

The NRDC report concludes

“In sum, our modeling shows that wood pellets made of whole trees from bottomland hardwoods in the Atlantic plain of the U.S. Southeast—even in relatively small proportions— will emit carbon pollution comparable to or in excess of fossil fuels for approximately five decades. This 5-decade time period is significant: climate policy imperatives require dramatic short-term reductions in greenhouse gas emissions, and emissions from these pellets will persist in the atmosphere well past the time when significant reductions are needed.“

The situation in the U.S.

The U.S. Clean Power Plan, Section V.A, “The Best System of Emission Reduction,” (BSER) defines EPA’s determination of the BESR for reducing CO2 emissions from existing electric generating units. In Section V.A.6, EPA identifies areas of compliance flexibility not included in the BESR. Here’s what EPA offers regarding the use of biomass as a substitute for fossil fuels.

EPA CPP non-BESR

This sounds a lot like what is happening at the Drax power plant in the UK, where three of the six Drax units are co-firing wood pellets along with the other three units that still are operating with coal.

Fortunately, this co-firing option is a less attractive option under the Clean Power Plan than it is under the EU’s Renewable Energy Directive.

You can download the EPA’s Clean Power Plan at the following link:

https://www.epa.gov/cleanpowerplan/clean-power-plan-existing-power-plants#CPP-final

On 9 February 2016, the U.S. Supreme Court stayed implementation of the Clean Power Plan pending judicial review.

In conclusion

The character J. Wellington Wimpy in the Popeye cartoon by Hy Eisman is well known for his penchant for asking for a hamburger today in exchange for a commitment to pay for it in the future.

Wimpy

It seems to me that the EU’s Renewable Energy Directive is based on a similar philosophy. The “renewable” biomass carbon debt being accumulated now by the EU will not be repaid for 50 – 80 years.

The EU’s Renewable Energy Directive is little more than a time-shifted carbon trading scheme in which the cumulative CO2 emissions from burning a particular carbon-based fuel (wood pellets) are mitigated by future carbon sequestration in new-growth forests. This assumes that the new-growth forests are re-planted as aggressively as the old-growth forests are harvested for their biomass fuel content. By accepting this time-shifted carbon trading scheme, the EU has accepted a 50 – 80 year delay in tangible reductions in the cumulative emissions from burning carbon-based fuels (fossil or biomass).

So, if the EU’s Renewable Energy Directive is acceptable for biomass, why couldn’t a similar directive be developed for fossil fuels, which, pound-for-pound, have lower emissions than biomass? The same type of time-shifted carbon trading scheme could be achieved by aggressively planting new-growth forests all around the world to deliver the level of carbon sequestration needed to enable any fossil fuel to meet the same “carbon neutral” criteria that the EU Parliament, in all their wisdom, has applied to biomass.

If the EU Parliament truly accepts what they have done in their Renewable Energy Directive, then I challenge them to extend that “Wimpy” Directive to treat all carbon-based fuels on a common time-shifted carbon trading basis.

I think a better approach would be for the EU to eliminate the “carbon neutral” status of biomass and treat it the same as fossil fuels. Then the economic incentives for burning the more-polluting wood pellets would be eliminated, large-scale deforestation would be avoided, and utilities would refocus their portfolios of renewable energy sources on generators that really are “carbon neutral”.