Category Archives: Power Storage Technology

Ulstein’s Nuclear-powered Thor and its All-electric Companion Vessel Are a Zero-Carbon Solution for Marine Tourism

Peter Lobner

1. Introduction

In June 2022, the Norwegian firm Ulstein (https://ulstein.com) announced their conceptual design of a Replenishment, Research and Rescue (3R) vessel named Thor that will be powered by a thorium molten salt reactor (MSR). This vessel can function as a seaborne mobile charging station for a small fleet of electrically-powered expedition / cruise ships that are designed to operate in environmentally sensitive areas such as the Arctic and Antarctic. Other environmentally sensitive areas include the West Norwegian Fjords, which are UNESCO World Heritage sites that will be closed in 2026 to all ships that are not zero-emission. In the future, similar regulations could be in place to protect other environmentally sensitive regions of the world, thereby reinforcing Ulstein’s business case behind Thor and its all-electric companion vessels.
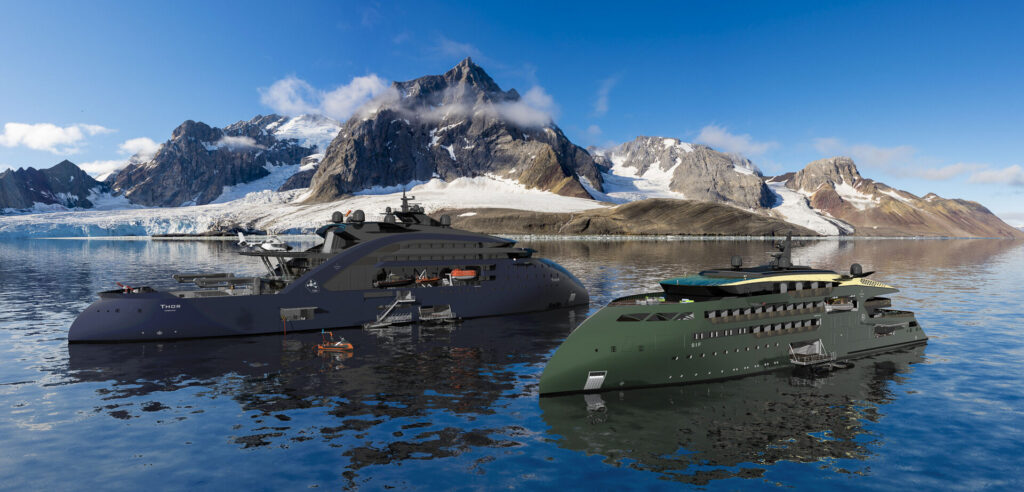
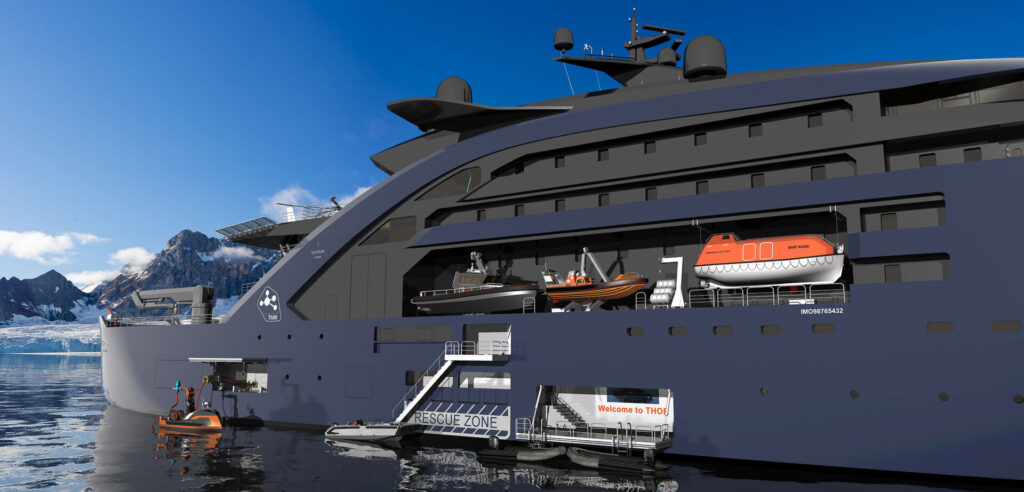
Ulstein’s Thor MSR-powered vessel (left) and 
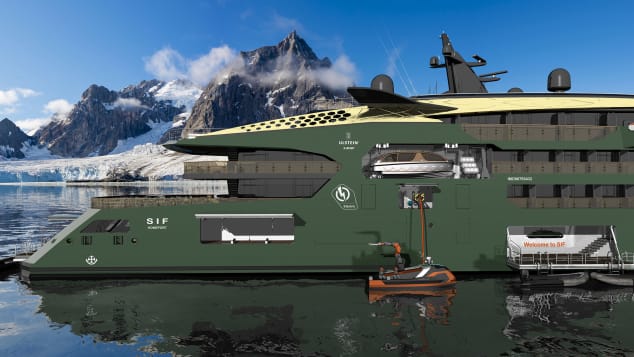
Sif electrically-powered expedition / cruise vessel (right). 
Source: Ulstein

2. The MSR-powered Thor charging station

Thor is a 149-meter (500-foot) long, zero-emission, nuclear-powered vessel that features Ulstein’s striking, backwards-sloping X-bow, which is claimed to result in a smoother ride, higher speed while using less energy, and less mechanical wear than a ship with a conventional bow. 

For its R3 mission, Thor would be outfitted with work boats, cranes, a helicopter landing pad, unmanned aerial vehicles (UAVs), unmanned surface vessels, firefighting equipment, rescue booms, a lecture hall and laboratories.

As a charging station, Thor would be sized to recharge four all-electric vessels simultaneously.
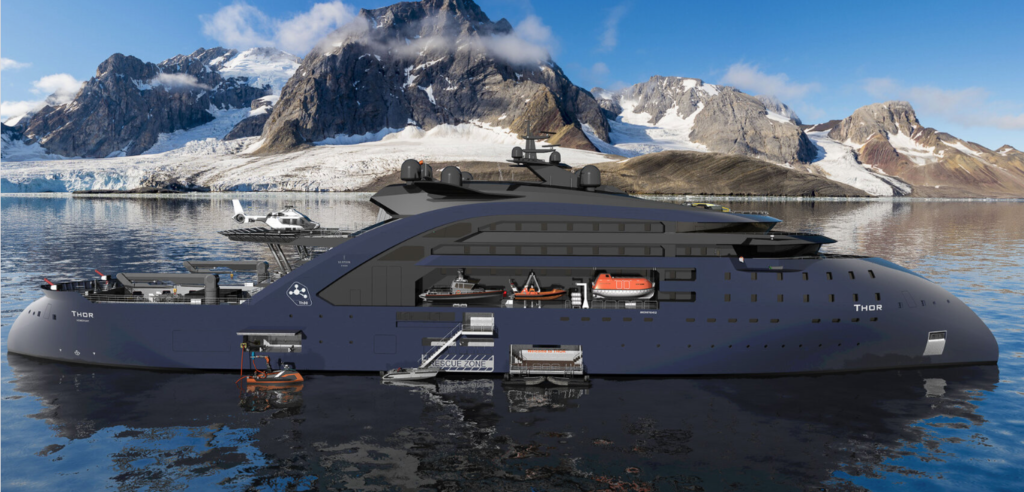
Thor.  Source: Ulstein

Thor also could serve as a floating power station, replacing diesel power barges in some developing countries or in some disaster areas while the local electric power infrastructure is being repaired.

Ulstein projects that an operational Thor vessel could be launched in “10 to 15 years.” However, the development and licensing of a marine MSR is on the critical path for that schedule.  
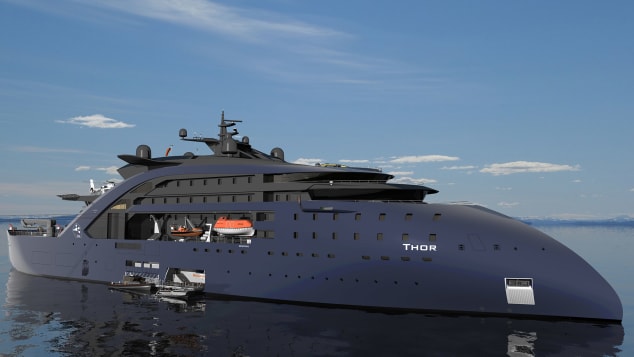
Thor, starboard side views.  Source, both graphics: Ulstein

3. The all-electric Sif expedition / cruise ship

Sif, named after the goddess who was Thor’s wife, is a design concept for a 100-meter (330-foot) long, all-electric, zero-emission expedition / cruise ship designed to operate with minimal impact in environmentally sensitive areas. The ship will be powered by a new generation of solid batteries that are expected to offer greater capacity and resistance to fire than lithium-ion batteries used commonly today.  It will be periodically recharged at sea by Thor.

The ship can accommodate 80 passengers and 80 crew. 
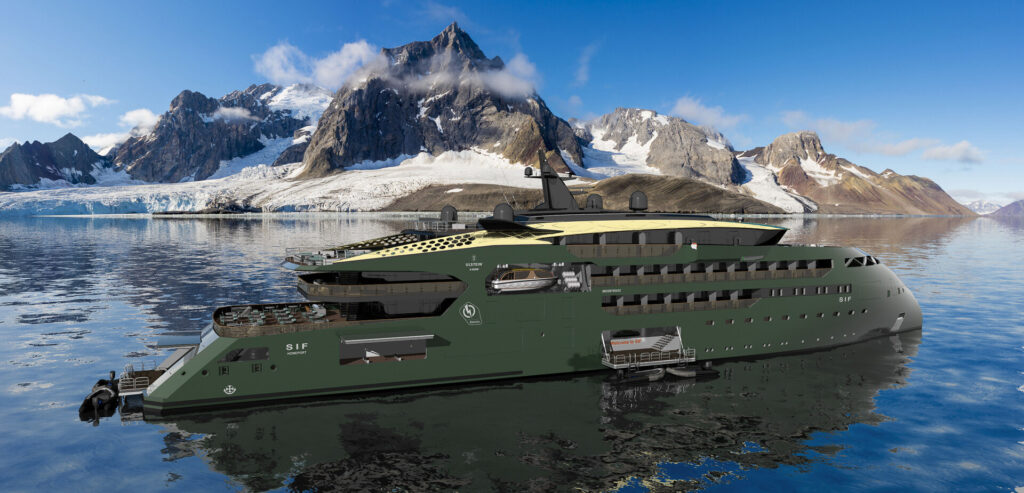
Sif, starboard side view.  Source, both graphics: Ulstein

4. A marine MSR power plant

The pressurized water reactor (PWR) is the predominant marine nuclear power plant in use today, primarily in military vessels, but also in Russian icebreakers and a floating nuclear power plant in the Russian Arctic. 

Ulstein reported that it has been exploring MSR technology because of its favorable operating and safety characteristics. For example, an MSR operates at atmospheric pressure (unlike a PWR) and passive features and systems maintain safety in an emergency. If the core overheats, the molten salt fuel/coolant mixture automatically drains out of the reactor and into a containment vessel where it safely solidifies and can be reused.  You’ll find a good overview of MSR technology here: https://whatisnuclear.com/msr.html

While a few experimental MSRs have operated in the past, no MSR has been subject to a commercial nuclear licensing review, even for a land-based application. Ulstein favors a thorium-fueled MSR. The thorium-uranium-233 fuel cycle introduces additional technical and nuclear licensing uncertainties because of the lack of operational and nuclear regulatory precedents.

Several firms are developing MSR concepts. However, the combination of a marine MSR and a thorium fuel cycle remains elusive. Two uranium-fueled marine MSR design concepts are described below.

Seaborg Technologies

The Danish firm Seaborg Technologies (https://www.seaborg.com), founded in 2014, is developing a compact MSR (CMSR) with a rating of about 250 MWt / 100 MWe for use in power barges (floating nuclear power plants) of their own design (see my 16 May 2021 post). The thermal-spectrum CMSR uses uranium-235 fuel in a molten proprietary salt, with a separate sodium hydroxide (NaOH) moderator.  
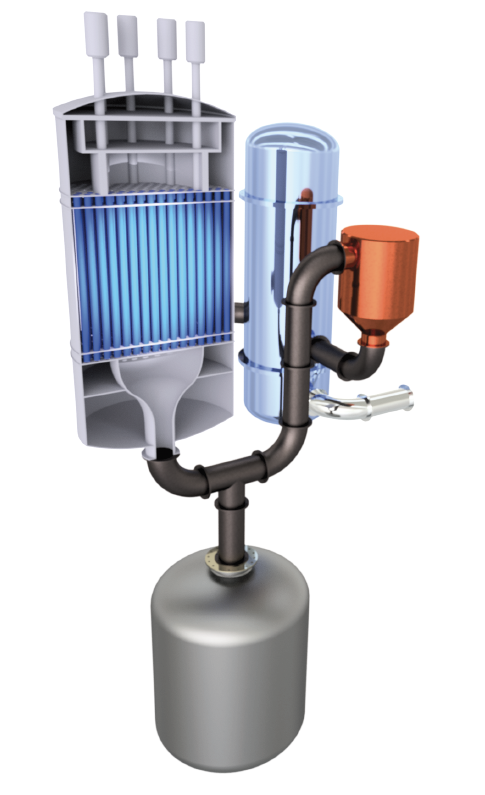
A Seaborg Technologies CMSR module could generate 100 MWe. Dump tank shown below reactor. Source: Seaborg via NEI (2022)

Seaborg’s development time line calls for a commercial CMSR prototype to be built in 2024, with commercial production of power barges beginning in 2026. 

Source: Seaborg (2022)

In April 2022, Seaborg and the Korean shipbuilding firm Samsung Heavy Industries signed a partnership agreement for manufacturing and selling turnkey CMSR power barges. 

On 10 June 2022, Seaborg was selected by the European Innovation Council to receive a significant (potentially up to €17.5 million) innovation grant to help accelerate their work on the CMSR.

CORE-POWER and the Southern Company consortium

The UK firm CORE-POWER Ltd. (https://corepower.energy), founded in 2018, began with a concept for a compact uranium-235 fueled, molten chloride salt reactor named the m-MSR for marine applications. This modular, inherently safe, 15 MWe micro-reactor system was designed as a zero-carbon replacement power source for the fossil-fueled power plants in many existing commercial marine vessels.  It also was intended for use as the original power source for new vessels, as proposed for the Earth 300 Eco-Yacht design concept unveiled by entrepreneur Aaron Olivera in April 2021 (see my 17 April 2021 post). The power output of a modular CORE-POWER m-MSR installation could be scaled to meet operational needs by adding reactor modules in compact arrangements suitable for shipboard installation. 
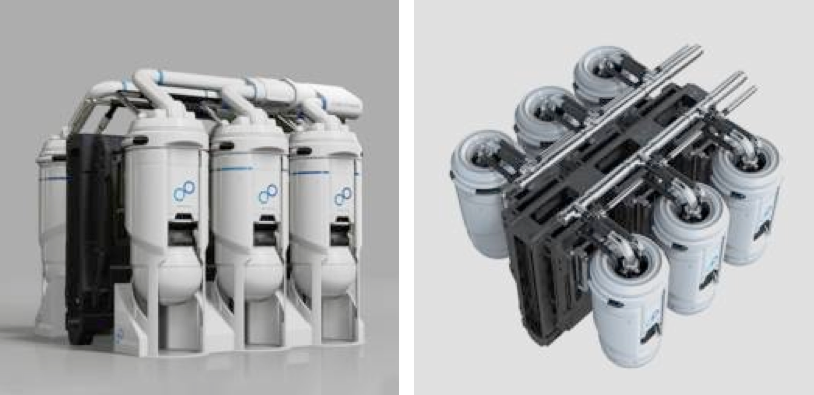
A set of six small, compact CORE-POWER m-MSR modules
could generate 90 MWe. Dump tank not shown. Source: CORE-POWER

In November 2020, CORE-POWER announced that it had joined an international consortium to develop MSRs. This team includes the US nuclear utility company Southern Company (https://www.southerncompany.com), US small modular reactor developer TerraPower (https://www.terrapower.com) and nuclear technology company Orano USA (https://www.orano.group/usa/en). In the consortium, TerraPower is responsible for the fast-spectrum Molten Chloride Fast Reactor (MCFR). CORE-POWER is responsible for maritime readiness and regulatory approvals.

This consortium applied to the US Department of Energy (DOE) to participate in cost-share risk reduction awards under the Advanced Reactor Demonstration Program (ARDP), to develop a prototype MCFR as a proof-of-concept for a medium-scale commercial-grade reactor. In December 2020, the consortium was awarded $90.4 million, with the goal of demonstrating the first MCFR in 2024.  DOE reported, “They expect to begin testing in a $20 million integrated effects test facility starting in 2022. The team has successfully scaled up the salt manufacturing process to enable immediate testing. Data generated from the test facility will be used to validate thermal hydraulics and safety analysis codes for licensing of the reactor.”In February 2021, CORE-POWER presented the MCFR development schedule in the following chart, which shows the MCFR becoming available for deployment in marine propulsion in about 2035.  This is within the 10 to 15 year timescale projected by Ulstein for their first Thor vessel.
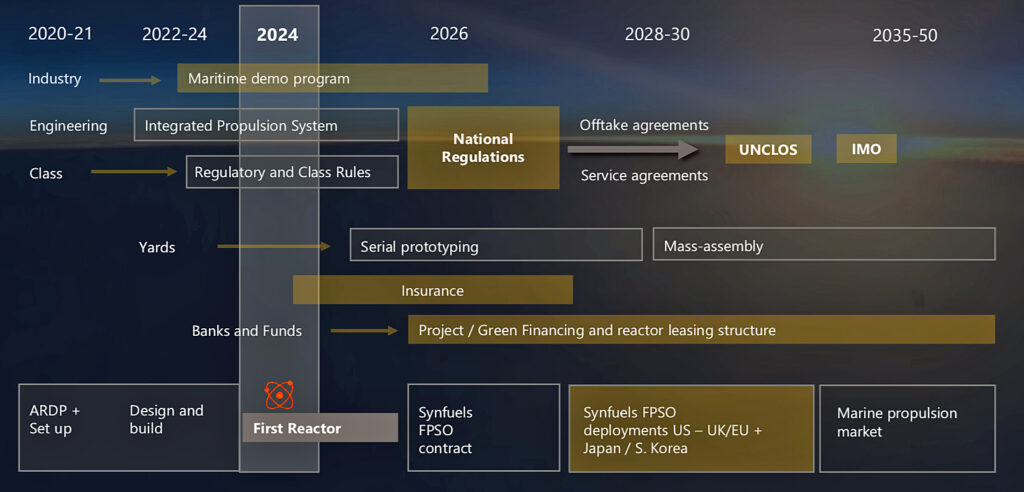
Source: CORE-POWER (2021)

5. In conclusion

A seaborne nuclear-powered “charging station” supporting a small fleet of all-electric marine vessels provides a zero-carbon solution for operating in protected, environmentally sensitive areas that otherwise would be off limits to visitors. Ulstein’s concept for the MSR-powered Thor R3 vessel and the Sif companion vessel is a clever approach for implementing that strategy.

It appears that a uranium-fueled marine MSR could be commercially available in the 10 to 15 year time frame Ulstein projects for deploying Thor and Sif.  The technical and nuclear regulatory uncertainties associated with a thorium-fueled marine MSR will require a considerably longer time frame. 

6. For additional information 

Ulstein Thor & Sif

Video

Seaborg CMSR

CORE-POWER m-MSR

New Grid-scale Energy Storage Alternatives to Batteries

Peter Lobner

1. Introduction

As the world generates an increasing fraction of its electricity from intermittent renewable energy sources, there currently are growing problems with grid stability and there will be problems delivering electric power on demand 24/7 unless the huge swings in intermittent renewable generating capacity are brought under control.

The nature of the intermittent photovoltaic (PV) energy generation problem is described in a 2020 paper by Alberto Boretti, et al., in which the authors note, “Because of increasing uptake (of electricity) and the phasing out of back-up conventional power plants producing energy on demand, there is the necessity to study the current variability of the (PV) capacity factors based on the actual energy production.”  The authors concluded, “While the best-performing (PV) facilities achieve annual capacity factors of about 32-33%, the average annual capacity factor is less than 30%, at about 26-27%.”
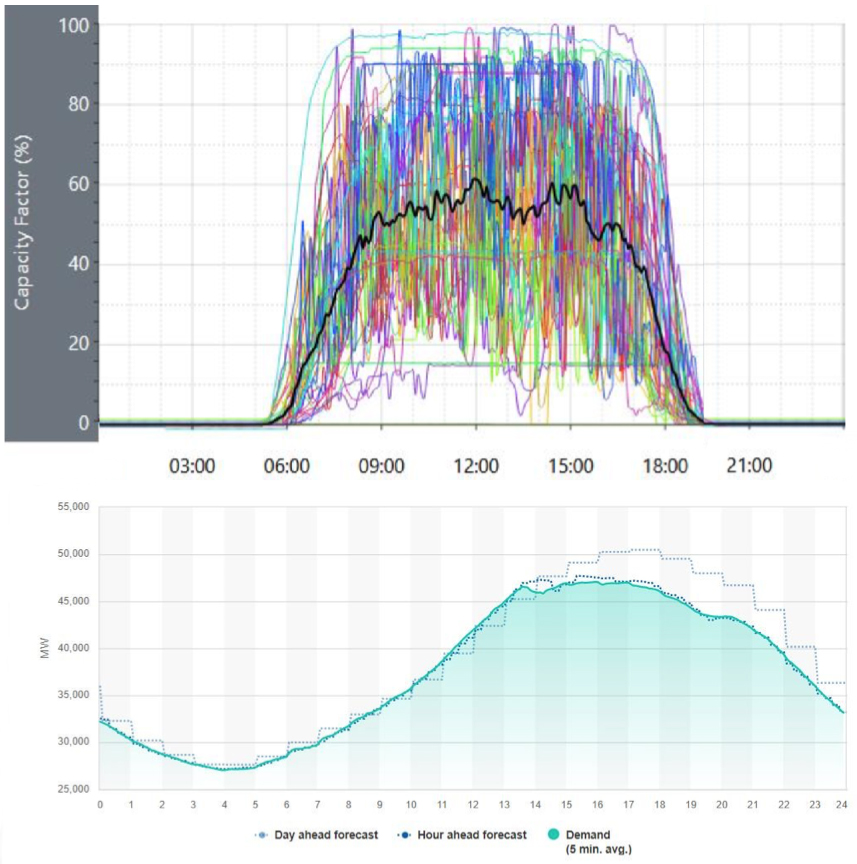
During the course of an average day, PV generation can go from 0% at night to 100% at mid-day, with “tails” as generation capacity grows in the morning and falls off in the evening, and variability during the day due to weather.  Using Australian high-frequency capacity factor data (because similar data were unavailable in the US), Alberto Boretti, et al., developed the following chart that compiles the capacity factors from many individual PV plants and computes their average capacity factor (the dark line in the top chart), which is a measure of the average PV generating capacity actually delivered to the grid over the course of a 24 hour period.
The second chart shown below shows the actual load demand in megawatts (MW) from the California grid operator, CAISO, for 18 August 2020, a hot day with high load demand.  The broad (5-hour) peak mid-day demand on the CAISO grid was about 47,000 MW.  Minimum demand at about 4 AM was about 27,000 MW.

Comparison of a representative PV generation cycle & grid demand cycle.
Sources: (Top) adapted from Alberto Boretti, et al. (2020),
(Bottom): CAISO via GreenTechMedia (19 Aug 2020)

Hopefully, you see the problem.  In this case for PV generation, the generation cycle is not in sync with the demand cycle.  If states and nations are unwilling to address this mismatch with reliable generators that can be started on demand, then large-scale deployment of long-duration, grid-scale energy storage systems will be needed to meet electricity demand 24/7. 

What do “long duration” and “grid-scale” mean?  Look at the above curves and you can see the answers for yourself.  How long is there no PV generation between sunset and sunrise?  It’s 10 to 14 hours in Southern California, depending on the time of year.  How much is 10% of peak demand on the CAISO grid?  On 18 August 2020, that would have been about 4,700 MW, about the generating capacity for four nuclear power plants (but California only has two nuclear power plants, and those will be retired in 2024 and 2025).  My point is that even 10% of peak demand is a big number and to store just one hour of that requires 4,700 MWh (megawatt-hours) of storage.  The numbers only get bigger as you look at the amount of energy storage needed to meet demand for several hours, or over night. 

To establish a point of reference regarding grid-scale energy storage capacity, here are a few important points.

  • California has a goal of having an energy generation portfolio with 60% renewable generation sources by 2030.  That equates to a renewable generating capacity of up to 28,000 MW during the broad mid-day peak demand period on a hot day.
  • California has a goal of having 10,000 MW of “energy storage” by 2030, but they haven’t defined the needed storage capacity in terms of MWh.  Most of the battery energy storage systems (BESS) delivered to date in California can operate at rated power for only 1 – 2 hours.  That can help reduce short-term power peaking problems during the day, but is not useful for long-term power delivery at night.
  • The Gateway Energy Storage project in San Diego County, CA, currently the largest BESS in the world. It is rated a 250 MW with an energy storage capacity of about 250 MWh.  That will supply about 0.5% of CAISO’s peak grid demand for less than one hour because the battery can’t be fully discharged.  In terms of grid-scale energy storage requirements, this “world’s largest energy storage project” is still pretty small.  It represents less than 10% of the output of the Diablo Canyon nuclear power plant for one hour, after which the BESS would be exhausted while Diablo Canyon would continue delivering electricity for the remaining 23 hours of the day, generating about 54,000 MWh per day with zero carbon emissions, day after day. 

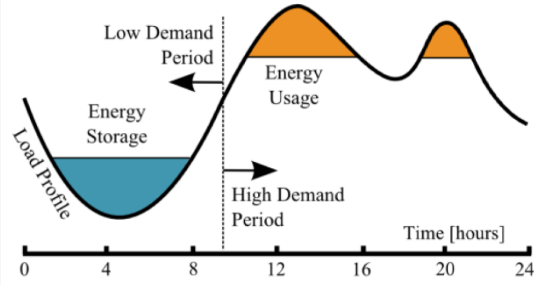
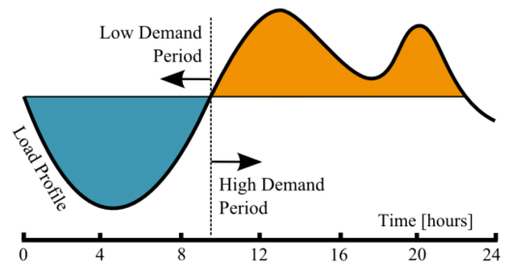
An approach for using energy storage systems to help meet daily peak load demand is shown in the following graphs, with energy storage from online power generators early in the day (blue) and stored energy dispatch (orange) later in the day to supplement online power generators and reduce the peak generation demand.  In the top curve, the online power generators need to follow the load profile curve between the lower and upper limits set by the “energy storage” and “energy usage”  horizontal lines. With more energy storage capacity, the second graph illustrates the case of constant online generation capacity (the single horizontal line), with all demand variability being absorbed by charging and discharging energy storage systems.

Examples of daily load leveling using electrical energy storage systems to absorb variability in demand (more storage available in the bottom graph)
Source, both graphics: Siraj Sabihuddin, et.al. (2014)

As electric vehicles proliferate, the peak of the demand curve will likely continue longer into the evening and night as commercial and private vehicles are recharged.  The mismatch between the generation cycle of intermittent PV energy sources and the demand curve will be getting larger.

In this post, we’ll take a look two technologies for long-duration, grid-scale energy storage systems:

  • Advanced compressed air energy storage (A-CAES)
  • Solid medium gravity energy storage

Both of these energy storage systems convert electrical energy into potential energy that can be released on demand, for example, as high-pressure air or a large suspended weight.  As you might expect, these are not “perpetual motion” systems and energy is consumed with each energy storage and discharge cycle.  That means that less electricity can be dispatched than was originally input for storage.  High cycle efficiency becomes a very important performance parameter for energy storage systems. Manchester University, UK, reported on a BESS that had round-trip energy losses between 9.6% and 12.5% for a variety of full charge / discharge cycles, placing BESS cycle efficiency at between 87.5% and 90.4%. 

The A-CAES and solid medium gravity energy storage technologies appear to have long operating lifetimes, which could give them an advantage over battery energy storage systems. The National Renewable Energy Laboratory (NREL) has determined that current technology lithium-ion battery life in BESS applications is limited to about 10 years with active thermal management and restricted cycling, and about 7 years without thermal management.  Over the operating life of a grid-scale BESS, the batteries will have to be replaced periodically, adding to BESS life-cycle cost.

Keep in mind why these energy storage systems are needed.  Going “green” is not simple, and relying on power generation from intermittent renewable energy sources comes with the obligation to deploy long-duration, grid-scale energy storage systems to ensure that electricity demand can be met 24/7.  Rest assured, this will all show up on your future electricity bills.

2. Advanced compressed air energy storage (A-CAES)

Toronto-based Hydrostor (https://www.hydrostor.ca/company/) is a leading developer of Advanced Compressed Air Energy Storage (A-CAES) systems.  Their first system entered service in 2019.  Several other A-CAES systems are being developed.

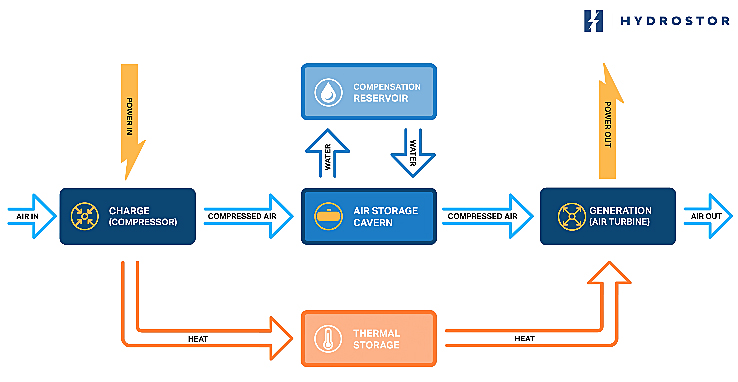
The basic A-CAES process is shown in the following diagram.

A-CAES process flow. Source: Hydrostor.

Surplus electric generating capacity is used to compress ambient air to produce heated compressed air. A thermal management system captures and stores the heat produced during compression as sensible heat. The cooled, compressed air is stored in a purpose-built underground storage cavern that is maintained at constant pressure by the hydrostatic head of water in a standpipe connected to a compensation reservoir on the surface.  As the storage cavern is charged, water in the cavern is displaced and flows up the standpipe, into the compensation reservoir.

When there is a demand for energy from the storage system, compressed air is released from the underground air storage cavern, reheated by the thermal management system and discharged through an air turbine to generate electricity.  Water flows back from the compensation reservoir on the surface into the storage cavern to maintain the pressure of the air remaining in storage.

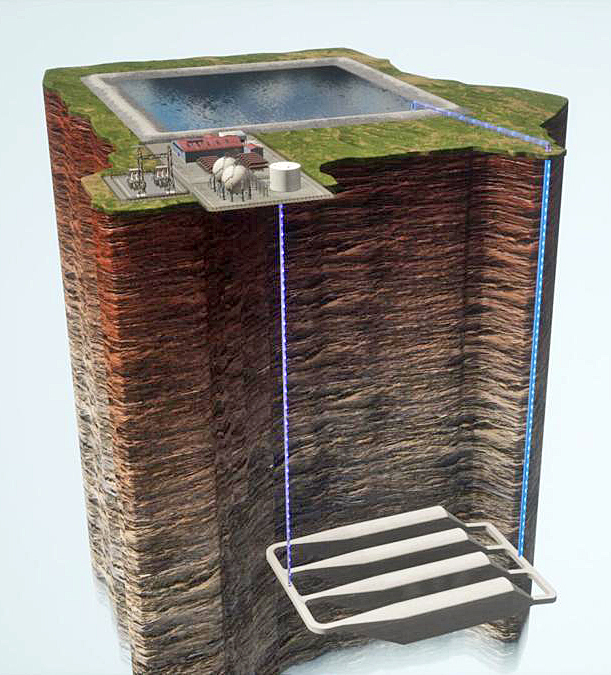
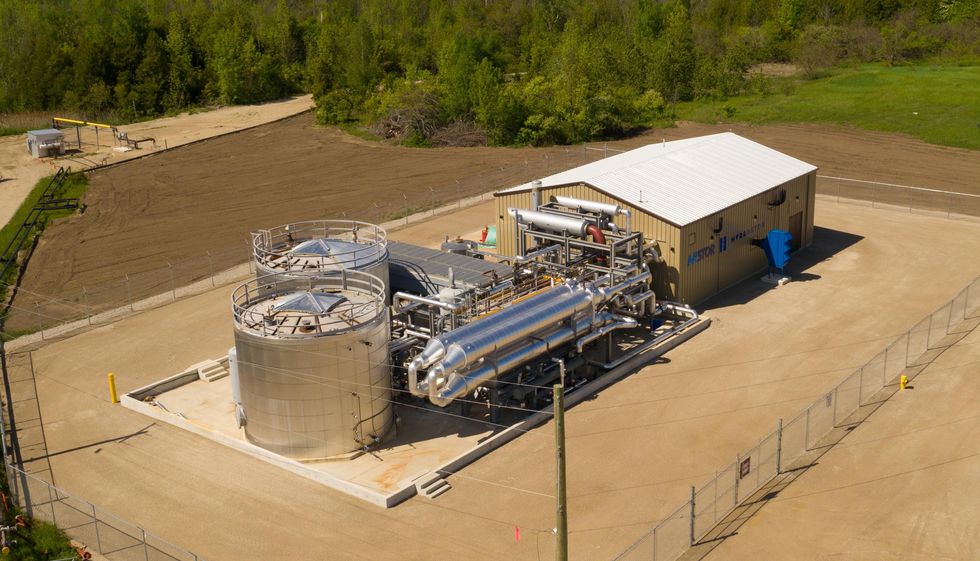
A representative Hydrostor installation showing the purpose-built underground air storage cavern and its bi-directional interfaces with the compressed air system (purple line) and the hydrostatic compensation reservoir on the surface (blue line).
Source: Hydrostor
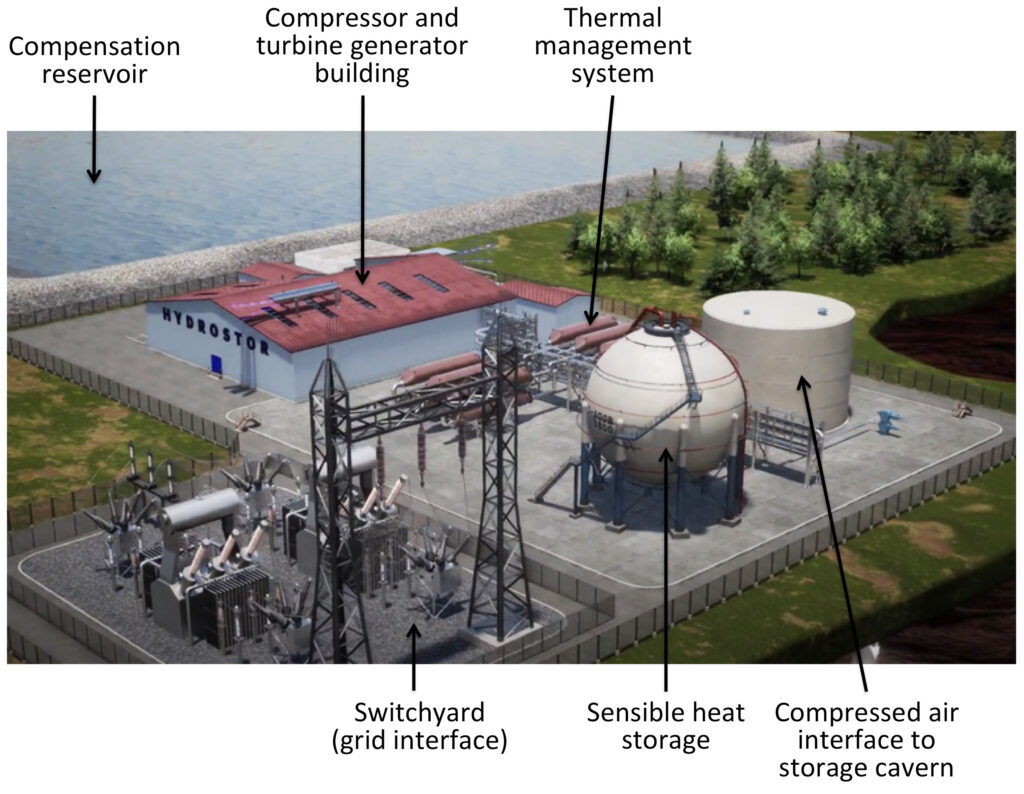
General arrangement of the aboveground facilities of a representative A-CAES facility. 
Source: Adapted from Hydrostor

This A-CAES process is entirely fuel-free and produces zero greenhouse gas emissions.  The operation of the Hydorstor system is explained in the 2021 video, “How Hydrostor Is Enabling The Energy Transition” (3:54 minutes) at the following link: https://www.youtube.com/watch?v=cOWjwwKSR78

Hydrostor’s Goderich A-CAES Facility

The Goderich A-CAES Facility, which went into service in 2019 in Goderich, Ontario, Canada, is the world’s first commercially contracted A-CAES facility.  It is in regular service on Ontario’s Independent Electricity System Operator (IESO) grid.  

This utility-scale system can deliver a peak power output of 1.75 MW, has a maximum charge rate of 2.2 MW, and has more than 10 MWh of energy storage capacity.  The system can deliver rated power for 5 to 6 hours.

Hydrostor notes that this use of A-CAES technology “is a significant achievement, conforming to all interconnection, uptime, performance and dispatch standards as set out by the IESO.  Hydrostor’s Goderich energy storage facility proves out the ability of Hydrostor’s A-CAES technology to fully participate in and deliver a range of valuable grid services to electricity markets.”

More information on the Goderich A-CAES Facility is available here:  https://www.hydrostor.ca/goderich-a-caes-facility/

The aboveground portion of the Goderich A-CAES Facility. Source: Hydrostor

Rosamond Energy Storage Project 

Hydrostor, with partners Pattern Development and Meridiam, is developing the much larger Rosamond Energy Storage Project in Kern County, CA.  This A-CAES project will have a rated power of 500 MW and an energy storage capacity of 4,000 MWh, which will provide for 8 hours of operation at rated power.  This project was announced on 29 April 2021 and is expected to enter service in 2026.  Customers would include the Los Angeles Department of Water and Power and the operator of the state power grid, CAISO.

More information on the Rosamond Energy Storage Project is available here: http://www.hydrostor.ca/rosamond/

3. Solid medium gravity energy storage systems

Pumped storage hydroelectric (PSH) is a type of gravity energy storage system that has been in existence for many decades.  Such systems are dependent on regional topography with a suitable water source in proximity to a suitable elevated water storage basin.  Surplus electric power is used to pump a large volume of water up to the elevated storage basin. Later, water is released through a penstock to a hydroelectric turbine to generate electricity on demand. Among current energy storage technologies, the Electric Power Research Institute (EPRI) rates PSH highest as a long-duration, grid-scale energy storage system. General Electric reports that the round-trip energy efficiency of PSH typically is about 80%.

The solid medium energy storage systems work on a similar principle of using surplus power to raise a solid mass to a relatively high elevation and later release the suspended mass and use it to mechanically drive a generator during its controlled descent.  Two firms working on this type of gravity energy storage system are Energy Vault and Gravitricity.  Unlike PSH, their gravity energy storage systems are not dependent on the local topography.  Here’s a brief look at their systems.

Energy Vault

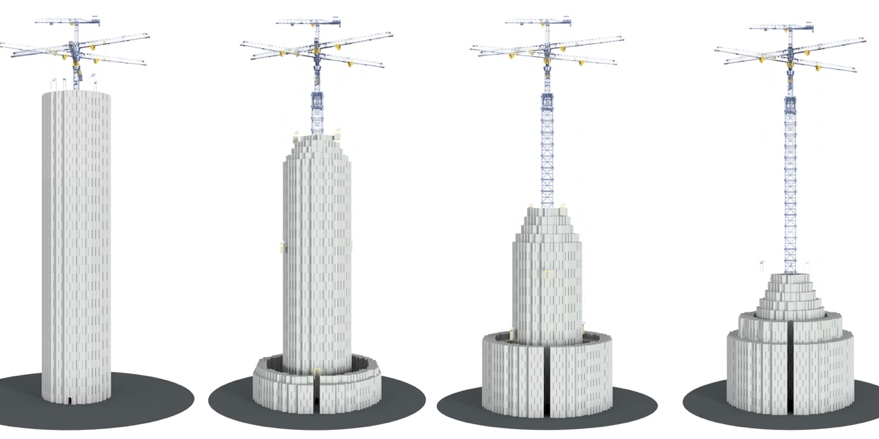
California-based startup incubator Idealab (https://www.idealab.com), developed an energy storage concept that uses a tall tower topped with tower cranes as a platform for systematically building and deconstructing stacks of regularly shaped heavy masses (bricks).  Potential energy is stored as bricks are raised and emplaced at a higher elevation.  Energy is recovered when a brick at a higher elevation is picked up and lowered while using the suspended mass to drive a generator, a bit like the regenerative braking system on a Toyota Prius.  With multiple cranes in use to move the bricks, energy storage and discharge rates can be adjusted to match operational needs until the stack of bricks is completely constructed (fully charged) or deconstructed (discharged). The Swiss firm Energy Vault (https://energyvault.com) is commercializing this gravity energy storage technology.

 (L to R) Deconstructing an Energy Vault tower to recover energy.
Source: Business Wire

You can watch a 2019 Energy Vault video simulation here: https://vimeo.com/335818817

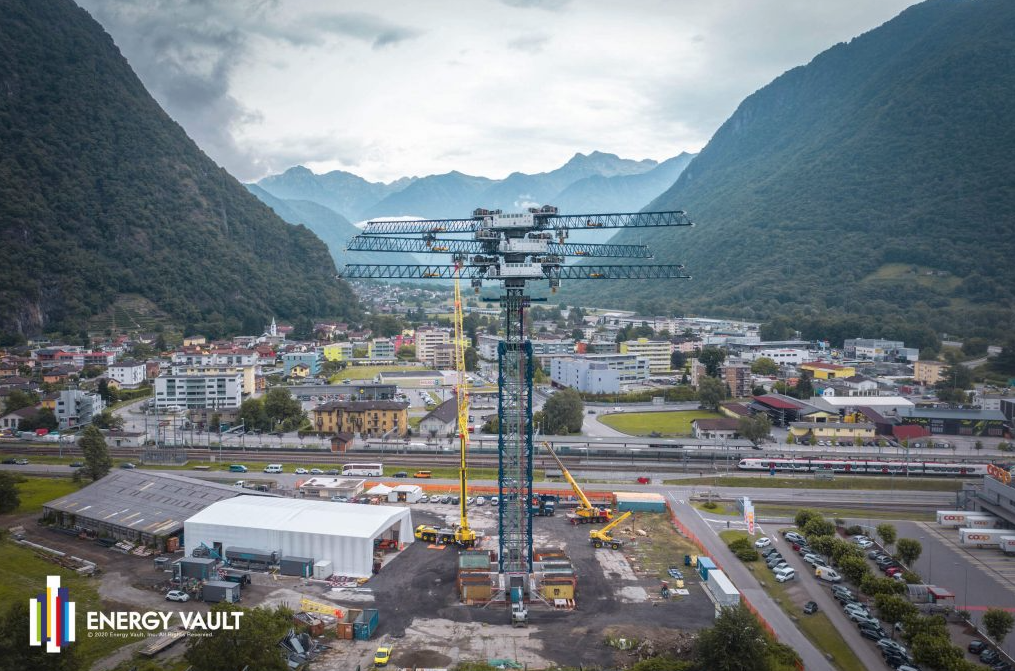
In partnership with Italian energy company ENEL, Energy Vault built a sub-scale demonstration system in Ticino, Switzerland and has operated the system connected to the regional grid since July 2020. 

Energy Vault’s demonstration system in Ticino, Switzerland.  Source: Energy Vault

The 110 meter (361 ft) tall unit can store 35 MWh of energy.Energy Vault reported that, from proposition to working prototype, the demonstration system took about nine months to complete and cost less than US $2 million.  

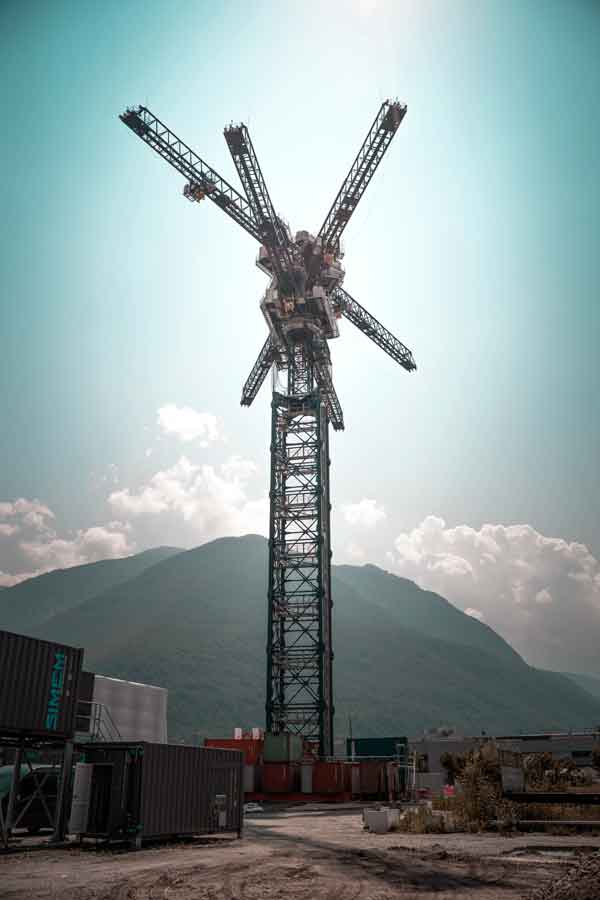
Energy Vault’s demonstration system in Ticino, Switzerland, 
not including the 35 metric ton bricks. Source: Energy Vault

Lessons learned from the demonstration unit include:

  • A tower can be erected quickly; the cranes can be delivered within months and erected within weeks.
  • The heavy masses (35 ton composite bricks) can be made from a variety of  materials, including concrete construction debris that would otherwise go to a landfill. At a coal plant site, the bricks could be made with coal ash aggregate.  
  • The mechanical systems do not degrade, providing a long operating life of the project.
  • Specially engineered control software ensures the bricks are placed in exactly the right location each time.
  • Round-trip cycle efficiency is between 80% and 90%.

Energy Vault claims that they have created the world’s only cost-effective, utility-scale gravity-based energy storage system that is not dependent on land topography or specific geology underground.

With its modular, scalable system design, Energy Vault expects to offer energy storage systems with a range of power ratings, from 4 to 8 MW, and energy storage capacities, from 20 to 80 MWh.  These systems can serve as long-duration power sources, delivering rated power for hours.

Gravitricity

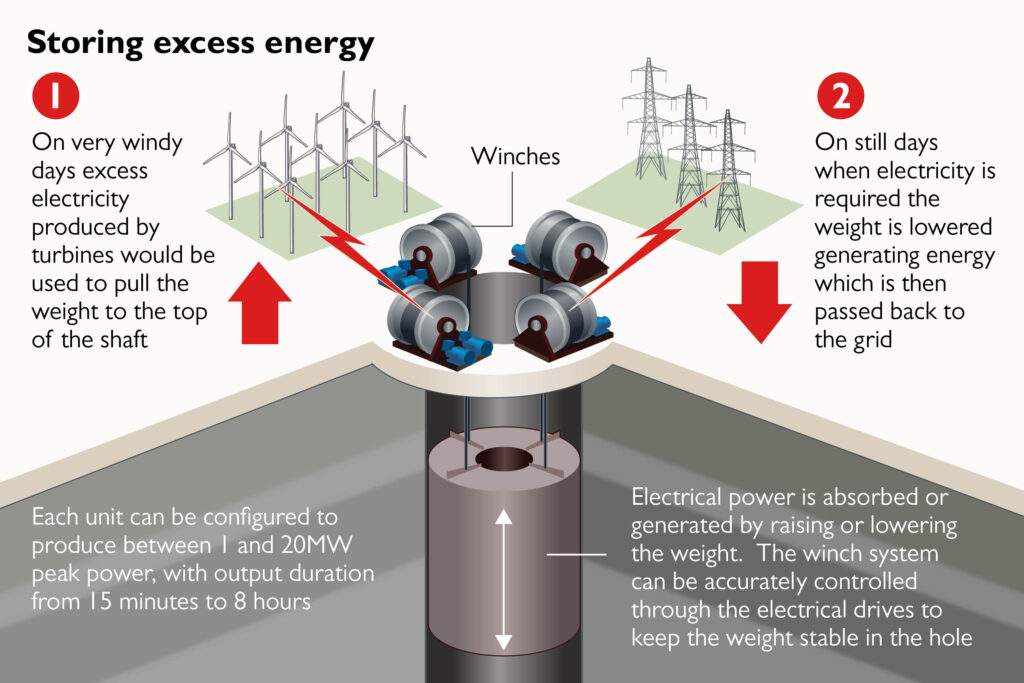
Scottish firm Gravitricity Ltd. (https://gravitricity.com) is developing a novel mechanical energy storage technology in which excess electric power is used to power winches that raise a heavy mass inside a deep shaft.  At its new, higher elevation, potential energy has been stored in the heavy mass. Electricity is generated when needed by releasing the heavy mass and allowing it to drop under the influence of gravity, but restrained by a braking system that extracts kinetic energy as electricity until the heavy mass makes a controlled stop at the bottom of the shaft, or at some intermediate height.

You’ll find a short (3:42 minutes) 2020 animated video describing the Gravitricity energy storage technology here:  https://www.youtube.com/watch?v=meFkbADJq28

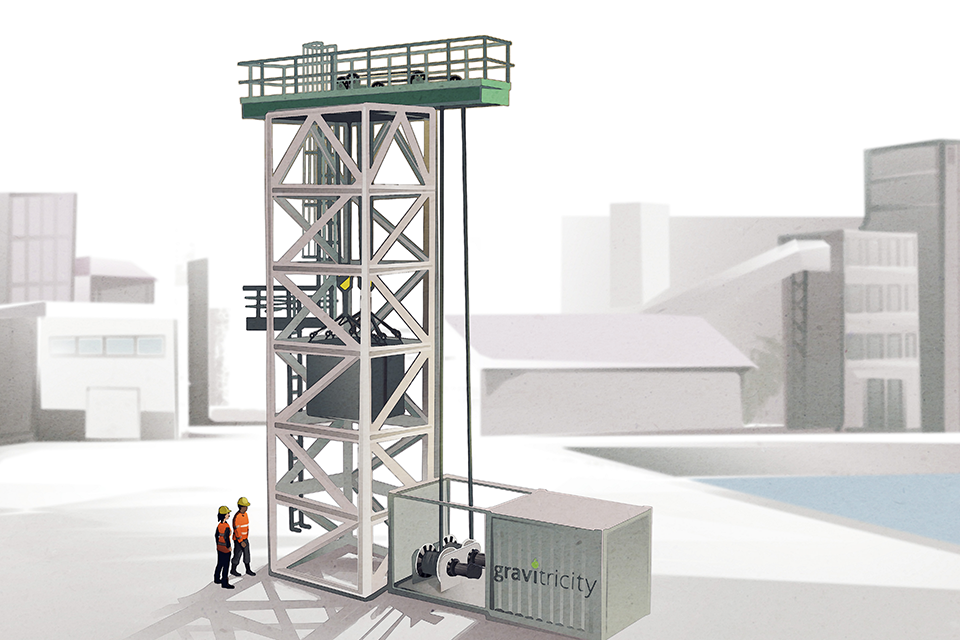
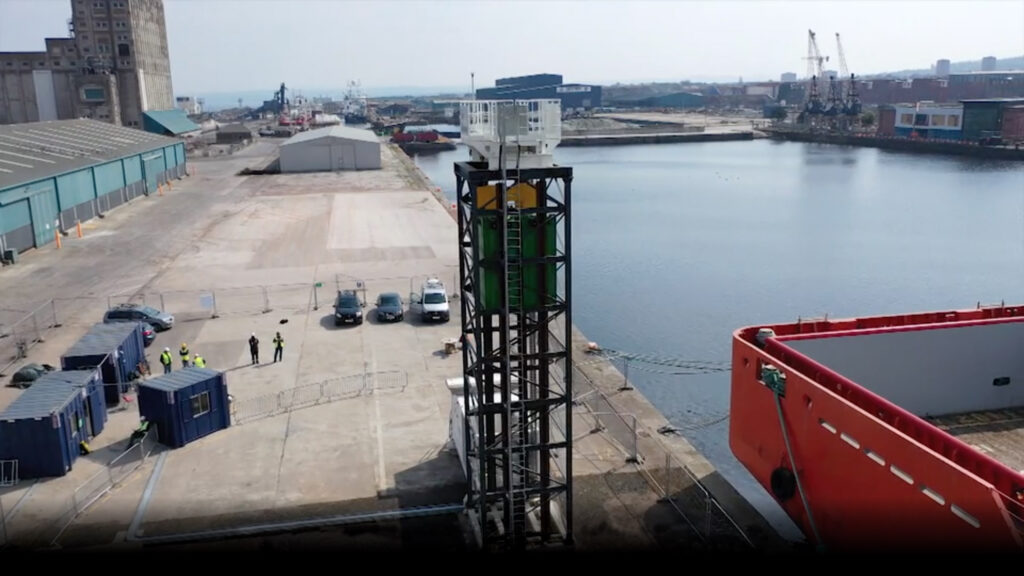
To demonstrate this technology, Gravitricity constructed a 15-meter (49-foot) tall test rig at a cost of £1 million (US $1.4 million) at the Port of Leith in Edinburgh, Scotland. 

Test rig schematic drawing. Source: Gravitricity
The actual test rig. Source: Gravitricity

This 250 kW concept demonstrator uses two 25-metric ton (27.5-ton) weights suspended by steel cables connected to two winches. With a 7-meter (23-ft) lift, this demonstration system should be able to store almost 1.0 kWh of energy. After being released at the top of the tower, the two weights discharge their stored energy via a regenerative braking system for little more than 10 seconds. While the test duration is short, it is sufficient to demonstrate that the concept works. Moreover, the demonstrator is being used to validate engineering simulations that will be used in the design of a full-scale system.

Gravitricity plans to offer systems in the 1 MW to 20 MW power range with output durations from 15 minutes to 8 hours.  Key operating parameters are:

  • Flexible, controllable power output and total energy delivered. 
  • Response time: zero to full power in less than one second.
  • Cycle efficiency: between 80% and 90%
  • Design life: 50-years, with no cycle limit or degradation

A single mass system is well suited for applications that require high power quickly and for a short duration. 

Concept for a single-weight energy storage system.
Source: Gravitricity

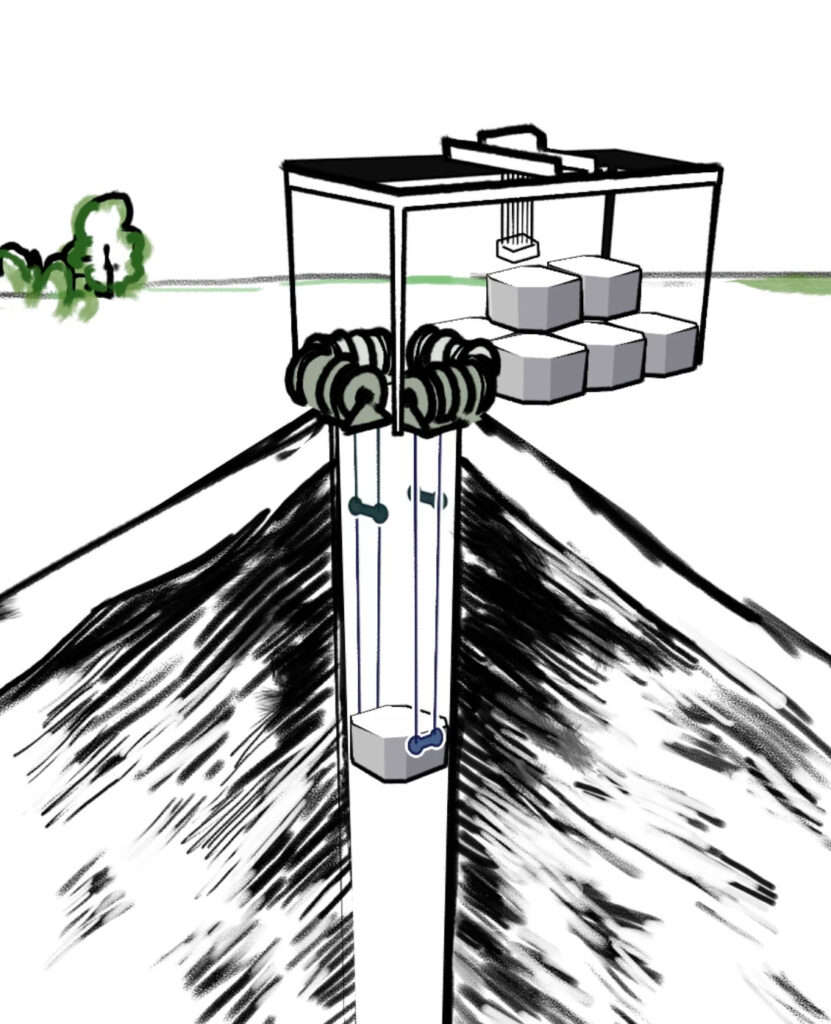
Multiple-weight systems are better suited to storing more energy and releasing power over a longer period.

Concept for a multiple-weight energy storage system.
Source: Gravitricity

A full-scale system will be designed to operate in retired (end-of-life) mine shafts or purpose-built deep shafts rather than in tall towers. In the UK, some potentially suitable mines have end-of-life shafts that go to depths of 750 m (2,461 ft).  Deep shafts specifically built for the job could have a depth in excess of 2 km (1.2 miles).  Masses up to 12,000 metric tons / 13,200 tons may be used.

The energy storage capacity of a Gravitricity system can be quite significant.  For example:

  • A 12,000 metric ton mass suspended at the top of a 750 m deep mineshaft has a potential energy of about 24.5 MWh.
  • The same 12,000 metric ton mass suspended at the top of a 2 km purpose-built deep shaft has a potential energy of about 65.3 MWh.

Gravitricity reports that they currently are developing a number of project opportunities at existing mines with end-of-life shafts that are suitable for full-scale prototype energy storage systems.  Candidate end-of-life shafts have been identified in the UK, the Moravian Silesian Region of Czech Republic and adjacent areas in Poland, and in South Africa.  Gravitricity estimates that over 10,000 MWh of energy storage capacity can be deployed globally in existing end-of-life mine shafts.

In the longer term, Gravitricity plans to sink purpose-built shafts, allowing their energy storage technology to be deployed wherever it is required.  Multiple, purpose-built shafts can be built in the same area to scale the total energy storage capacity to meet user requirements.

Gravitricity expects that their system will have a levelized cost of storage (cost/MWh) that is significantly less than for  lithium-ion battery energy storage systems

4. For more information

Need for grid-scale energy storage:

Advanced compressed air energy storage (A-CAES):

Solid medium gravity energy storage:

The Importance of Baseload Generation and Real-Time Control to Grid Stability and Reliability

Peter Lobner

On 23 August 2017, the Department of Energy (DOE) issued a report entitled, “Staff Report to the Secretary on Energy Markets and Reliability.” In his cover letter, Energy Secretary Rick Perry notes:

“It is apparent that in today’s competitive markets certain regulations and subsidies are having a large impact on the functioning of markets, and thereby challenging our power generation mix. It is important for policy makers to consider their intended and unintended effects.”

Among the consequences of the national push to implement new generation capacity from variable renewable energy (VRE) resources (i.e., wind & solar) are: (1) increasing grid perturbations due to the variability of the output from VRE generators, and (2) early retirement of many baseload generating plants because of several factors, including the desire of many states to meet their energy demand with a generating portfolio containing a greater percentage of VRE generators. Grid perturbations can challenge the reliability of the U.S. bulk power systems that comprise our national electrical grid. The reduction of baseload capacity reduces the resilience of the bulk power system and its ability dampen these perturbations.

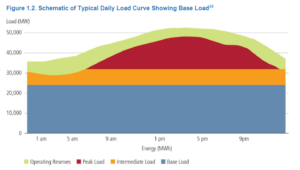
The DOE staff report contains the following typical daily load curve. Baseload plants include nuclear and coal that operate at high capacity factor and generally do not maneuver in response to a change in demand. The intermediate load is supplied by a mix of generators, including VRE generators, which typically operate at relatively low capacity factors. The peak load generators typically are natural gas power plants that can maneuver or be cycled (i.e., on / off) as needed to meet short-term load demand. The operating reserve is delivered by a combination of power plants that can be reliably dispatched if needed.

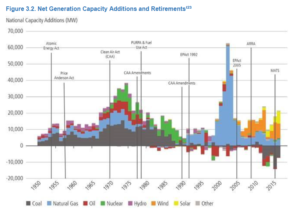
The trends in new generation additions and old generation retirements is summarized in the following graphic from the DOE staff report.

Here you can see that recent additions (since 2006) have focused on VRE generators (wind and solar) plus some new natural gas generators. In that same period, retirements have focused on oil, coal and nuclear generators, which likely were baseload generators.

The DOE staff report noted that continued closure of baseload plants puts areas of the country at greater risk of power outages. It offered a list of policy recommendations to reverse the trend, including providing power pricing advantages for baseload plants to continue operating, and speeding up and reducing costs for permitting for baseload power and transmission projects.

Regarding energy storage, the DOE staff report states the following in Section 4.1.3:

“Energy storage will be critical in the future if higher levels of VRE are deployed on the grid and require additional balancing of energy supply and demand in real time.”

“DOE has been investing in energy storage technology development for two decades, and major private investment is now active in commercializing and the beginnings of early deployment of grid-level storage, including within microgrids.”

Options for energy storage are identified in the DOE staff report.

You can download the DOE staff report to the Secretary and Secretary Perry’s cover letter here:

https://energy.gov/downloads/download-staff-report-secretary-electricity-markets-and-reliability

Lyncean members should recall our 2 August 2017 meeting and the presentation by Patrick Lee entitled, “A fast, flexible & coordinated control technology for the electric grid of the future.” This presentation described work by Sempra Energy and its subsidiary company PXiSE Energy Solutions to address the challenges to grid stability caused by VRE generators.   An effective solution has been demonstrated by adding energy storage and managing the combined output of the VER generators and the energy storage devices in real-time to match supply and demand and help stabilize the grid. This integrated solution, with energy storage plus real-time automated controls, appears to be broadly applicable to VRE generators and offers the promise, especially in Hawaii and California, for resilient and reliable electrical grids even with a high percentage of VRE generators in the state’s generation portfolio.

You can download Patrick Lee’s 2 August 2017 presentation to the Lyncean Group of San Diego at the following link:

https://lynceans.org/talk-113-8217/

Significant Advances in the Use of Flow Cell Batteries

Peter Lobner

My 31 January 2015 post, “Flow Cell Battery Technology Being Tested as an Automotive Power Source,” addressed flow cell battery (also known as redox flow cell battery) technology being applied by the Swiss firm nanoFlowcell AG for use in automotive all-electric power plants. The operating principles of their nanoFlowcell® battery are discussed here:

http://emagazine.nanoflowcell.com/technology/the-redox-principle/

This flow cell battery doesn’t use rare or hard-to-recycle raw materials and is refueled by adding “bi-ION” aqueous electrolytes that are “neither toxic nor harmful to the environment and neither flammable nor explosive.” Water vapor is the only “exhaust gas” generated by a nanoFlowcell®.

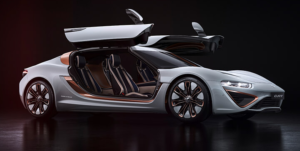
The e-Sportlimousine and the QUANT FE cars successfully demonstrated a high-voltage electric power automotive application of nanoFlowcell® technology.

Since my 2015 post, flow cell batteries have not made significant inroads as an automotive power source, however, the firm now named nanoFlowcell Holdings remains the leader in automotive applications of this battery technology. You can get an update on their current low-voltage (48 volt) automotive flow cell battery technology and two very stylish cars, the QUANT 48VOLT and the QUANTiNO, at the following link:

https://www.nanoflowcell.com

QUANT 48VOLT. Source: nanoFlowcell Holdings.QUANTiNO. Source: nanoFlowcell Holdings.

In contrast to most other electric car manufacturers, nanoFlowcell Holdings has adopted a low voltage (48 volt) electric power system for which it claims the following significant benefits.

“The intrinsic safety of the nanoFlowcell® means its poles can be touched without danger to life and limb. In contrast to conventional lithium-ion battery systems, there is no risk of an electric shock to road users or first responders even in the event of a serious accident. Thermal runaway, as can occur with lithium-ion batteries and lead to the vehicle catching fire, is not structurally possible with a nanoFlowcell® 48VOLT drive. The bi-ION electrolyte liquid – the liquid “fuel” of the nanoFlowcell® – is neither flammable nor explosive. Furthermore, the electrolyte solution is in no way harmful to health or the environment. Even in the worst-case scenario, no danger could possibly arise from either the nanoFlowcell® 48VOLT low-voltage drive or the bi-ION electrolyte solution.”

In comparison, the more conventional lithium-ion battery systems in the Tesla, Nissan Leaf and BMW i3 electric cars typically operate in the 355 – 375 volt range and the Toyota Mirai hydrogen fuel cell electric power system operates at about 650 volts.

In the high-performance QUANT 48VOLT “supercar,” the low-voltage application of flow cell technology delivers extreme performance [560 kW (751 hp), 300 km/h (186 mph) top speed] and commendable range [ >1,000 kilometers (621 miles)]. The car’s four-wheel drive system is comprised of four 140 kW (188 hp), 45-phase, low-voltage motors and has been optimized to minimize the volume and weight of the power system relative to the previous high-voltage systems in the e-Sportlimousine and QUANT FE.

The smaller QUANTiNO is designed as a practical “every day driver.”  You can read about a 2016 road test in Switzerland, which covered 1,167 km (725 miles) without refueling, at the following link:

http://emagazine.nanoflowcell.com/technology/1167-kilometre-test-drive-in-the-quantino/

A version of the QUANTiNO without supercapacitors currently is being tested. In this version, the energy for the electric motors comes directly from the flow cell battery, without any buffer storage in between. These tests are intended to refine the battery management system (BMS) and demonstrate the practicality of an even simpler, but lower performance, 48-volt power system.

Both the QUANT 48VOLT and QUANTiNO were represented at the 2017 Geneva Auto Show.

QUANT 48VOLT (left) and QUANTiNO (right). Source: nanoFlowcell Holdings.

You can read more about these cars at this auto show at the following link:

http://emagazine.nanoflowcell.com/viewpoint/nanoflowcell-at-the-2017-geneva-international-motor-show/

I think the automotive applications of flow cell battery technology look very promising, particularly with the long driving range possible with these batteries, the low environmental impact of the electrolytes, and the inherent safety of the low-voltage power system. I wouldn’t mind having a QUANT 48VOLT or QUANTiNO in my garage, as long as I could refuel at the end of a long trip.

Electrical utility-scale applications of flow cell batteries

In my 4 March 2016 post, “Dispatchable Power from Energy Storage Systems Help Maintain Grid Stability,” I noted that the reason we need dispatchable grid storage systems is because of the proliferation of grid-connected intermittent generators and the need for grid operators to manage grid stability regionally and across the nation. I also noted that battery storage is only one of several technologies available for grid-connected energy storage systems.

Flow cell battery technology has entered the market as a utility-scale energy storage / power system that offers some advantages over more conventional battery storage systems, such as the sodium-sulfur (NaS) battery system offered by Mitsubishi, the lithium-ion battery systems currently dominating this market, offered by GS Yuasa International Ltd. (system supplied by Mitsubishi), LG Chem, Tesla, and others, and the lithium iron phosphate (LiFePO4) battery system being tested in California’s GridSaverTM program. Flow cell battery advantages include:

  • Flow cell batteries have no “memory effect” and are capable of more than 10,000 “charge cycles”. In comparison, the lifetime of lead-acid batteries is about 500 charge cycles and lithium-ion battery lifetime is about 1,000 charge cycles. While a 1,000 charge cycle lifetime may be adequate for automotive applications, this relatively short battery lifetime will require an inordinate number of battery replacements during the operating lifetime of a utility-scale, grid-connected energy storage system.
  • The energy converter (the flow cell) and the energy storage medium (the electrolyte) are separate. The amount of energy stored is not dependent on the size of the battery cell, as it is for conventional battery systems. This allows better storage system scalability and optimization in terms of maximum power output (i.e., MW) vs. energy storage (i.e., MWh).
  • No risk of thermal runaway, as may occur in lithium-ion battery systems

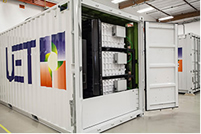
The firm UniEnergy Technologies (UET) offers two modular energy storage systems based on flow cell battery technology: ReFlex and the much larger Uni.System™, which can be applied in utility-scale dispatchable power systems. UET describes the Uni.System™ as follows:

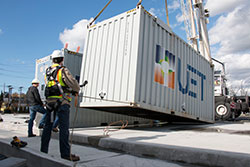
“Each Uni.System™ delivers 600kW power and 2.2MWh maximum energy in a compact footprint of only five 20’ containers. Designed to be modular, multiple Uni.System can be deployed and operated with a density of more than 20 MW per acre, and 40 MW per acre if the containers are double-stacked.”

One Uni.System™ module. Source: UET

You can read more on the Uni.System™ at the following link:

http://www.uetechnologies.com/products/unisystem

The website Global Energy World reported that UET recently installed a 2 MW / 8 MWh vanadium flow battery system at a Snohomish Public Utility District (PUD) substation near Everett, Wash. This installation was one of five different energy storage projects awarded matching grants in 2014 through the state’s Clean Energy Fund. See the short article at the following link:

http://www.globalenergyworld.com/news/29516/Flow_Battery_Based_on_PNNL_Chemistry_Commissioned.htm

Source: Snohomish PUD

Snohomish PUD concurrently is operating a modular, smaller (1 MW / 0.5 MWh) lithium ion battery energy storage installation. The PUD explains:

“The utility is managing its energy storage projects with an Energy Storage Optimizer (ESO), a software platform that runs in its control center and maximizes the economics of its projects by matching energy assets to the most valuable mix of options on a day-ahead, hour-ahead and real-time basis.”

You can read more about these Snohomish PUD energy storage systems at the following link:

http://www.snopud.com/PowerSupply/energystorage.ashx?p=2142

The design of both Snohomish PUD systems are based on the Modular Energy Storage Architecture (MESA), which is described as, “an open, non-proprietary set of specifications and standards developed by an industry consortium of electric utilities and technology suppliers. Through standardization, MESA accelerates interoperability, scalability, safety, quality, availability, and affordability in energy storage components and systems.” You’ll find more information on MESA standards here:

http://mesastandards.org

Application of the MESA standards should permit future system upgrades and module replacements as energy storage technologies mature.

Quadrennial Energy Review

Peter Lobner

On 9 January 2014 the Administration launched a “Quadrennial Energy Review” (QER) to examine “how to modernize the Nation’s energy infrastructure to promote economic competitiveness, energy security, and environmental responsibility…” You can read the Presidential Memorandum establishing the QER at the following link:

https://www.whitehouse.gov/the-press-office/2014/01/09/presidential-memorandum-establishing-quadrennial-energy-review

You can get a good overview of the goals of the QER in a brief factsheet at the following link:

https://www.whitehouse.gov/the-press-office/2015/04/21/fact-sheet-administration-announces-new-agenda-modernize-energy-infrastr

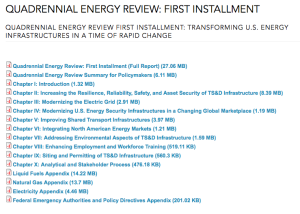
On April 21, 2015, the QER Task Force released the “first installment” of the QER report entitled “Energy Transmission, Storage, and Distribution Infrastructure.” The Task Force announcement stated:

“The first installment (QER 1.1) examines how to modernize our Nation’s energy infrastructure to promote economic competitiveness, energy security, and environmental responsibility, and is focused on energy transmission, storage, and distribution (TS&D), the networks of pipelines, wires, storage, waterways, railroads, and other facilities that form the backbone of our energy system.”

The complete QER 1.1 report or individual chapters are available at the following link:

https://energy.gov/epsa/quadrennial-energy-review-first-installment

QER 1.1 contents are listed below:

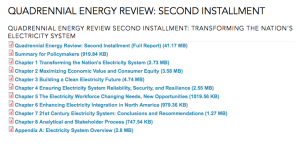
QER 1.1 contentOn January 6, 2017, the QER Task Force released the “second installment” of the QER report entitled “Transforming the Nation’s Electricity System.” The Task Force announcement stated:

“The second installment (QER 1.2) finds the electricity system is a critical and essential national asset, and it is a strategic imperative to protect and enhance the value of the electricity system through modernization and transformation. QER 1.2 analyzes trends and issues confronting the Nation’s electricity sector out to 2040, examining the entire electricity system from generation to end use, and within the context of three overarching national goals: (1) enhance economic competitiveness; (2) promote environmental responsibility; and (3) provide for the Nation’s security.

The report provides 76 recommendations that seek to enable the modernization and transformation of the electricity system. Undertaken in conjunction with state and local governments, policymakers, industry, and other stakeholders, the recommendations provide the building blocks for longer-term, planned changes and activities.”

The complete QER 1.2 report or individual chapters are available at the following link:

https://energy.gov/epsa/quadrennial-energy-review-second-installment

QER 1.2 contents are listed below:

QER 1.2 contentI hope you take time to explore the QERs. I think the Task Force has collected a great deal of actionable information in the two reports. Converting this information into concrete actions will be a matter for the next Administration.

International Energy Agency (IEA) Assesses World Energy Trends

Peter Lobner

The IEA issued two important reports in late 2016, brief overviews of which are provided below.

World Energy Investment 2016 (WEI-2016)

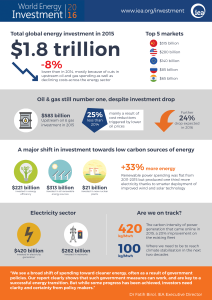
In September 2016, the IEA issued their report, “World Energy Investment 2016,” which, they state, is intended to addresses the following key questions:

  • What was the level of investment in the global energy system in 2015? Which countries attracted the most capital?
  • What fuels and technologies received the most investment and which saw the biggest changes?
  • How is the low fuel price environment affecting spending in upstream oil and gas, renewables and energy efficiency? What does this mean for energy security?
  • Are current investment trends consistent with the transition to a low-carbon energy system?
  • How are technological progress, new business models and key policy drivers such as the Paris Climate Agreement reshaping investment?

The following IEA graphic summarizes key findings in WEI-2016 (click on the graphic to enlarge):

WEI-2016

You can download the Executive Summary of WEI-2016 at the following link:

https://www.iea.org/newsroom/news/2016/september/world-energy-investment-2016.html

At this link, you also can order an individual copy of the complete report for a price (between €80 – €120).

You also can download a slide presentation on WEI 2016 at the following link:

https://csis-prod.s3.amazonaws.com/s3fs-public/event/161025_Laszlo_Varro_Investment_Slides_0.pdf

World Energy Outlook 2016 (WEO-2016)

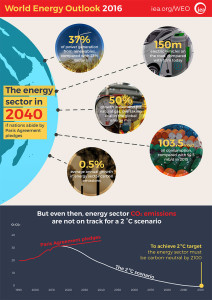
The IEA issued their report, “World Energy Outlook 2016,” in November 2016. The report addresses the expected transformation of the global energy mix through 2040 as nations attempt to meet national commitments made in the Paris Agreement on climate change, which entered into force on 4 November 2016.

You can download the Executive Summary of WEO-2016 at the following link:

https://www.iea.org/newsroom/news/2016/november/world-energy-outlook-2016.html

At this link, you also can order an individual copy of the complete report for a price (between €120 – €180).

The following IEA graphic summarizes key findings in WEO-2016 (click on the graphic to enlarge):

WEO-2016

U.S. Energy Information Administration’s (EIA) Early Release of a Summary of its Annual Energy Outlook (AEO) Provides a Disturbing View of Our Nation’s Energy Future

Peter Lobner

Each year, the EIA issues an Annual Energy Outlook that provides energy industry recent year data and projections for future years. The 2016 AEO includes actual data of 2014 and 2015, and projections to 2040. These data include:

  • Total energy supply and disposition demand
  • Energy consumption by sector and source
  • Energy prices by sector and source
  • Key indicators and consumption by sector (Residential, Commercial, Industrial, Transportation)
  • Electricity supply, disposition, prices and emissions
  • Electricity generating capacity
  • Electricity trade

On 17 May, EIA released a PowerPoint summary of AEO2016 along with the data tables used in this Outlook.   The full version of AEO2016 is scheduled for release on 7 July 2016.

You can download EIA’s Early Release PowerPoint summary and any of the data tables at the following link:

http://www.eia.gov/forecasts/aeo/er/index.cfm

EIA explains that this Summary features two cases: the Reference case and a case excluding implementation of the Clean Power Plan (CPP).

  • Reference case: A business-as-usual trend estimate, given known technology and technological and demographic trends. The Reference case assumes Clean Power Plan (CPP) compliance through mass-based standards (emissions reduction in metric tones of carbon dioxide) modeled using allowances with cooperation across states at the regional level, with all allowance revenues rebated to ratepayers.
  • No CPP case: A business-as-usual trend estimate, but assumes that CPP is not implemented.

You can find a good industry assessment of the AEO2016 Summary on the Global Energy World website at the following link:

http://www.globalenergyworld.com/news/24141/Obama_Administration_s_Electricity_Policies_Follow_the_Failed_European_Model.htm

A related EIA document that is worth reviewing is, Assumptions to the Annual Energy Outlook 2015, which you will find at the following link:

http://www.eia.gov/forecasts/aeo/assumptions/

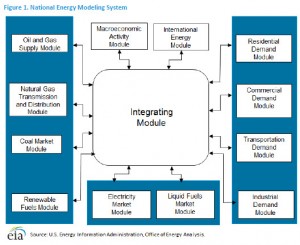
This report presents the major assumptions of the National Energy Modeling System (NEMS) used to generate the projections in AE02015. A 2016 edition of Assumptions is not yet available. The functional organization of NEMS is shown below.

EIA NEMS

The renewable fuels module in NEMS addresses solar (thermal and photovoltaic), wind (on-shore and off-shore), geothermal, biomass, landfill gas, and conventional hydroelectric.

The predominant renewable sources are solar and wind, both of which are intermittent sources of electric power generation. Except for the following statements, the EIA assumptions are silent on the matter of energy storage systems that will be needed to manage electric power quality and grid stability as the projected use of intermittent renewable generators grows.

  • All technologies except for storage, intermittents and distributed generation can be used to meet spinning reserves
  • The representative solar thermal technology assumed for cost estimation is a 100-megawatt central-receiver tower without integrated energy storage
  • Pumped storage hydroelectric, considered a nonrenewable storage medium for fossil and nuclear power, is not included in the supply

In my 4 March 2016 post, “Dispatchable Power from Energy Storage Systems Help Maintain Grid Stability,” I addressed the growing importance of such storage systems as intermittent power generators are added to the grid. In the context of the AEO, the EIA fails to address the need for these costly energy storage systems and they fail to allocate the cost of energy storage systems to the intermittent generators that are the source of the growing demand for the energy storage systems. As a result, the projected price of energy from intermittent renewable generators is unrealistically low in the AEO.

Oddly, NEMS does not include a “Nuclear Fuel Module.” Nuclear power is represented in the Electric Market Module, but receives no credit as a non-carbon producing source of electric power. As I reported in my posts on the Clean Power Plan, the CPP gives utilities no incentives to continue operating nuclear power plants or to build new nuclear power plants (see my 27 November 2015 post, “Is EPA Fudging the Numbers for its Carbon Regulation,” and my 2 July 2015 post, “EPA Clean Power Plan Proposed Rule Does Not Adequately Recognize the Role of Nuclear Power in Greenhouse Gas Reduction.”). With the current and expected future low price of natural gas, nuclear power operators are at a financial disadvantage relative to operators of large central station fossil power plants. This is the driving factor in the industry trend of early retirement of existing nuclear power plants.

The following 6 May 2016 announcement by Exelon highlights the current predicament of a high-performing nuclear power operator:

“Exelon deferred decisions on the future of its Clinton and Quad Cities plants last fall to give policymakers more time to consider energy market and legislative reforms. Since then, energy prices have continued to decline. Despite being two of Exelon’s highest-performing plants, Clinton and Quad Cities have been experiencing significant losses. In the past six years, Clinton and Quad Cities have lost more than $800 million, combined.“

“Exelon announced today that it will need to move forward with the early retirements of its Clinton and Quad Cities nuclear facilities if adequate legislation is not passed during the spring Illinois legislative session, scheduled to end on May 31 and if, for Quad Cities, adequate legislation is not passed and the plant does not clear the upcoming PJM capacity auction later this month.”

“Without these results, Exelon would plan to retire Clinton Power Station in Clinton, Ill., on June 1, 2017, and Quad Cities Generating Station in Cordova, Ill., on June 1, 2018.”

You can read Exelon’s entire announcement at the following link:

http://www.exeloncorp.com/newsroom/exelon-statement-on-early-retirement-of-clinton-and-quad-cities-nuclear-facilities

Together the Clinton and Quad Cities nuclear power plants have a combined Design Electrical Rating of 2,983 MWe from a non-carbon producing source. For the period 2013 – 2015, the U.S. nuclear power industry as a whole had a net capacity factor of 90.41. That means that the nuclear power industry delivered 90.41% of the DER of the aggregate of all U.S. nuclear power plants. The three Exelon plants being considered for early retirement exceeded this industry average performance with the following net capacity factors: Quad Cities 1 @ 101.27; Quad Cities 2 @ 92.68, and Clinton @ 91.26.

For the same 2013 – 2015 period, EIA reported the following net capacity factors for wind (32.96), solar photovoltaic (27.25), and solar thermal (21.25).  Using the EIA capacity factor for wind generators, the largest Siemens D7 wind turbine, which is rated at 7.0 MWe, delivers an average output of about 2.3 MWe. We would need more than 1,200 of these large wind turbines just to make up for the electric power delivered by the Clinton and Quad Cities nuclear power plants. Imagine the stability of that regional grid.

CPP continues subsidies to renewable power generators. In time, the intermittent generators will reduce power quality and destabilize the electric power grid unless industrial-scale energy storage systems are deployed to enable the grid operators to match electricity supply and demand with reliable, dispatchable power.

As a nation, I believe we’re trending toward more costly electricity with lower power quality and reliability.

I hope you share my concerns about this trend.

VBB-3, the World’s Most Powerful Electric Car, will Challenge the Land Speed Record in 2016

Peter Lobner

Updated 2 January 2017

Venturi Buckeye Bullet-3 (VBB-3) is an all-electric, four wheel drive, land speed record (LSR) car that has been designed to exceed 400 mph (643.7 km/h). The organizations involved in this project are:

  • Venturi Automobiles:

This Monaco-based company is a leader in the field of high performance electric vehicles. Read more at the Venturi website at the following link:

http://en.venturi.fr/challenges/world-speed-records

  • Ohio State University (OSU) Center for Automotive Research (CAR):

OSU’s CAR has been engaged in all-electric LSR development and testing since 2000. On 3 October 2004 at the Bonneville Salt Flats in Utah, the original nickel-metal hydride (NiMH) battery-powered Buckeye Bullet reached a top speed of 321.834 mph (517.942 km/h).

In an on-going program known as Mission 01, started in 2009, OSU partnered with Venturi to develop, test, and conduct the land speed record runs of the hydrogen fuel cell-powered VBB-2, the battery-powered VBB-2.5, and the more powerful battery-powered VBB-3.  Read more at the OSU / CAR website at following link:

https://car.osu.edu/search/node/VBB-3

 The Venturi – OSU team’s accomplishments to date are:

  • 2009:  The team’s first world land speed record was achieved on the Bonneville Salt Flats with hydrogen fuel cell-powered VBB-2 at 303 mph (487 km/h).
  •  2010:  The team returned to the salt flats with the 700 hp lithium-ion battery powered VBB-2.5 which set another world record at 307 mph (495 km/h); with a top speed at 320 mph (515 km/h).
  •  2013:  The 3,000 hp lithium iron phosphate battery-powered VBB-3 was unveiled. Due to the flooding of the Bonneville Salt Flats, the FIA and the organizers of the world speed records program cancelled the 2013 competition.
  •  2014Poor track conditions at Bonneville persisted after flooding from a summer storm. Abbreviated test runs by VBB-3 yielded a world record in its category (electric vehicle over 3.5 metric tons) with an average speed of 212 mph (341 km/h) and a top speed of 270 mph (435 km/h).
  •  2015:  Poor track conditions at Bonneville persisted after flooding from a summer storm. Abbreviated test runs by VBB-3 yielded a world record in its category (electric vehicle over 3.5 metric tons) with an average speed of 212 mph (341 km/h) and a top speed of 270 mph (435 km/h).

You will find a comparison of the VBB-2, VBB-2.5 and VBB-3 vehicles at the following link:

http://en.vbb3.venturi.fr/about/the-car

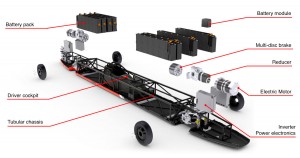
VBB-3 has a 37.2 ft. (11.35 meter) long, slender, space frame chassis that houses eight battery packs with a total of 2,000 cells, two 1,500 hp AC induction motors developed by Venturi for driving the front and rear wheels, a coolant system for the power electronics, disc brakes and a braking parachute, and a small cockpit for the driver. The basic internal arrangement of these components in the VBB-3 chassis is shown in the following diagram.

VBB-3 internalSource: Venturi

You can see a short video of a test drive of VBB-3 without its external skin at the following link:

http://en.vbb3.venturi.fr

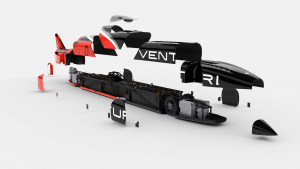
The exterior aerodynamic carbon fiber shell was designed with the aid of the OSU Supercomputer Center to minimize vehicle drag and lift.

VBB-3 skinSource: Venturi

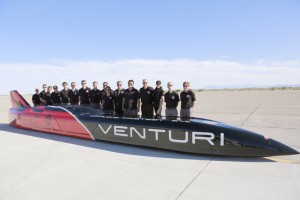
The completed VBB-3 with members of the project team is shown below.

VBB-3 completeSource: Venturi

A good video showing the 2010 VBB-2.5 record run and a 2014 test run of VBB-3 is at the following link:

https://www.youtube.com/watch?v=KLn07Y-t1Xc&ebc=ANyPxKqkVxPKQWnYXzUemRbE5WWlRIJUbaXA-UN6XPNoiDZG1O4NsFq8RE08QlrfdbfkxKmE32MEf5g2Qw0_WQbFXBvKYz9qwg

VBB-3 currently is being prepared in the OSU / CAR workshop in Columbus, Ohio, for another attempt at the land speed record in summer 2016. A team of about 25 engineers and students are planning to be at the Bonneville Salt Flats in summer 2016 with the goal of surpassing 372 mph (600 km/h).

You can subscribe to Venturi new releases on VBB-3 at the following link:

http://en.venturi.fr/news/the-vbb-3-gets-ready

VBB-3 at BonnevilleSource: Venturi

Update 2 January 2017: VBB-3 sets new EV land speed record

On 19 September 2016, VBB-3 set an electric vehicle (Category A Group VIII Class 8) land-speed record of 341.4 mph (549 kph), during a two-way run within one hour on the Bonneville salt flats in Utah. You can read the OSU announcement at the following link:

https://news.osu.edu/news/2016/09/21/ohio-states-all-electric-venturi-buckeye-bullet-3-sets-new-landspeed-record/

You also can watch a short video of VBB-3’s record run at the following link:

https://www.youtube.com/watch?v=rIqT4qLtGcY

Certification of this EV speed record by the Federation Internationale de l’Automobile’s (FIA) is still pending.

The Venturi-OSU team believes VBB-3 has the capability to achieve 435 mph (700 kph) in the right conditions, so we can expect more record attempts in the future.

Dispatchable Power from Energy Storage Systems Help Maintain Grid Stability

Peter Lobner

On 3 March 2015, Mitsubishi Electric Corporation announced the delivery of the world’s largest energy storage system, which has a rated output of 50 MW and a storage capacity of 300 MWh. The battery-based system is installed in Japan at Kyushu Electric Power Company’s Buzen Power Plant as part of a pilot project to demonstrate the use of high-capacity energy storage systems to balance supply and demand on a grid that has significant, weather-dependent (intermittent), renewable power sources (i.e., solar and/or wind turbine generators). This system offers energy-storage and dispatch capabilities similar to those of a pumped hydro facility. You can read the Mitsubishi press release at the following link:

http://www.mitsubishielectric.com/news/2016/pdf/0303-b.pdf

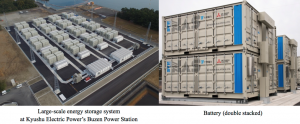
The energy storage system and associated electrical substation installation at Buzen Power Plant are shown below. The energy storage system is comprised of 63 4-module units, where each module contains sodium-sulfur (NaS) batteries with a rated output of 200 kW. The modules are double stacked to reduce the facility’s footprint and cost.

Buzen Power Plant - JapanSource: Mitsubishi

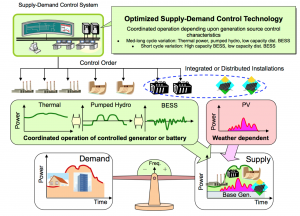
The following simplified diagram shows how the Mitsubishi grid supervisory control and data acquisition (SCADA) system matches supply with variable demand on a grid with three dispatchable energy sources (thermal, pumped hydro and battery storage) and one non-dispatchable (intermittent) energy source (solar photovoltaic, PV). As demand varies through the day, thermal power plants can maneuver (within limits) to meet increasing load demand, supplemented by pumped hydro and battery storage to meet peak demands and to respond to the short-term variability of power from PV generators. A short-term power excess is used to recharge the batteries. Pumped hydro typically is recharged over night, when the system load demand is lower.

Mitsubishi SCADA

Above diagram: Mitsubishi BLEnDer® RE Battery SCADA System (Source: Mitsubishi)

Battery storage is only one of several technologies available for grid-connected energy storage systems. You can read about the many other alternatives in the December 2013 Department of Energy (DOE) report, “Grid Energy Storage”, which you can download at the following link:

http://www.sandia.gov/ess/docs/other/Grid_Energy_Storage_Dec_2013.pdf

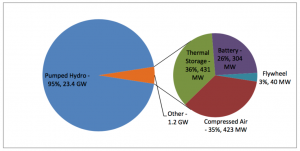
This 2013 report includes the following figure, which shows the rated power of U.S. grid storage projects, including announced projects.

US 2013 grid  storage projectsSource: DOE

As you can see, battery storage systems, such as the Mitsubishi system at Buzen Power Plant, comprise only a small fraction of grid-connected energy storage systems, which currently are dominated in the U.S. by pumped hydro systems. DOE reported that, as of August 2013, there were 202 energy storage systems deployed in the U.S. with a total installed power rating of 24.6 GW. Energy storage capacity (i.e., GWh) was not stated. In contrast, total U.S. installed generating capacity in 2013 was over 1,000 GW, so fully-charged storage systems can support about 2.4% of the nation’s load demand for a short period of time.

Among DOE’s 2013 strategic goals for grid energy storage systems are the following cost goals:

  • Near-term energy storage systems:
    • System capital cost: < $1,750/kW; < $250/kWh
    • Levelized cost: < 20¢ / kWh / cycle
    • System efficiency: > 75%
    • Cycle life: > 4,000 cycles
  • Long-term energy storage systems:
    • System capital cost: < $1,250/kW; < $150/kWh
    • Levelized cost: < 10¢ / kWh / cycle
    • System efficiency: > 80%
    • Cycle life: > 5,000 cycles

Using the DOE near-term cost goals, we can estimate the cost of the energy storage system at the Buzen Power Plant to be in the range from $75 – 87.5 million. DOE estimated that the storage devices contributed 30 – 40% of the cost of an energy storage system.  That becomes a recurring operating cost when the storage devices reach their cycle life limit and need to be replaced.

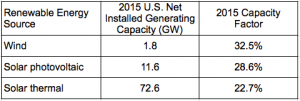
The Energy Information Agency (EIA) defines capacity factor as the ratio of a generator’s actual generation over a specified period of time to its maximum possible generation over that same period of time. EIA reported the following installed generating capacities and capacity factors for U.S. wind and solar generators in 2015:

US renewable power 2015

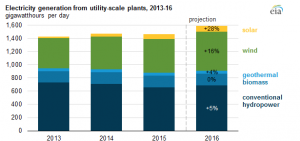
Currently there are 86 GW of intermittent power sources connected to the U.S. grid and that total is growing year-on-year. As shown below, EIA expects 28% growth in solar generation and 16% growth in wind generation in the U.S. in 2016.

Screen Shot 2016-03-03 at 1.22.06 PMSource: EIA

The reason we need dispatchable grid storage systems is because of the proliferation of grid-connected intermittent generators and the need for grid operators to manage grid stability regionally and across the nation.

California’s Renewables Portfolio Standard (RPS) Program has required that utilities procure 33% of their electricity from “eligible renewable energy resources” by 2020. On 7 October 2015, Governor Jerry Brown signed into law a bill (SB 350) that increased this goal to 50% by 2030. There is no concise definition of “eligible renewable energy resources,” but you can get a good understanding of this term in the 2011 California Energy Commission guidebook, “Renewables Portfolio Standard Eligibility – 4th Edition,” which you can download at the following link:

http://www.energy.ca.gov/2010publications/CEC-300-2010-007/CEC-300-2010-007-CMF.PDF

The “eligible renewable energy resources” include solar, wind, and other resources, several of which would not be intermittent generators.

In 2014, the installed capacity of California’s 1,051 in-state power plants (greater than 0.1 megawatts – MW) was 86.9 GW. These plants produced 198,908 GWh of electricity in 2014. An additional 97,735 GWh (about 33%) was imported from out-of-state generators, yielding a 2014 statewide total electricity consumption of almost 300,000 GWh of electricity. By 2030, 50% of total generation is mandated to be from “eligible renewable energy resources,” and a good fraction of those resources will be operating intermittently at average capacity factors in the range from 22 – 33%.

The rates we pay as electric power customers in California already are among the highest in the nation, largely because of the Renewables Portfolio Standard (RPS) Program. With the higher targets for 2030, we soon will be paying even more for the deployment, operation and maintenance of massive new grid-connected storage infrastructure that will be needed to keep the state and regional grids stable.

“Flow cell” Battery Technology Being Tested as an Automotive Power Source

Peter Lobner

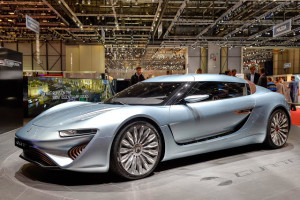
Here’s a great looking new German all-electric car that was introduced at the March 2014 Geneva Auto Show.  It’s a “research” car, not for sale, but an interesting preview of a possible future application of this battery technology in production cars.  The flow cell battery capacity in the e-Sportlimousine is reported to be 120 kWh.  Compare this to current all-electric cars using lithium-ion battery technology: the Tesla Model S has an 85 kWh battery and a Nissan Leaf has a 24 kWh battery.

 Flow-cell battery-powered carImage credit: aetherforce.com

Check out the article on the e-Sportlimousine at the following link, which includes two short videos:

http://aetherforce.com/electric-car-powered-by-salt-water-920-hp-373-milestank/

See many more details on this car and power system at the following nanoFLOWCELL AG YouTube site:

https://www.youtube.com/user/nanoflowcell

A 2014 press release from NanoFLOWCELL AG describes their battery technology and it’s operational use in the e-Sportlimousine, including a description of the power train and how the car is refueled.  See the following link:

http://mediacenter.nanoflowcell.com/mediacenter/press-release/news-detail/2014-03-04-introducing-the-nanoflowcellR/

Regarding the nano-network technology, Wikipedia reports:  “In August 2014, the Quant e-Sportlimousine was approved for testing on public roads using the nanoFLOWCELL® system with a claimed energy or power density of 600 Wh per kilogram (per litre of salt water electrolyte).”

If you are interested in the Tesla lithium-ion battery, check out the Nov 2014, “The Tesla Battery Report”, at the following link:

http://www.advancedautobat.com/industry-reports/2014-Tesla-report/Extract-from-the-Tesla-battery-report.pdf