This article is an update to a similar article I wrote in mid-2015. At that time, California was experiencing a persistent drought and surface water resources and aquifers were being strained by high demand. At that time, there were only five desalination plants operating in California:
Diablo Canyon NPP (seawater) desalination plant in San Luis Obispo county
Cambria Community Services District (brackish water) desalination plant in San Luis Obispo county
Sand City Coastal (brackish seawater) Desalination Plant in Monterey County
WRD Robert W. Goldsworthy Desalter in Torrance
Southern California Edison (seawater) desalination plant on Catalina Island
At that time, several other desalination plants in California were in various stages of development, ranging from construction to reactivation to planning / permitting. This article provides a brief overview of the status of these California plants, and more recent desalination projects in the planning stage in late-2023.
2. California desalination plants in operation in mid-2015
Diablo Canyon nuclear power plant (NPP) desalination plant
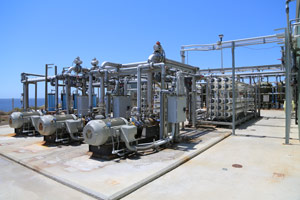
In a 9 June 2015 article, Forbes reported on the Diablo Canyon NPP, located on the Pacific coast near San Luis Obispo, CA, and noted that the plant could meet 100% of its own fresh water needs with an onsite reverse osmosis (RO) + ultrafiltration desalination plant that draws seawater from the ocean. At that time, this was the largest desalinization plant operating on the U.S. West coast. The plant has a maximum fresh water production capacity of 1,500,000 gallons/day (1,681 acre-feet/year).
Diablo Canyon NPP. Source: PGE
Desalination plant at Diablo Canyon NPP. Source: PGE
The Forbes article suggested that the Diablo Canyon NPP would be able to help nearby communities that currently were experiencing water shortages during a persistent drought. With additional modular RO units and a pipeline to connect to the public water system, up to 825,000 gallons/day (925 acre-feet/year) fresh water could be delivered for public consumption.
For more information on the Diablo Canyon NPP desalination plant:
Video, “How Diablo Canyon’s desalination plant works,” originally posted by The Tribune in 2015, reposted by The Tribune on 15 July 2022: https://www.youtube.com/watch?v=LVMmGjLXkQo
Cambria Community Services District desalination plant
Also in San Luis Obispo county, this desalination plant began operating in early 2015, providing 223,000 gallons/day (250 acre-feet/year), about 35% of the town’s fresh water needs. The process itself runs a brackish water (mix of freshwater, estuary water, and highly treated sewage wastewater) through three stages of osmosis, eventually injecting treated water into the San Simeon and Santa Rosa Creek aquifers to supply the community with additional potable water. This project makes Cambria one of the first communities in California to recycle sewage wastewater into an eventual drinking-water source.
For more information on the Cambria Community Services District desalination plant:
Sand City Coastal Desalination Plant in Monterey County was the first full-scale brackish seawater desalination facility in the state of California. It became operational in May 2010 and can produce 268,000 gallons/day (300 acre-feet/year).
For more information on the Sand City Coastal desalination plant:
The Goldsworthy Desalter (https://www.wrd.org/wrd-robert-w-goldsworthy-desalter) is a reverse osmosis system commissioned in 2001, and expanded in 2018, to treat 5,000,000 gallons per day of brackish water drawn from the West Coast Groundwater Basin under the City of Torrance and produce potable water for the city water system. The Desalter produces about 30% of the fresh water used by Torrance residents and businesses. The plant is owned by the Water Replenishment District (WRD) and operated by the City of Torrance.
Southern California Edison (SCE) desalination plant on Catalina Island
SCE’s seawater desalination plant on Catalina Island has operated since the 1990s. It can produce 200,000 gallons/day (224 acre-feet/year). During winter months, the water produced by this desalination plant is enough to meet Avalon’s needs. During the summer, the water demand increases to 400,000-500,000 gallons a day, and up to 800,000 gallons a day on peak weekend days.
A second desalination unit, built in partnership with the city of Avalon and Los Angeles County, became operational on December 2015. The new desalination unit is connected to SCE’s original desalination plant and can produce an additional 150,000 gallons of water a day (168 acre-feet/year).
For more information on the SCE desalination plant on Catalina Island:
3. New desalination capacity in California since 2015
Since mid-2015, two additional desalination plants have been placed in operation in California:
Poseidon Resources Corp. Claude “Bud” Lewis desalination plant, Carlsbad, CA
City of Santa Barbara’s Charles E. Meyer desalination plant
Poseidon Resources Corp. Claude “Bud” Lewis desalination plant, Carlsbad, CA
The Poseidon Resources Corp. seawater desalination plant in Carlsbad, CA, (http://carlsbaddesal.com) was completed in November 2015. It was officially dedicated and renamed in honor of former Carlsbad Mayor, Claude “Bud” Lewis, on 14 December 2015, in a public ceremony attended by more than 600 elected officials, community leaders and project partners. A 30-year Water Purchase Agreement is in place between the San Diego County Water Authority and Poseidon Water for the entire output of the plant, which has a design capacity of 50,000,000 gallons/day (56,050 acre-feet/year). This plant is providing about 10% of San Diego county’s fresh water needs. It currently is the largest sea water desalination plant in the western hemisphere.
Claude “Bud” Lewis desalination plant in Carlsbad, CA. Source: screenshot from Dudek video, 2021
For more information on the Claude “Bud” Lewis desalination plant, Carlsbad, CA
City of Santa Barbara’s Charles E. Meyer desalination plant
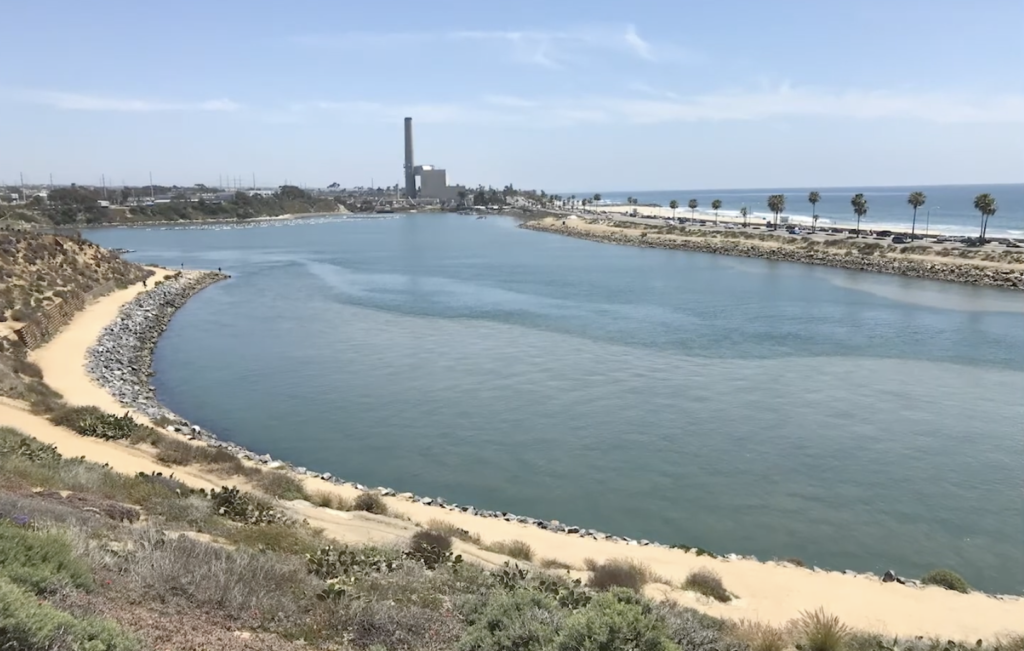
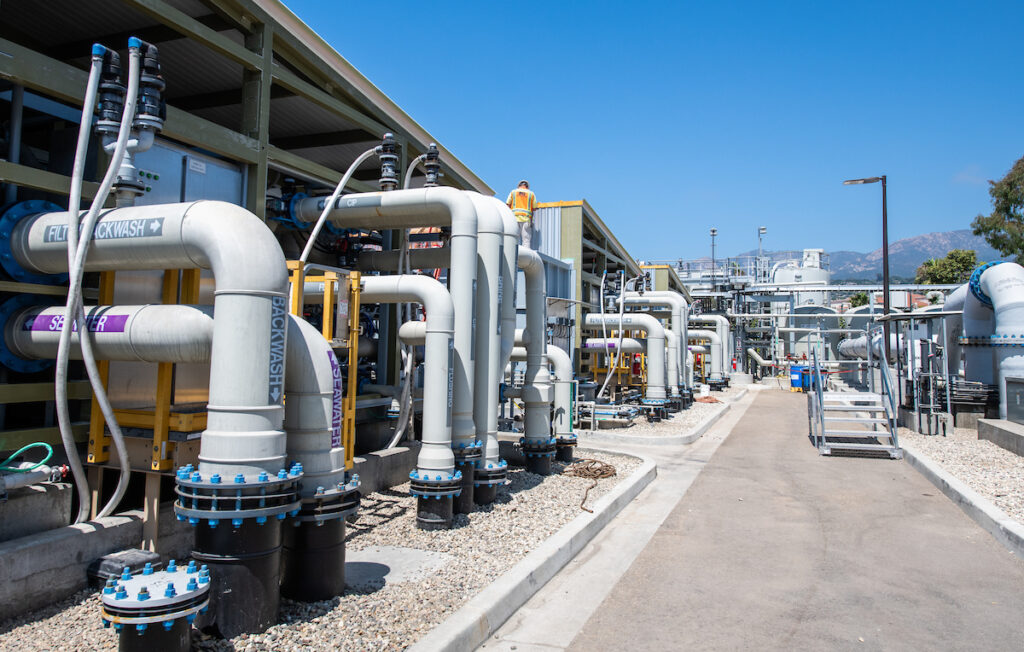
The city-owned Charles E. Meyer desalination plant in Santa Barbara (https://www.countyofsb.org/2401/Desalination) was completed in 1992 and then mothballed after a short test period. In July 2015, the City Council voted unanimously to reactivate this plant, which has a licensed capacity is 6,691,0000 gallons/day (7,500 acre-feet/year) and can meet about 30% of the city’s fresh water needs. In May 2017, the startup testing at the plant was completed and the City started distributing desalinated water into the City’s water system.
Charles E. Meyer Desalination Plant in Santa Barbara, 2019. Source: Florence Low / California Department of Water Resources
For more information on the Charles E. Meyer desalination plant:
4. Other desalination projects planned in California in mid-2015
In mid-2015, several other desalination projects were in the planning stage, including:
Doheny Ocean desalination project in south Orange County
California American Water (Cal-Am) desalination project in Marina, CA
Poseidon Resources Corp. desalination project in Huntington Beach
Deepwater Desal project at Moss Landing
Since then, some have advanced while others have been withdrawn. Here’s a brief summary of their current status.
Doheny Ocean Desalination Project in south Orange County – approved, under construction
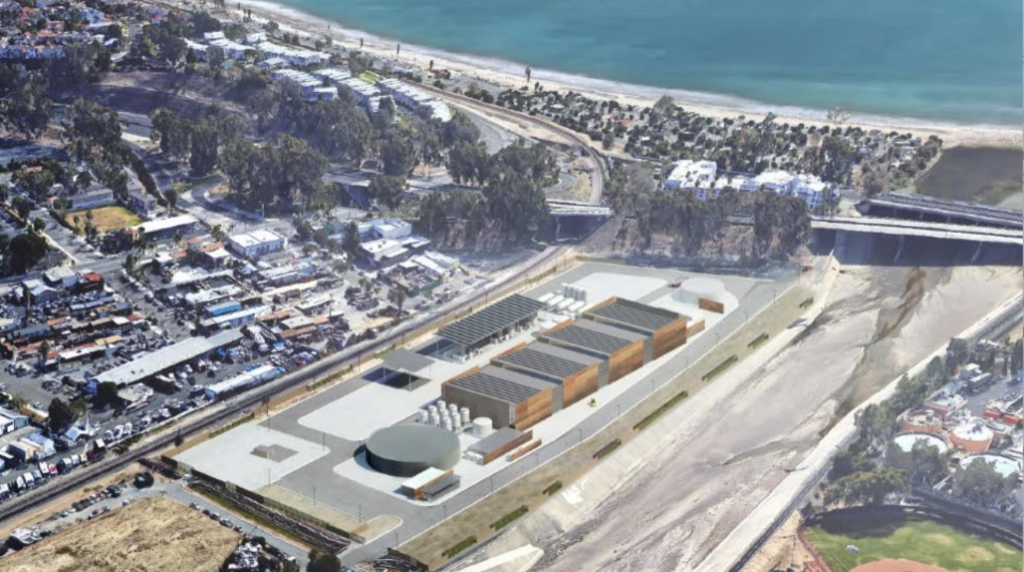
This coastal seawater desalination plant has a design capacity of 15,000,000 gallons/day (16,816 acre-feet/year). The project was unanimously approved by the California Coastal Commission in September 2022. The completion date has slipped from 2020 (original estimate in 2015) to late 2028 or early 2029.
Artist’s rendering of the desalination plant proposed for Doheny Beach. Source: South Coast Water District
For more information on the Doheny Ocean Desalination Project
California American Water (Cal-Am) desalination project in Marina, CA – approved, pre-construction
This seawater distillation plant project was approved by the California Coastal Commission on 17 November 2022 at a capacity of 4,800,000 gallons/day (5,380 acre-feet/year). Cal-Am (https://www.amwater.com/caaw/) plans to have the plant operating by the end of 2027.
For more information on the Cal-Am Marina desalination project:
Poseidon Resources Corp. seawater desalination project, Huntington Beach, CA – withdrawn
This project was in the final phase of permitting and originally was expected to be completed in 2018, with a capacity of 50,000,000 gallons/day. The project was withdrawn in February 2023.
For more information on the Huntington Beach desalination project:
DeepWater Desal project at Moss Landing – withdrawn
DeepWater Desal (https://www.deepwaterdesal.com) originally proposed to build a 8,922,000 gallons/day (10,000 acre-feet/year) seawater desalination plant that would draw water from the Pacific Ocean through an existing underwater pipeline that, in the 1940s, was used to move diesel oil from offshore ships to what is now the gas-fired Dynegy Power Plant. The pipeline has been unused for decades. On 4 June 2021, the National Oceanographic and Atmospheric Administration (NOAA) announced that it was terminating the NEPA process and closing the Project’s permit application because the permit applicant (DeepWater Desal) notified NOAA in May 2020 that the primary scope of the Project changed from desalination to land-based aquaculture.
For more information on the DeepWater Desal project:
The People’s Moss Landing Desalination Project – no significant progress
In 2013, the Moss Landing Commercial Business park, LLC proposed to build a 11,950,0000 gallons/day (13,400 acre-feet/year) saltwater desalination plant using an existing subsurface harbor water intake and pumping station built by Henry Kaiser in the 1950s. A Notice of Preparation of a Draft EIR was filed in June 2015. However, in 2023, it appears that the project is not moving forward.
For more information on the People’s Moss Landing Desal project:
Armstrong Ranch brackish water desalination plant, Marina Coast, CA – no significant progress
Seawater intrusion into the aquifer underlying the Marina Coast area is aggravated by extensive groundwater pumping for local agriculture and residents in marina and Fort Ord. The Armstrong Ranch property, which occupies both sides of Highway 1, sits atop aquifers that are impacted by seawater intrusion. A deep aquifer of clean fresh water underlying the area also is being heavily pumped.
A brackish water desalination plant was proposed for Armstrong Ranch, with a design capacity of 2,409,000 gallons/day (2,700 acre-feet/year). One proposal suggested that 150 acres of the Armstrong Ranch parcel could host enough solar panels to both power the desalination plant and sell back surplus power to the grid.
It appears that there has been no significant action in developing this desalination plant.
For more information on the Armstrong Ranch / Marina Coast desal project:
Water Replenishment District (WRD) of Southern California Construction Project: In Los Angeles County, a project in the City of Torrance will construct a conveyance pipeline to connect an existing well to the existing WRD Robert W. Goldsworthy Desalter system and install a self-cleaning auto-strainer. The project will reduce the community’s reliance on imported water, provide a sustainable local potable water supply, and increase desalinated water production by 1,070,667 gallons/day (1,120-acre feet per year) or approximately enough water for 2,200 households.
Westlands Water District Design Pilot Project: In Fresno County, the project will desalinate brackish groundwater from the westside upper aquifer and use salt-tolerant plants to remove salts from the brine. The project will provide cost-effective, reliable and high-quality water to the district and the communities of Coalinga, Huron and Avenal.
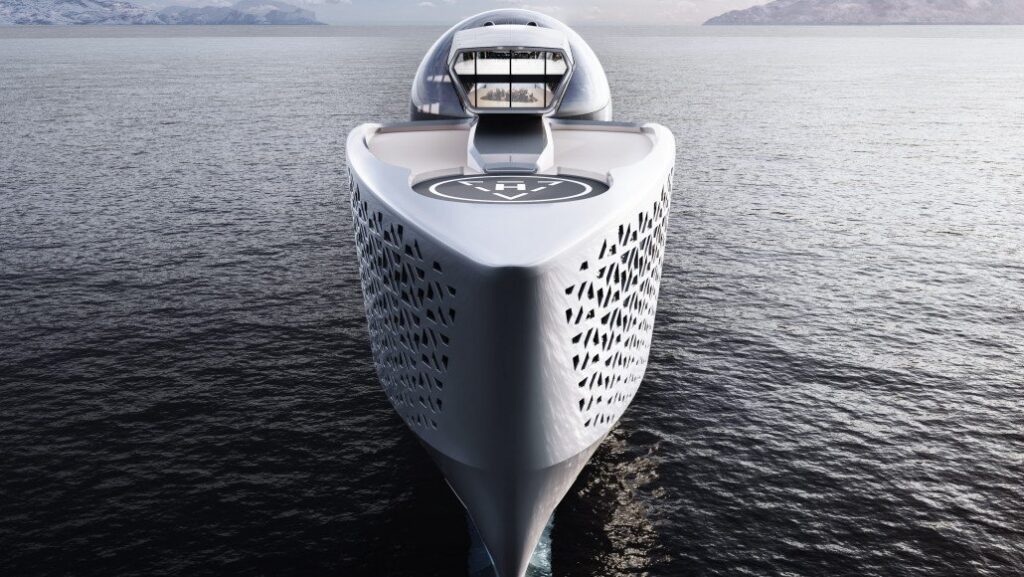
City of Fort Bragg Design Pilot Project: Near the City of Fort Bragg, the project will install an innovative, wave-powered, seawater desalination iceberg buoy to provide potable water to residents. The project will diversify the city’s water supply portfolio, create a locally controlled, sustainable, and carbon-free potable water supply, produce water without grid electricity, and strengthen water resiliency during future droughts.
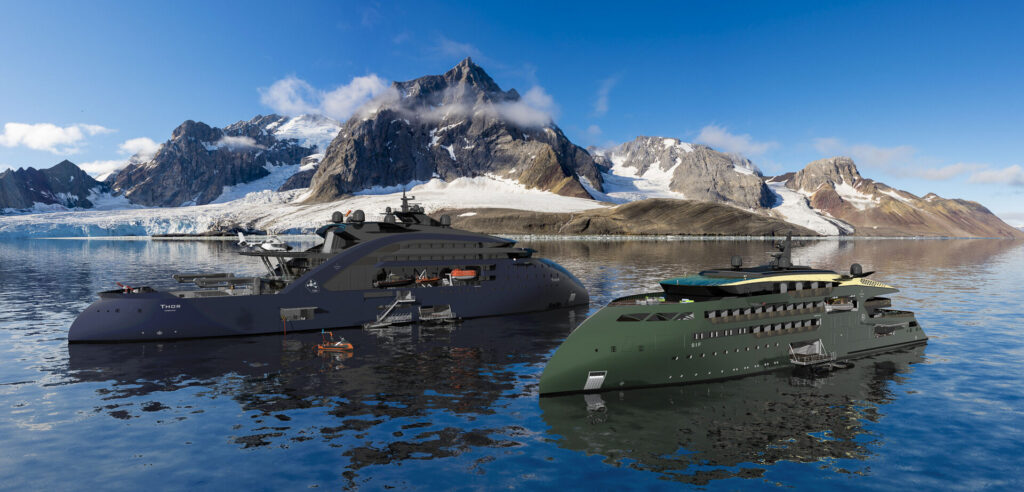
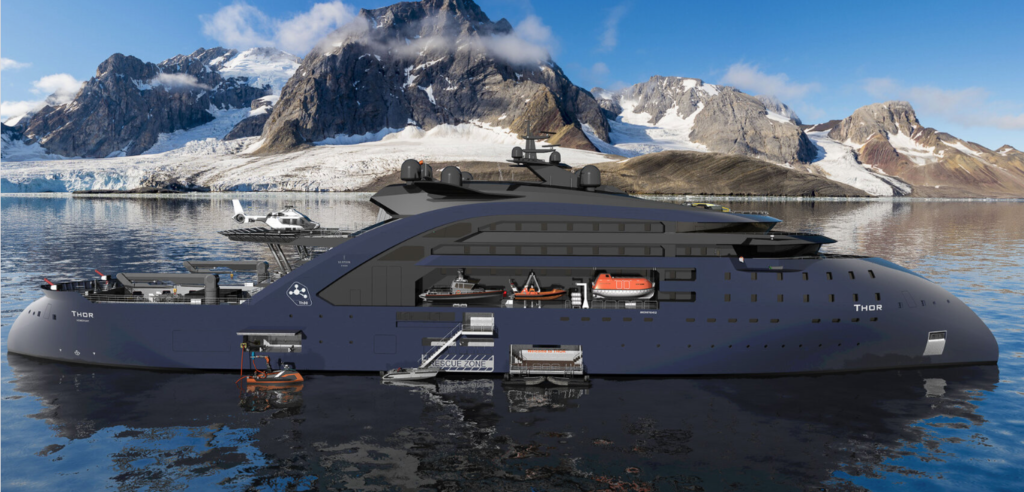
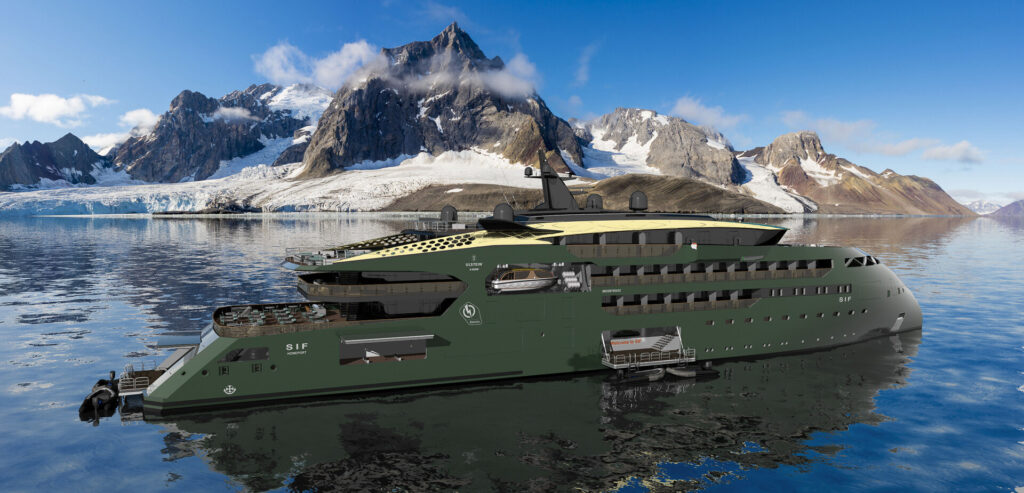
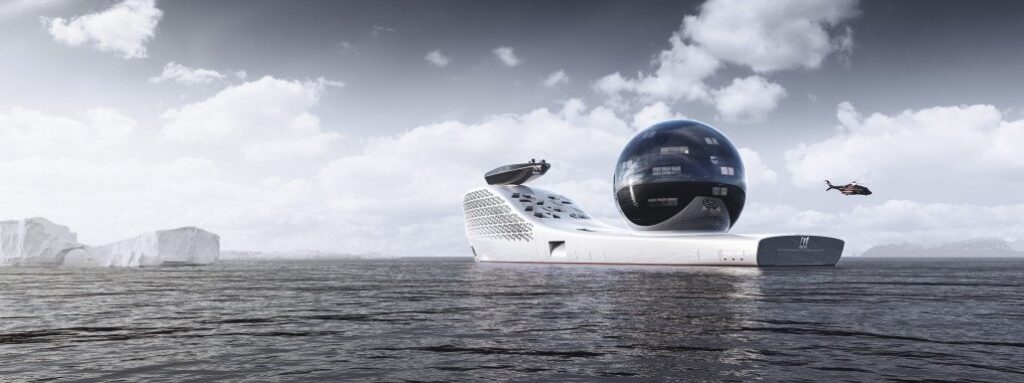
In June 2022, the Norwegian firm Ulstein (https://ulstein.com) announced their conceptual design of a Replenishment, Research and Rescue (3R) vessel named Thor that will be powered by a thorium molten salt reactor (MSR). This vessel can function as a seaborne mobile charging station for a small fleet of electrically-powered expedition / cruise ships that are designed to operate in environmentally sensitive areas such as the Arctic and Antarctic. Other environmentally sensitive areas include the West Norwegian Fjords, which are UNESCO World Heritage sites that will be closed in 2026 to all ships that are not zero-emission. In the future, similar regulations could be in place to protect other environmentally sensitive regions of the world, thereby reinforcing Ulstein’s business case behind Thor and its all-electric companion vessels.
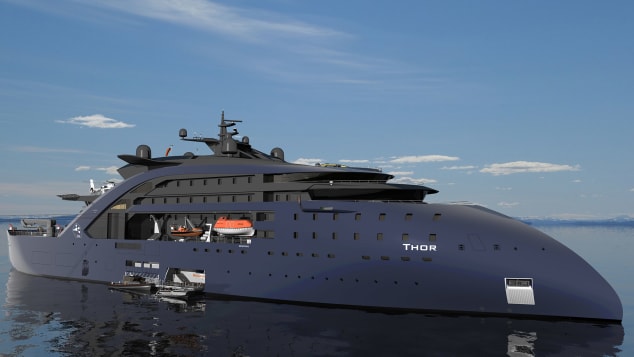
Thor is a 149-meter (500-foot) long, zero-emission, nuclear-powered vessel that features Ulstein’s striking, backwards-sloping X-bow, which is claimed to result in a smoother ride, higher speed while using less energy, and less mechanical wear than a ship with a conventional bow.
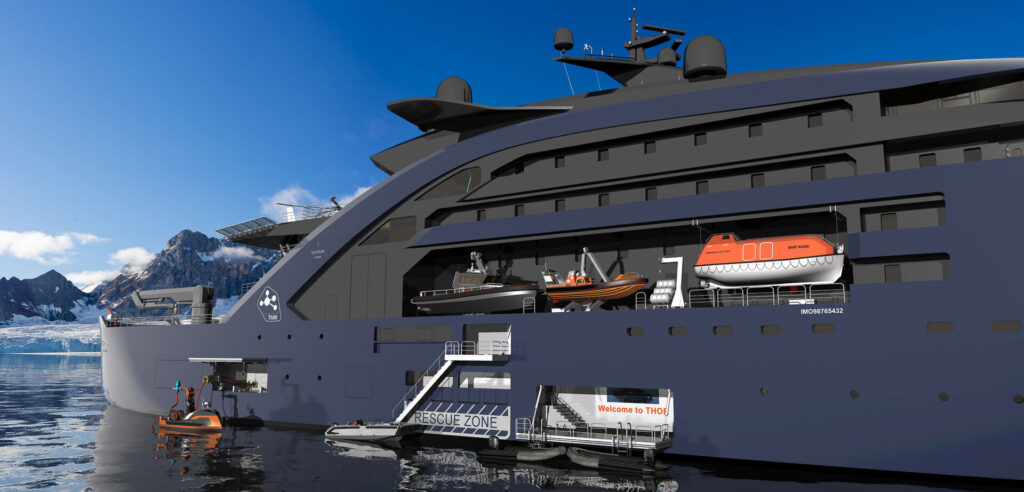
For its R3 mission, Thor would be outfitted with work boats, cranes, a helicopter landing pad, unmanned aerial vehicles (UAVs), unmanned surface vessels, firefighting equipment, rescue booms, a lecture hall and laboratories.
As a charging station, Thor would be sized to recharge four all-electric vessels simultaneously.
Thor. Source: Ulstein
Thor also could serve as a floating power station, replacing diesel power barges in some developing countries or in some disaster areas while the local electric power infrastructure is being repaired.
Ulstein projects that an operational Thor vessel could be launched in “10 to 15 years.” However, the development and licensing of a marine MSR is on the critical path for that schedule.
Thor, starboard side views. Source, both graphics: Ulstein
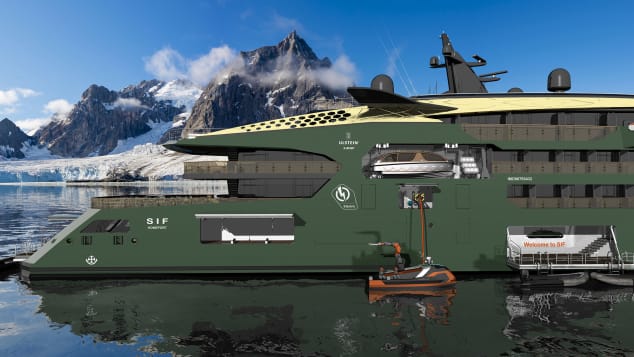
3. The all-electric Sif expedition / cruise ship
Sif, named after the goddess who was Thor’s wife, is a design concept for a 100-meter (330-foot) long, all-electric, zero-emission expedition / cruise ship designed to operate with minimal impact in environmentally sensitive areas. The ship will be powered by a new generation of solid batteries that are expected to offer greater capacity and resistance to fire than lithium-ion batteries used commonly today. It will be periodically recharged at sea by Thor.
The ship can accommodate 80 passengers and 80 crew.
Sif, starboard side view. Source, both graphics: Ulstein
4. A marine MSR power plant
The pressurized water reactor (PWR) is the predominant marine nuclear power plant in use today, primarily in military vessels, but also in Russian icebreakers and a floating nuclear power plant in the Russian Arctic.
Ulstein reported that it has been exploring MSR technology because of its favorable operating and safety characteristics. For example, an MSR operates at atmospheric pressure (unlike a PWR) and passive features and systems maintain safety in an emergency. If the core overheats, the molten salt fuel/coolant mixture automatically drains out of the reactor and into a containment vessel where it safely solidifies and can be reused. You’ll find a good overview of MSR technology here: https://whatisnuclear.com/msr.html
While a few experimental MSRs have operated in the past, no MSR has been subject to a commercial nuclear licensing review, even for a land-based application. Ulstein favors a thorium-fueled MSR. The thorium-uranium-233 fuel cycle introduces additional technical and nuclear licensing uncertainties because of the lack of operational and nuclear regulatory precedents.
Several firms are developing MSR concepts. However, the combination of a marine MSR and a thorium fuel cycle remains elusive. Two uranium-fueled marine MSR design concepts are described below.
Seaborg Technologies
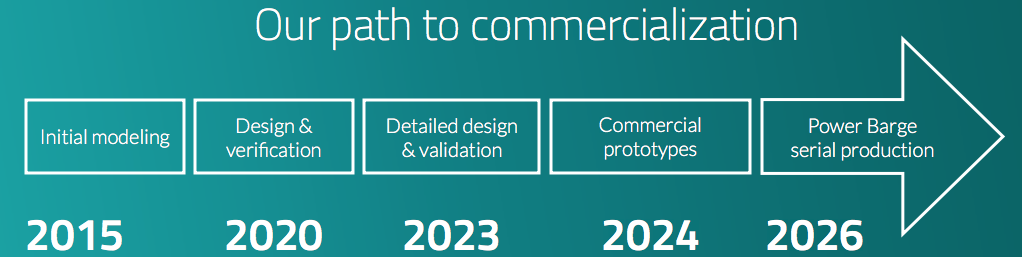
The Danish firm Seaborg Technologies (https://www.seaborg.com), founded in 2014, is developing a compact MSR (CMSR) with a rating of about 250 MWt / 100 MWe for use in power barges (floating nuclear power plants) of their own design (see my 16 May 2021 post). The thermal-spectrum CMSR uses uranium-235 fuel in a molten proprietary salt, with a separate sodium hydroxide (NaOH) moderator.
A Seaborg Technologies CMSR module could generate100 MWe. Dump tank shown below reactor. Source: Seaborg via NEI (2022)
Seaborg’s development time line calls for a commercial CMSR prototype to be built in 2024, with commercial production of power barges beginning in 2026.
Source: Seaborg (2022)
In April 2022, Seaborg and the Korean shipbuilding firm Samsung Heavy Industries signed a partnership agreement for manufacturing and selling turnkey CMSR power barges.
On 10 June 2022, Seaborg was selected by the European Innovation Council to receive a significant (potentially up to €17.5 million) innovation grant to help accelerate their work on the CMSR.
CORE-POWER and the Southern Company consortium
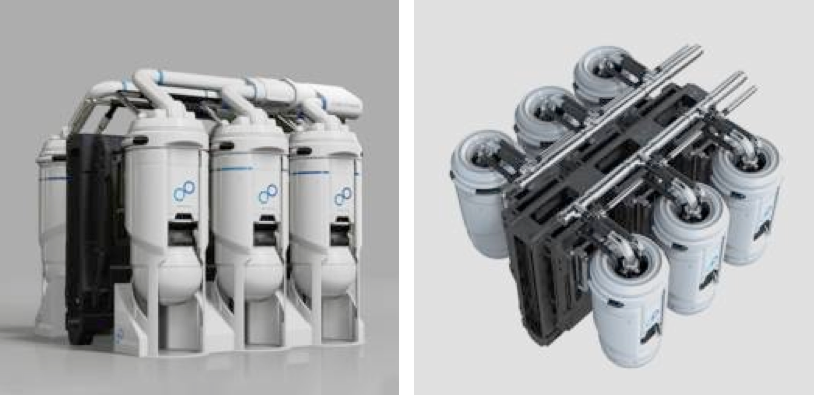
The UK firm CORE-POWER Ltd. (https://corepower.energy), founded in 2018, began with a concept for a compact uranium-235 fueled, molten chloride salt reactor named the m-MSR for marine applications. This modular, inherently safe, 15 MWe micro-reactor system was designed as a zero-carbon replacement power source for the fossil-fueled power plants in many existing commercial marine vessels. It also was intended for use as the original power source for new vessels, as proposed for the Earth 300 Eco-Yacht design concept unveiled by entrepreneur Aaron Olivera in April 2021 (see my 17 April 2021 post). The power output of a modular CORE-POWER m-MSR installation could be scaled to meet operational needs by adding reactor modules in compact arrangements suitable for shipboard installation.
A set of six small, compact CORE-POWER m-MSR modules could generate90 MWe. Dump tank not shown. Source: CORE-POWER
In November 2020, CORE-POWER announced that it had joined an international consortium to develop MSRs. This team includes the US nuclear utility company Southern Company (https://www.southerncompany.com), US small modular reactor developer TerraPower (https://www.terrapower.com) and nuclear technology company Orano USA (https://www.orano.group/usa/en). In the consortium, TerraPower is responsible for the fast-spectrum Molten Chloride Fast Reactor (MCFR). CORE-POWER is responsible for maritime readiness and regulatory approvals.
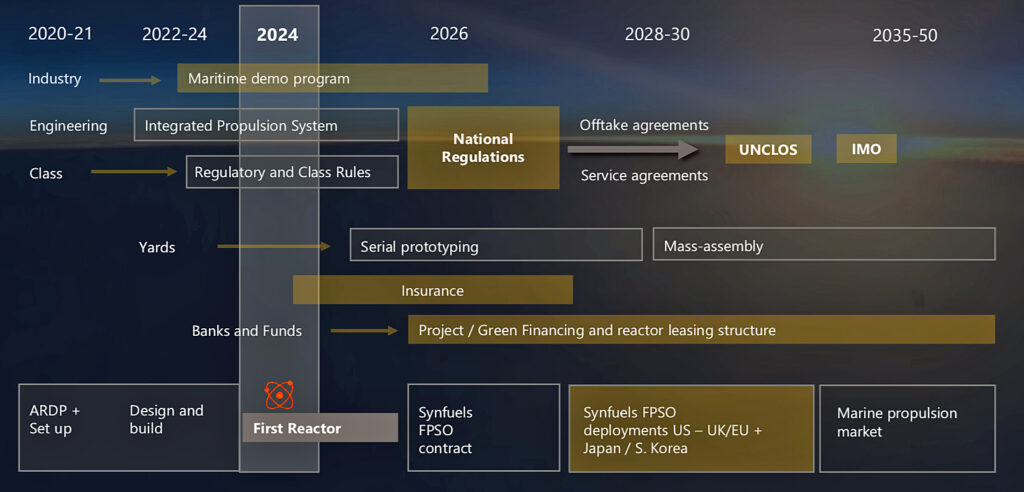
This consortium applied to the US Department of Energy (DOE) to participate in cost-share risk reduction awards under the Advanced Reactor Demonstration Program (ARDP), to develop a prototype MCFR as a proof-of-concept for a medium-scale commercial-grade reactor. In December 2020, the consortium was awarded $90.4 million, with the goal of demonstrating the first MCFR in 2024. DOE reported, “They expect to begin testing in a $20 million integrated effects test facility starting in 2022. The team has successfully scaled up the salt manufacturing process to enable immediate testing. Data generated from the test facility will be used to validate thermal hydraulics and safety analysis codes for licensing of the reactor.”In February 2021, CORE-POWER presented the MCFR development schedule in the following chart, which shows the MCFR becoming available for deployment in marine propulsion in about 2035. This is within the 10 to 15 year timescale projected by Ulstein for their first Thor vessel.
Source: CORE-POWER (2021)
5. In conclusion
A seaborne nuclear-powered “charging station” supporting a small fleet of all-electric marine vessels provides a zero-carbon solution for operating in protected, environmentally sensitive areas that otherwise would be off limits to visitors. Ulstein’s concept for the MSR-powered Thor R3 vessel and the Sif companion vessel is a clever approach for implementing that strategy.
It appears that a uranium-fueled marine MSR could be commercially available in the 10 to 15 year time frame Ulstein projects for deploying Thor and Sif. The technical and nuclear regulatory uncertainties associated with a thorium-fueled marine MSR will require a considerably longer time frame.
“’Thor’ – a Thorium Molten Salt Reactor ship design by Ulstein for Replenishment, Research and Rescue,” (2:16 min), Ulstein, 26 April 2022: https://www.youtube.com/watch?v=IBRVb0-0kAw
Goodbye Indian Point 2 and 3. Your contributions of zero-carbon energy to New York’s “clean energy grid of the future” will be greatly missed.
In an average year, the 1,028-MWe Indian Point Unit 2 nuclear power plant and the 1,041-MWe Unit 3 operated at capacity factors of greater than 90% and delivered more than 18,000 GWh (thousand MWh) per year of zero-carbon electricity to the New York state electrical grid. Unit 2 was shutdown on 30 April 2020 and Unit 3 followed on 30 April 2021. Prior to its final shutdown, Unit 3 had run continuously for 753 day, which set a new nuclear industry world record. The ANS Newswire reported, “The plant’s closure is the result of a settlement agreement reached in 2017 by Entergy and the State of New York and environmental groups opposed to Indian Point’s operation. According to an April 28 (2021) news release from Entergy, its decision to accede to the shutdown was driven by a number of factors, including ‘sustained low current and projected wholesale energy prices that reduced revenues.’”
Now, Indian Point Units 2 and 3 are delivering exactly zero zero-carbon energy. I imagine the environmental groups involved in the settlement agreement are hailing the shutdowns as great achievements. I think the shutdowns represent remarkable shortsightedness (I’m using the kindest words I can think of) on the parts of Entergy and the State of New York.
New York Independent System Operator, Inc. (NYISO) operates the New York state electrical grid, which is divided into two main parts, “downstate”, which includes New York City and the Indian Point Units 2 and 3 nuclear power plants, and “upstate,” which includes the Nine Mile Point and Ginna nuclear power plants. I credit NYISO with providing the public with excellent reports that summarize their annual grid and electrical market performance. In their Power Trends 2021 report, NYISO states: “The NYISO is committed to offering the tools, skills, independent perspectives, and experience necessary to transition to a zero-emission power system by 2040.”
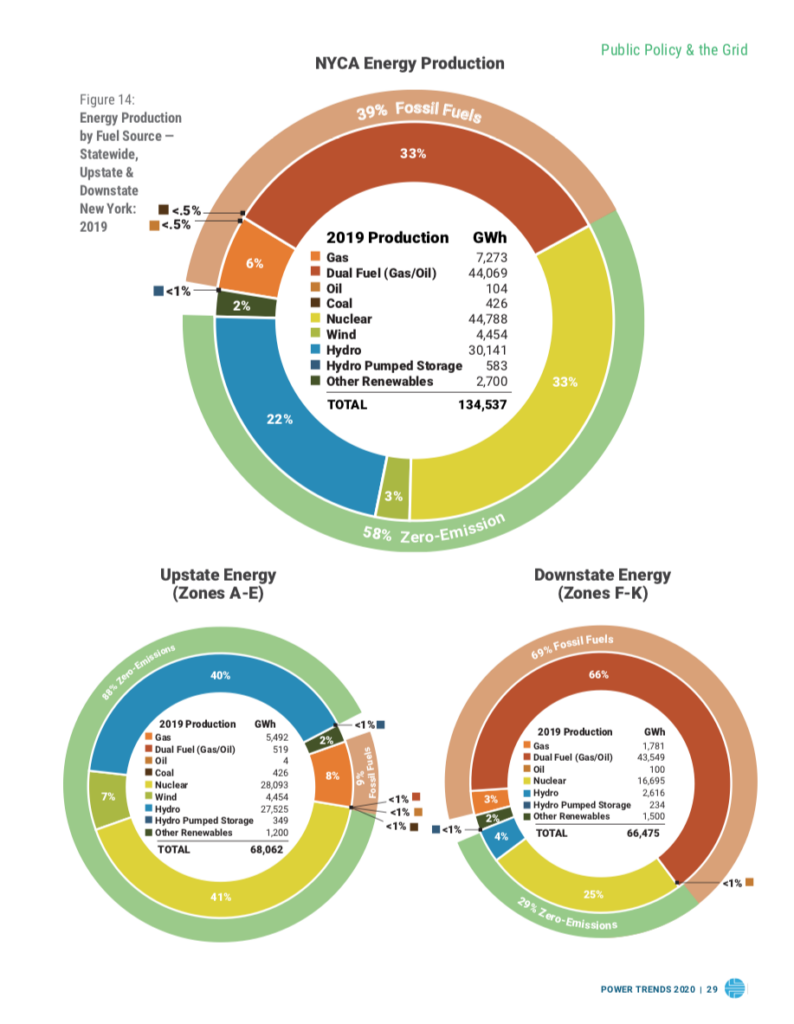
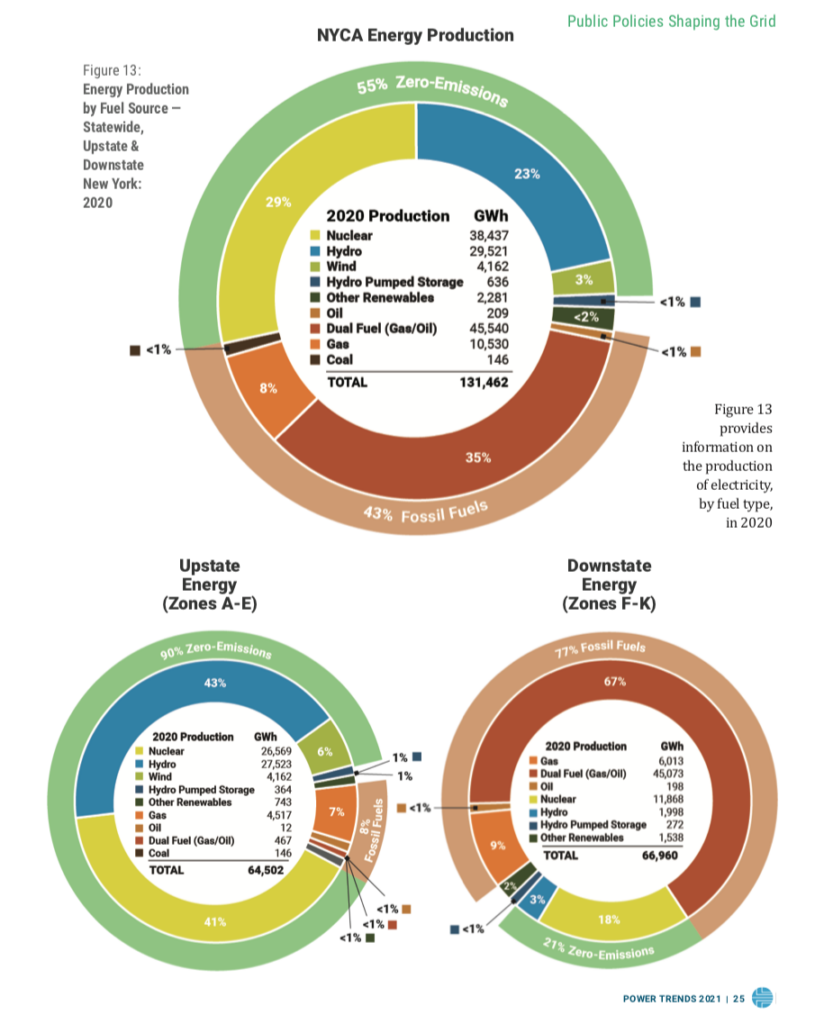
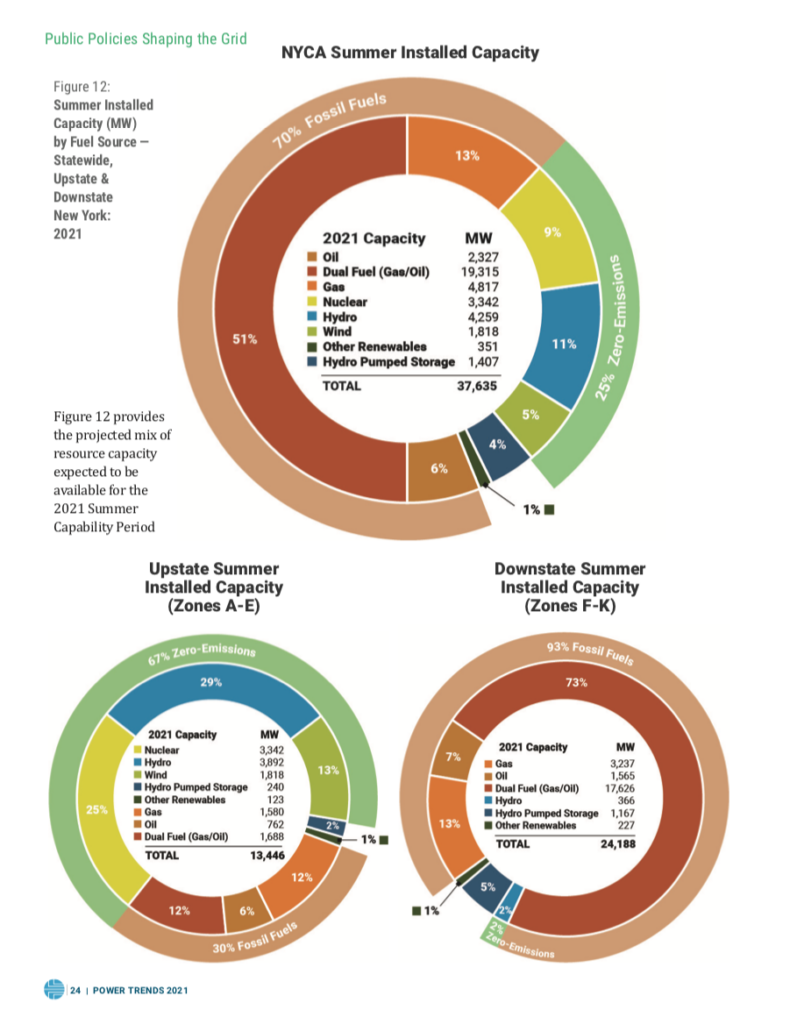
I’ll refer to two of those NYISO Power Trend reports to illustrate the impact of closing the Indian Point 2 and 3 nuclear power plants on progress toward New York’s “clean energy grid of the future.” Using their own graphics, let’s take a look at how NYISO was doing in 2019 (with both Indian Point Unit 2 & 3 operating), 2020 (Unit 2 shutdown in April), and their projected performance in summer 2021 (after Unit 3 shutdown).
2019: New York statewide: 58% zero-emission; Upstate: 88% zero-emission; Downstate: 29% zero-emission
Source: NYISO Power Trends 2020
2020: New York statewide: 55% zero-emission; Upstate: 90% zero-emission; Downstate: 21% zero-emission
Source: NYISO Power Trends 2021
2021: New York statewide (projected, summer): 25% zero-emission; Upstate: 67% zero-emission; Downstate: 2% zero-emission
Source: NYISO Power Trends 2021
Anyone who can draw a tend chart from 2019 to 2021 using the above three years of data and then extrapolate to the State’s goal of a zero-emission power system by 2040 can see that New York’s plans for its “clean energy grid of the future” have come off the rails. The slope of the curve to get from where NYISO is today to the State’s 2040 goal has gotten a lot steeper, and that translates directly into the cost of achieving that goal. Surely the New York ratepayers served by NYISO will pay the price in the years ahead as the State works to improve its zero-emission performance. Even getting back to where they were in 2019 would be a big improvement.
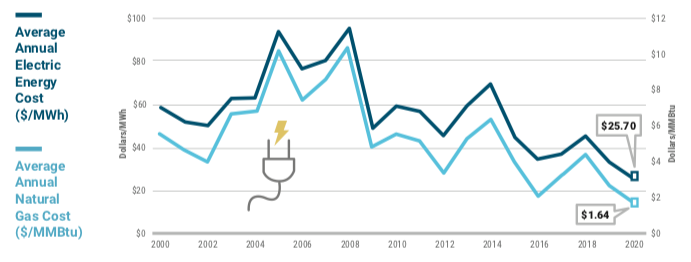
So, I reiterate that the Indian Point Unit 2 and 3 shutdowns represent remarkable shortsightedness on the parts of Entergy and the State of New York, both of which have undervalued two reliable sources of bulk zero-emission electric power generation, and have failed to appreciate Indian Point’s potential long-term contribution to achieving the State’s 2040 zero-emission power system goal (at a rate of more than 18,000 GWh per year). New York State has failed to step up and provide economic incentives to enable Entergy to compete effectively against fossil fuel generators that have been benefiting for more than a decade from the low cost of natural gas fuel. In the wholesale market, the fossil generators can undercut nuclear generators and drive the cost of electricity down to levels that no longer support the continued operation of zero-emission nuclear power plants. These trends can be seen in the following NYISO chart.
Source: NYISO Power Trends 2021
Beyond the significant loss of zero-carbon electrical generation capacity, the closure of a nuclear power plant will have significant local and statewide impacts through the loss of many full-time and temporary jobs, associated wages, and income and property taxes. You’ll find a thorough discussion of these issues in the May 2021 ANS Nuclear Newswire article, “The consequences of closure: The local cost of shutting down a nuclear power plant,” at the following link: https://www.ans.org/news/article-2877/the-consequences-of-closure-the-local-cost-of-shutting-down-a-nuclear-power-plant/
R.I.P. Indian Point Units 2 and 3.
Update – 29 July 2022
In July 2022, the American Nuclear Society reported, “Stats show that closing Indian Point was a ‘mistake’ for New York.” I’d say that’s putting it mildly.
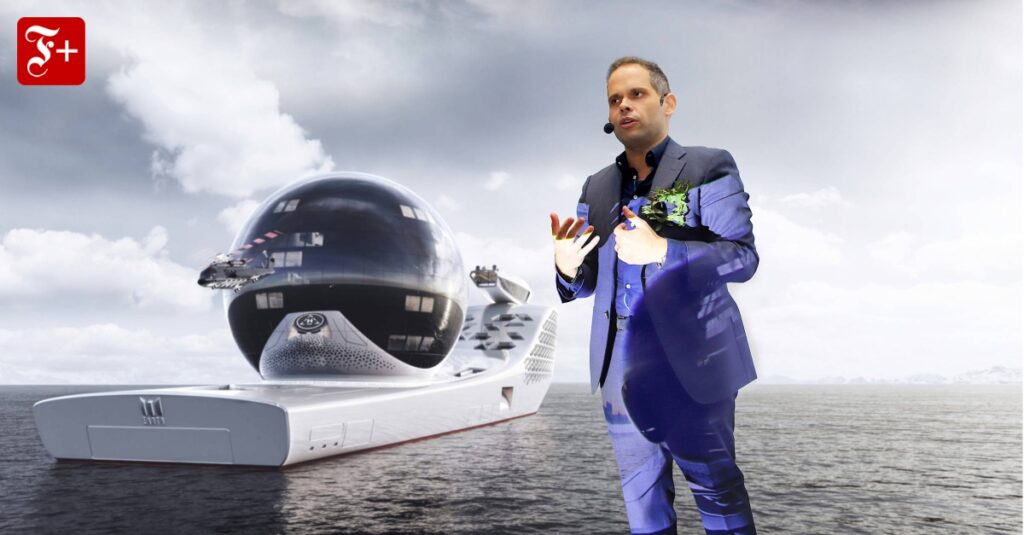
In early April 2021, a flurry of articles described the beautiful, futuristic, nuclear-powered eco-yacht conceived by entrepreneur Aaron Olivera, CEO of Earth 300 (https://earth300.com), and introduced in Singapore as his concept for a signature vessel for conducting environmental research and raising environmental awareness around the world.
Aaron Olivera and the Earth 300 eco-yacht. Source: Archyde.com
This sleek yacht is almost 300 meters long with a prominent cantilevered observation deck near the bow and a 13-story glass “science sphere” amidships. Olivera describes this vessel as follows:
“Earth 300 it is an extreme technology platform for science, exploration and innovation at sea. Its mission is to ring the ecological alarm on a global scale and combat climate change. Using technology it will quickly scale and deploy solutions to market. Its ultimate ambition is to inspire billions of people to contribute to the preservation of our shared planet, and becoming a sustainable and future worthy civilization.”
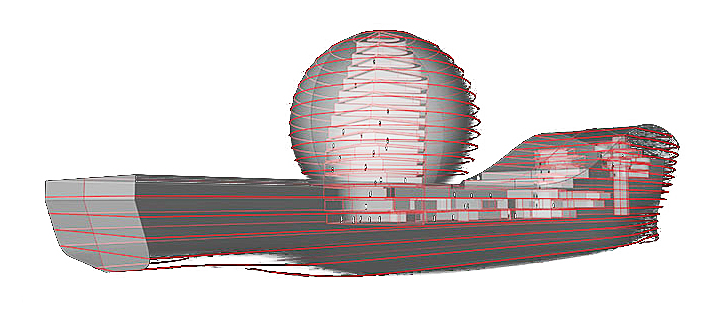
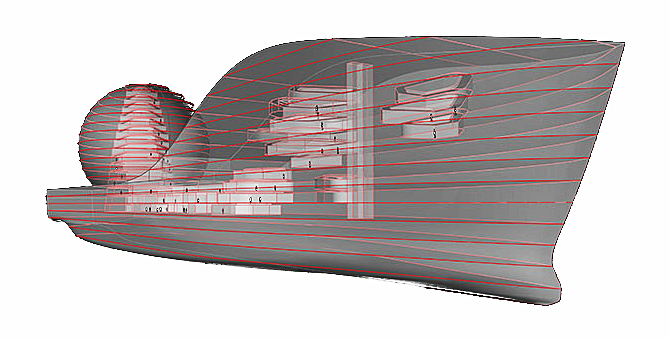
The ship’s design was developed by Ivan Salas Jefferson, founder of Iddes Yachts (https://iddesyachts.com), in collaboration with the Polish naval architecture firm NED (https://www.ned-project.eu). Mikal Bøe is the CEO of London-based Core Power (https://corepower.energy), which will supply the next-generation, inherently safe marine molten salt reactor (m-MSR) power plant, using MSR technology developed by the US nuclear company TerraPower (https://www.terrapower.com) that was co-founded by Bill Gates.
The general arrangement of the ship’s inhabited spaces. Source: Earth 300
The current design has taken six years and $5 million to develop. Earth 300 reports that it is making good progress toward getting an Approval in Principle (AIP) from RINA (formerly Registro Italiano Navale). RINA is a founding member of the International Association of Classification Societies (IACS), which promotes safer and cleaner shipping worldwide. The AIP is a framework used by RINA to review and approve innovative and novel concepts that are not covered by traditional classification prescriptive rules, so that a level of safety in line with the current marine industry practice is provided. The AIP process is a risk-based approach to classification that allows for new designs and novel concepts to be validated with safety equivalencies.
Following the AIP, Earth 300 should be able to request construction quotes from one or more shipyards, likely in Europe and/or South Korea. The ship will be equipped with 22 laboratories for about 160 scientists, cutting-edge artificial intelligence (AI) and robotics systems, and facilities for operating helicopters and submersible and semi-submersible vehicles. Earth 300 executives reportedly estimated that the total construction cost will be between $500 million and $700 million.
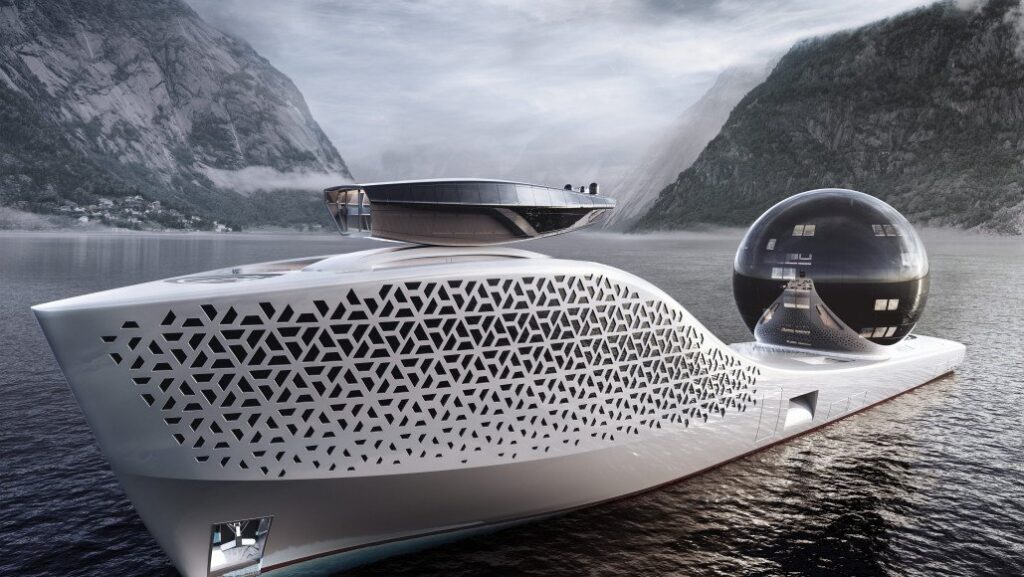
The observation deck is located atop the bow section of the ship. Source: Earth 300Foredeck helipad and hangar for a helicopter. Source: Earth 300The sphere houses a “science city” where most of the shipboard research facilities are located. Source: Earth 300
Once in operation, the ship is certain to command attention wherever it goes, as a recognizable symbol for environmental protection. This notoriety may be enough to attract wealthy tourists willing to pay $3 million for a 10-day cruise in the 10 luxury suites with private balconies and accommodations for personal staff in a separate set of cabins. That sort of money will buy a lot of selfies, instagrams and some durable bragging rights.
The ship is designed to accommodate 425 people, including the ship’s crew, scientists, and the group of wealthy tourists paying full price. In addition, it has been reported that Olivera envisages inviting groups of other people to travel at a lower price or even for free. For example, 10 suites would be made available to what Olivera calls Very Interesting Persons – people from all walks of life who would bring unique experience or knowledge to the voyage. In addition, some lucky artists, explorers and students may travel for free.
While I’m impressed with the general concept of this ship, I feel that the primary benefit of this grand vessel can’t be to serve as a mobile marine “mixer” for a few very wealthy individuals to associate with scientists, some elite Very Interesting Persons, and a patchwork of others interested in environmental protection.
Like the 3 AM infomercial says, “But wait, there’s more.” Research performed aboard the ship would be “open source” and shared with other research efforts around the world. That’s great, but more information is needed on the meaningful research programs that would be conducted on the Earth 300 vessel in segments that match the schedule and route of what is essentially a cruise ship. It seems that a much less expensive dedicated vessel could accomplish the same research while not serving as an environmental sideshow on a cruise ship.
With the ship scheduled to launch in 2025, the vessel itself will be ready many years before the planned marine molten salt reactors (m-MSRs) have been developed and approved by the appropriate nuclear and marine regulatory agencies. Therefore, it is likely that the vessel will be designed to operate initially with a conventional marine power plant running on synthetic “renewable” fuels. This isn’t exactly a big step in the right direction for helping to reduce the carbon emissions from worldwide commercial marine transportation.
Like the 3 AM infomercial says, “But wait, there’s more,” or at least, there should be.
Core Power, the developer of the m-MSR planned for the Earth 300 vessel, is designing their 15 MWe inherently safe micro-reactor system as a zero-carbon replacement power source for the fossil-fueled power plants in many commercial marine vessels. On their website, Core Power presents the following business case:
“Over the next few decades as many as 60,000 ships must transition from combustion of fossil fuels to zero-emission propulsion. The UN’s maritime agency IMO has mandated with unanimous approval from 197 countries that shipping must reduce emissions by 50% of the 2008 total, before 2050. This means an actual emission reduction of almost 90%, by 2050. MSR technology being developed by the consortium could achieve that goal, by powering production of green sustainable fuels for smaller ships and providing onboard electric power for large ships, with zero emissions as standard.”
A set of six small, compact Core Power m-MSRs could generate 90 MWe (about 120,000 hp). Source: Core Power
I think it is actually fortuitous that the Earth 300 vessel will start its life as a fossil-fueled vessel. From this starting point, Earth 300 will be at the vanguard of a new generation of inherently safe marine nuclear power system development and deployment.
Converting the Earth 300 vessel to nuclear power will move the discussions on commercial marine nuclear power from the academic domain, where it has languished for many decades, to the commercial marine nuclear safety regulatory domain, which has been inactive for decades and likely is not prepared for this new applicant. By being first in line, Earth 300 and Core Power take on substantial licensing risk that certainly will add to the time and cost of their nuclear licensing efforts. However, they are in unique positions as a reactor supplier and a vessel operator to help shape the licensing dialogue pertaining to the use of inherently safe micro-reactors in marine vessels, and the worldwide operation of vessels using such reactors.
The experience gained from converting Earth 300 from fossil to nuclear power will de-risk the nuclear power conversion process for the entire marine transportation industry.
Regulatory precedents will have been established for the reactor designer and the vessel operator.
The conversion experience will yield many metrics and lessons learned that will help in planning and executing subsequent conversions.
Ports around the world will be on notice that commercial nuclear-powered vessels once again are a reality and appropriate port-specific nuclear safety plans may be required
In this role alone, Earth 300 will create a path for the commercial marine transportation industry to meet the IMO’s 2050 emission goal. This would be a truly substantive accomplishment that will far outweigh the ship’s public relations accomplishments as a symbol of environmental protection and showcase for environmental research.
I hope Aaron Olivera gets the support he needs to build the Earth 300 ship and subsequently convert it to nuclear power. At one level, the ship is a grand gesture. On another level, the nuclear powered ship is a substantive step toward a future with zero-carbon commercial marine transportation.
On a 2016 road trip to the Black Hills, I had long transit days each way on Interstate 90 through southern Minnesota and South Dakota. One thing I noticed was that many of the heavy tractor-trailers on this high speed route were modern, streamlined vehicles that used a variety of aerodynamic devices that appeared useful for reducing aerodynamic drag and fuel consumption.
These tractor-trailers are Class 8 heavy trucks with a gross vehicle weight (GVW) of greater than 33,000 pounds (14,969 kg). The maximum GVW is set on a case-by-case basis using the Federal Bridge Formula Weights published by the Department of Transportation’s (DOT) Federal Highway Administration (FHWA) at the following link: https://ops.fhwa.dot.gov/freight/publications/brdg_frm_wghts/index.htm
For example, a long 5-axle tractor-trailer, commonly called an “18-wheeler,” can have a GVW up to 85,500 pounds (38,782 kg), but it is limited to a maximum GVW of 80,000 pounds (36,287 kg) when operating on federal interstate highways. The higher weight limit may apply on other roads if permitted by state and local jurisdictions.
Class 8 Trucks make up only 4% of the vehicles on the road. However, they use about 20% of the nation’s transportation fuel. The following Department of Energy (DOE) video, entitled “Energy 101: Heavy Duty Vehicle Efficiency,” provides an introduction to what’s being done to introduce a variety of new technologies that will improve the performance and economy of Class 8 tractor-trailers while reducing their environmental impact: https://www.energy.gov/eere/videos/energy-101-heavy-duty-vehicle-efficiency
In this post, we’ll take a look at the following:
Three US and Canadian programs to improve tractor-trailer aerodynamics, fuel efficiency and freight efficiency:
US Environmental Protection Agency (EPA) SmartWay® Transport Partnership
Canadian Center for Surface Transportation Technology
US Department of Energy (DOE) SuperTruck program
The North American Council for Freight Efficiency’s (NACFE) Annual Fleet Fuel Study for 2019, which provides insights into the current state of the US Class 8 tractor-trailer fleet.
Accessories available to improve the aerodynamic efficiency of existing Class 8 tractor-trailers.
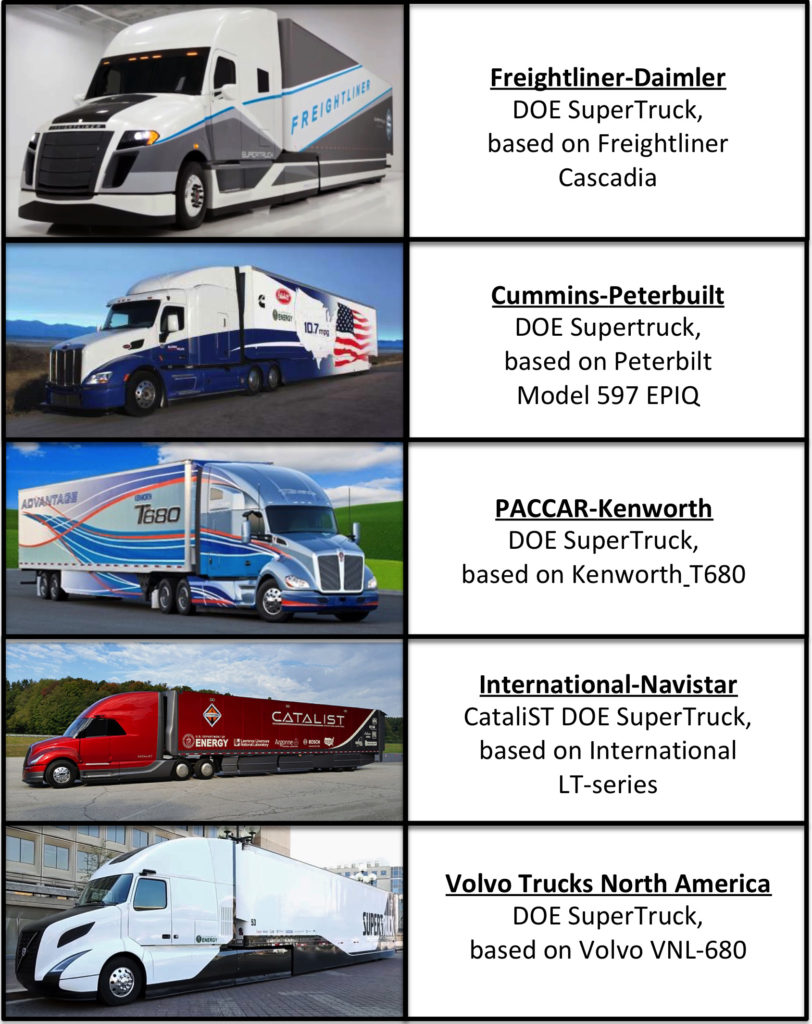
Aerodynamic Class 8 tractor-trailers from major US manufacturers, including:
Manufacturer’s flagship Class 8 trucks
Test trucks developed for the DOE SuperTruck program
Other advanced Class 8 truck designs and test trucks that are demonstrating new freight vehicle technologies.
Electric-powered Class 8 trucks that are about to enter service with the potential to revolutionize the freight trucking industry.
In the body of this post are links to 12 individual articles I’ve written on advanced Class 8 trucks, each of which can be downloaded as a pdf file. You’ll also find many other links to useful external resources.
2. US and Canadian programs to improve tractor-trailer aerodynamics and freight efficiency
Freight transportation is a cornerstone of the U.S. economy. In 2012, U.S. businesses spent $1 trillion to move $12 trillion worth of goods (8.5% of GDP). However, freight accounts for 9% of all U.S. greenhouse gas (GHG) emissions, and trucking is the dominant mode. The following programs are focused on reducing the GHG emissions of the freight trucking industry.
2.1 US SmartWay® Transport Partnership
The trucking industry’s ongoing efforts to improve heavy freight vehicle performance and economics were aided in 2004 by the creation of the SmartWay® Transport Partnership, which is administered by the Environmental Protection Agency (EPA). SmartWay® is a voluntarily program for achieving improved fuel efficiency and reducing the environmental impacts from freight transport. The goal is, “to move more freight, more miles, with lower emissions and less energy.” The SmartWay® website is at the following link: https://www.epa.gov/smartway
SmartWay® is promoting the following strategies to help the heavy trucking industry meet this goal:
Idle reduction
Speed control
Driver training
Aerodynamics
Tire technologies
Lubricants
Hybrid power trains
Improved freight logistics
Vehicle weight reduction
Intermodal freight capability
Alternative fuels
Long combination vehicles (LVCs, such as double trailers)
A truck and trailer fitted out with all the essential efficiency features can be sold as a SmartWay® “designated” model. A “designated” tractor-trailer combo can be as much as 20% more fuel-efficient than the comparable standard model.
2.2 Canadian Center for Surface Transportation Technology
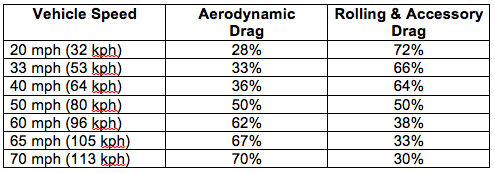
In May 2012, the Canadian Center for Surface Transportation Technology (CSTT) issued technical report CSTT-HVC-TR-205, entitled, “Review of Aerodynamic Drag Reduction Devices for Heavy Trucks and Buses.” In Table 2 of this report, CSTT provides the following table showing the relative power consumption of aerodynamic drag and rolling / accessory drag as a function of vehicle speed for a representative heavy truck on a zero grade road with properly inflated tires. Results will be different for streamlined trucks that have already have taken steps to reduce aero drag.
Relative magnitude of drag components. Source: CSTT, 2012
In this example, rolling / accessory drag dominates at lower speeds typical of urban driving. At 50 mph (80 kph) aerodynamic drag and rolling / accessory drag are approximately equal. At higher speeds, aerodynamic drag dominates power consumption. The speed limit on I-90 in South Dakota typically is 80 mph (129 kph). At this speed the aero drag contribution is even higher than shown in the above table.
Key points from this CSTT report include the following:
For tractor-trailers, pressure drag is the dominant component of vehicle drag, due primarily to the large surface area facing the main flow direction and the large, low-pressure wake resulting from the bluntness of the back end of the vehicle.
Aero-tractor models can reduce pressure drag by about 30% over the boxy classic style tractor.
Friction drag occurring along the sides and top of tractor-trailers makes only a small contribution to total drag (10% or less), so these areas are not strong candidates for drag-reduction.
The gap between the tractor and the trailer has a significant effect on total drag, particularly if the gap is large. Eliminating the gap entirely could reduce total drag by about 7%.
Side skirts or underbody boxes prevent airflow from entering the under-trailer region. These types of aero devices could reduce drag by 10 – 15%.
Wind-tunnel and road tests have demonstrated that a “boat tail” with a length of 24 – 32 inches (61 – 81 cm) is optimal for reducing drag due to the turbulent low-pressure region behind the trailer.
Adding a second trailer to form a long combination vehicle (LCV), and thus doubling the freight volumetric capacity, results in a very modest increase in drag coefficient (as low as about 10%) when compared to a single trailer vehicle.
In cold Canadian climates, the aerodynamic drag in winter can be nearly 20% greater than at standard conditions, due to the ambient air density. For highway tractor-trailers, this results in about a 10% increase in fuel consumption from aerodynamic drag when compared to the reference temperature, further emphasizing the importance of aerodynamic drag reduction strategies for the Canadian climate.
SuperTruck is major DOE technology innovation program with many industry partners representing a broad segment of the US industrial base for heavy tractor-trailers. This program, run by DOE’s Vehicle Technologies Office, focused on Class 8 trucks with internal combustion engines during the first two five-year program phases known as SuperTruck 1 and 2. Program focus shifted to electric powertrains in the third five-year phase known as SuperTruck 3.
Following is an overview of the SuperTruck program. Additional sources of information are listed at the end of this post.
SuperTruck 1 (2010-2016)
The first phase, known as SuperTruck 1, was a $284 million public-private partnership in which industry matched federal grants dollar-for-dollar. Four Class 8 truck manufacturers led teams in the SuperTruck 1 program:
Freightliner (Daimler North America)
International (Navistar)
Peterbilt (teamed with Cummins)
Volvo North America
DOE SuperTruck 1 teams. Source: DOE
Objectives for the DOE SuperTruck 1 program were:
Demonstrate a 50% freight efficiency improvement from a “baseline” 2009 model year Class 8 tractor-trailer.
Freight efficiency is the product of payload weight (in tons) and fuel economy (in miles per gallon), with results reported in North America as ton-miles per gallon.
Performance would be measured with a demonstration SuperTruck operated at 65,000 pounds GVW.
Average fuel efficiency of the baseline tractors in SuperTruck 1 was 6.2 mpg.
Improve engine efficiency by 8% to achieve 50% brake thermal efficiency (BTE), and thereby boost fuel efficiency by 16%.
The BTE of an engine is the ratio of Brake Power (BP) to Fuel Power (FP).
Brake power (BP) is the amount of power available at the crankshaft, taking into account engine friction losses (i.e., between cylinder and walls, crankshaft bearing, etc.).
Fuel power (FP) is a measure of the calorific value of the fuel used to deliver a particular value of BP.
Typical Class 8 truck diesel engines operate at 41 – 43% BTE. This means that 41 – 43% of the calorific value of the fuel is converted into power available at the crankshaft. The remaining 57 – 59% of the calorific value of the fuel is lost as heat that is carried off by the engine cooling system and engine exhaust system. In some advanced engines, turbochargers and waste heat recovery systems are used to increase BTE by recovering some energy from exhaust gases.
Show pathways for a further 5% improvement in engine efficiency (to achieve a BTE of 55%).
The four SuperTrucks developed by the respective teams are described in Section 5. All teams met or exceeded the SuperTruck I objectives set by DOE.
SuperTruck 2 (2017 – 2022)
SuperTruck 2 is a five-year, $160-million public-private partnership with industry matching federal grants dollar-for-dollar. Five teams are participating in the SuperTruck 2 program:
In August 2016, DOE announced that the four teams from SuperTruck 1 would continue their participation in SuperTruck 2.
A new team led by PACCAR, with truck manufacturer Kenworth as a team member, joined SuperTruck 2 in October 2017.
Objectives for the DOE SuperTruck 2 program are:
Improve freight efficiency (ton-miles per gallon) by 100% relative to a “best in class” 2009 truck (same baseline as in SuperTruck I), with a stretch goal of 120%.
Demonstrate 55% Brake Thermal Efficiency on an engine dynamometer.
Develop technologies that are commercially cost effective in terms of a simple payback.
Michael Berube, head of DOE’s Vehicle Technologies Office, acknowledged that the SuperTruck 2 objectives are beyond what the participants think they can achieve. However, with industry receiving dollar-for-dollar federal grants, Berube said, “…the program will allow them to try higher-risk technologies than they might on their own.”
Among the candidate technologies for SuperTruck 2 are:
Engines with waste heat recovery
Various forms of hybrid diesel-electric systems
More radical aerodynamic improvements, including active devices and completely redesigned cabs.
“Think of the benefit to the industry and to the country if they can meet that goal of doubling freight efficiency. There are 1.7 (to 2.5) million Class 8 trucks out there, each traveling an average of 66,000 miles a year. Doubling their efficiency could reduce petroleum consumption by 300 million barrels a year,” Berube said. At today’s fuel costs, that would save operators up to $20,000 per truck per year.
While most SuperTruck 2 programs wrapped up in 2022, PACCAR’s program was completed at the end of 2023 due to its later starting date.
SuperTruck 3 (2022 – 2027)
In October 2021, DOE launched a $199 million, five-year program to support the development of zero-emission vehicles, with $127 million directed to the SuperTruck 3 program, which will fund 50:50 cost-sharing projects to develop battery-electric and fuel cell medium- and heavy-duty trucks and freight system solutions with payload capacity and range equivalent to typical diesel-powered counterpart vehicles.
This DOE program includes three firms from the previous SuperTruck 2 program: PACCAR Inc., Volvo Group North America and Daimler Trucks North America.
PACCAR Inc.: $33 million in DOE cost-sharing funds to develop 18 Class 8 battery-electric vehicles with advanced batteries and a demonstration megawatt-class charging station.
Volvo Group North America: $18 million in DOE cost-sharing funds to develop a 400-mile-range Class 8 battery-electric tractor-trailer with advanced aerodynamics, electric braking, EV-optimized tires, automation and route planning. It also will develop and demonstrate a megawatt-class charging station.
Daimler Trucks North America: $26 million in DOE cost-sharing funds to develop and demonstrate two Class 8 hydrogen fuel cell trucks with a 600-mile range and 25,000-hour durability.
In addition, the SuperTruck 3 program includes Ford Motor Company and General Motors, both of which will focus on smaller freight vehicles, up to Class 6 Super Duty trucks.
3. The NACFE Annual Fleet Fuel Study
The North American Council for Freight Efficiency (NACFE) (https://nacfe.org/) describes its mission as working to “drive the development and adoption of efficiency enhancing, environmentally beneficial, and cost-effective technologies, services and methodologies in the North American freight industry.”
One of NACFE’s important products is the Annual Fleet Fuel Study, which reports on the adoption of 85 technologies and practices for improving freight efficiency among major North American Class 8 truck fleets operators. The 2019 Annual Fleet Fuel Study was based on data from 21 fleets operating 73,844 tractors and 239,292 trailers. You can download the NACFE 2019 Annual Fleet Fuel Survey here: https://nacfe.org/annual-fleet-fuel-studies/
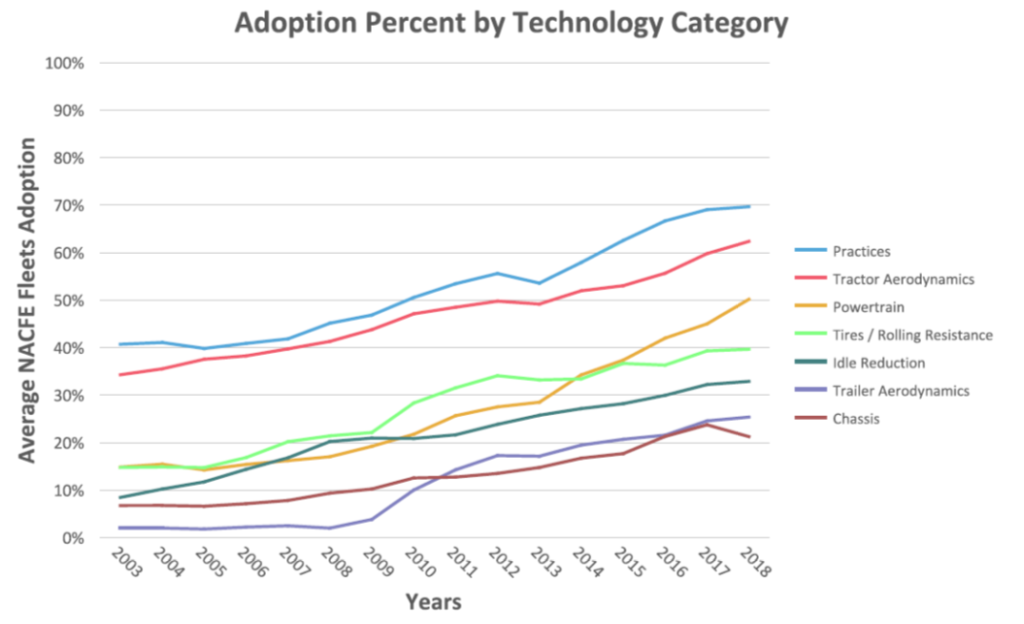
The following chart shows adoption rates among NACFE member fleets in seven technology categories. Tractor aerodynamic improvements (light blue line) have a high rate of adoption, at about 62% in 2018. In contrast, trailer aerodynamic improvements (purple line) have a much lower rate of adoption, at about 25% in 2018.
Source: NACFE 2019 Annual Fleet Fuel Study
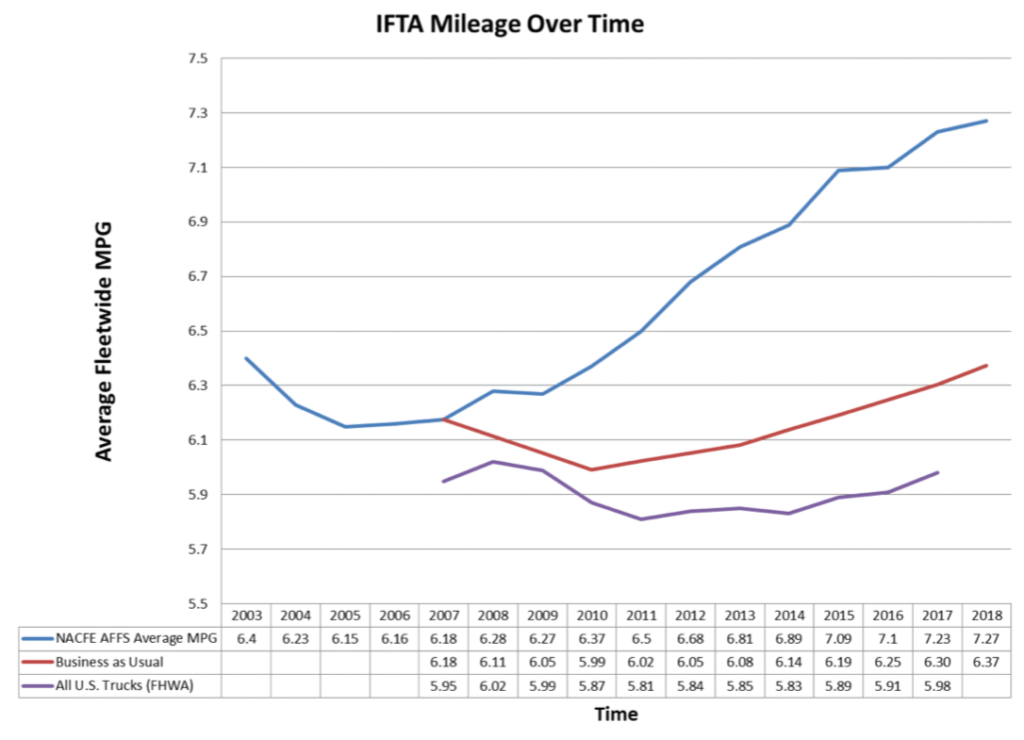
The Annual Fleet Fuel Study includes an analysis of the average fuel economy delivered by the combined Class 8 tractor-trailer fleet. Over the 16 years of this study, the average year-on-year improvement in fuel economy has been 2.0%. Fuel economy results are summarized in the following chart.
Source: NACFE 2019 Annual Fleet Fuel Study
Key points in this chart are:
The blue line represents the average fuel economy of the NACFE fleet from 2003 to 2018. In 2018, the NACFE fleet-wide average fuel economy increased to 7.27 mpg.
The red line is a hypothetical “business as usual” case, which is an estimate of what NACFE fleet fuel economy would be based only on improvements in engine efficiency. In 2018, “business as usual” would have yielded 6.37 mpg.
The difference between the blue and red curves represents the fuel efficiency improvements attributable to all other technologies and practices. In 2018, that difference was 0.9 mpg, meaning that actual performance was 14% better than the “business as usual” case.
The lowest (purple) curve is based on actual data reported to the U.S. Department of Transportation’s Federal Highway Administration (FHWA) for the approximately 2.5 million over-the-road tractor-trailers operating in the US. This average fleet fuel efficiency in 2017 was 5.98 mpg, well behind the fuel efficiency performance reported by NACFE fleet operators (which is included in the FHWA data).
4. Accessories available to improve the aerodynamic efficiency of existing tractor-trailers
The typical big rig has an aerodynamic drag coefficient, CD, of over 0.6, which has a huge effect on fuel economy, particularly during high-speed highway driving. Many truck manufacturers and third-party firms offer add-on kits with a variety of devices that can be installed on an existing tractor-trailer to improve its aerodynamic efficiency. Here we’ll look at a few of those devices:
Trailer tails (tapered boat-tails on the back of the trailer)
Trailer skirts
Aerodynamic wheel covers
The U.S. firm STEMCO (http://www.stemco.com) offers two aero kits for improving conventional tractor-trailer aerodynamics:
TrailerTail®, which is installed at the back of the trailer, reduces the magnitude of the turbulent low-pressure area that forms behind the trailer at high speeds.
EcoSkirt®, which is installed under the trailer, reduces aerodynamic drag under the trailer where air hits the trailer’s rear axles. The side fairings streamline and guide the air around the sides and to the back of the trailer.
Both of these aerodynamic devices are shown in the following figure. This was a tractor-trailer configuration that I saw frequently on I-90.
Source: STEMCO
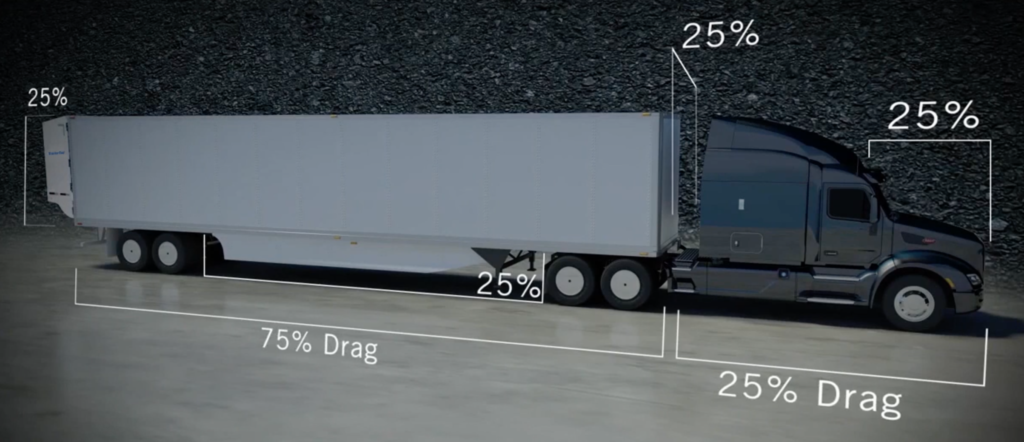
STEMCO allocates the primary sources of tractor-trailer aerodynamic drag as shown in the following figure.
Source: STEMCO
STEMCO claims the following benefits from their aero kits:
“TrailerTail® fuel savings complement other aerodynamic technologies.”
“A TrailerTail® reduces aerodynamic drag by over 12% equating to over 5% fuel efficiency improvement at 65 mph (105 kph) and over 12% fuel efficiency improvement when combined with STEMCO’s side skirts and other minor trailer modifications.”
STEMCO TrailerTail® meets the SmartWay® advanced trailer end fairings criteria for a minimum of 5% fuel savings and the STEMCO EcoSkirt® meets the advanced trailer skirts qualifications with greater than 5% fuel savings. The payback period for these aero devices is expected to be about one year.
You’ll find more details on STEMCO’s tractor-trailer drag reduction products, including a short “Aerodynamics 101” video, at the following link: http://www.stemco.com/aero-u/
More details on TrailerTail®, including its automatic deployment and operational use, are shown in a short video at the following link: https://www.youtube.com/watch?v=qPrM3-CCth8
Another firm, Aerotech Caps, offers a range of aero kits for improving truck aerodynamics, including aerodynamic wheel covers, aerodynamic trailer skirts, tail fairings and vortex generators. You can see their product line at the following link: https://aerotechcaps.com/#aerotechcaps
Source: Aerotech Caps
Aerotech Caps claims that its aerodynamic wheel covers deliver about 2.4% increased miles per gallon when installed on rear tractor and all trailer wheels. Payback period for this aero kit is expected to be about one year.
5. Aerodynamic Class 8 production tractor-trailers and SuperTrucks from major US manufacturers
Conventional, top-of-the-line tractor-trailers on the market today have significantly improved aerodynamic and fuel efficiency performance in comparison to their predecessors. The aero gains have been achieved by integrating many of the aero features described above into the basic designs for the latest Class 8 tractor-trailers on the market. In addition, optional aero kits are available to further improve performance.
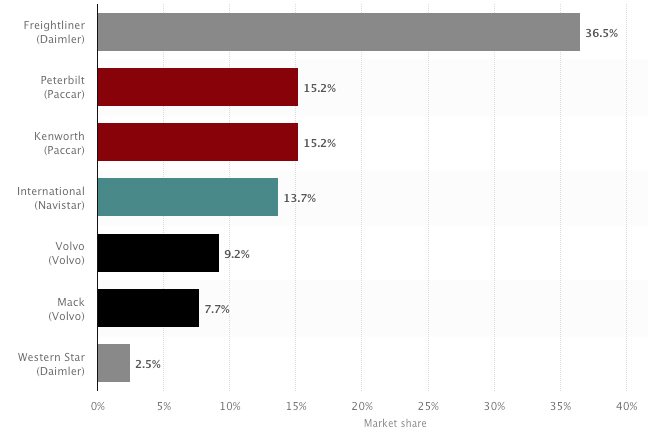
Class 8 truck manufacturers’ market share in the U.S. as of December 2019 is shown in the following chart.
Note that Freightliner is a Daimler North America brand along with Western Star. Peterbilt and Kenworth are PACCAR brands. International is a Navistar brand and Mack is a Volvo brand.
Now we’ll take a look at the most aerodynamic tractor-trailers offered in 2020 by the top five manufacturers in the US Class 8 truck market. Collectively, these manufacturers account for almost 90% of the US Class 8 heavy truck market.
Four of the five top manufacturers, Freightliner, Peterbilt, International and Volvo, led teams in the DOE SuperTruck 1 program (2010-2016) and are continuing their participation in the SuperTruck 2 program (2017 – 2022). Kenworth did not participate in SuperTruck 1, but did participate in SuperTruck 2 as a member of a new team led by their parent firm, PACCAR.
You’ll find my articles on these tractor-trailers at the following links:
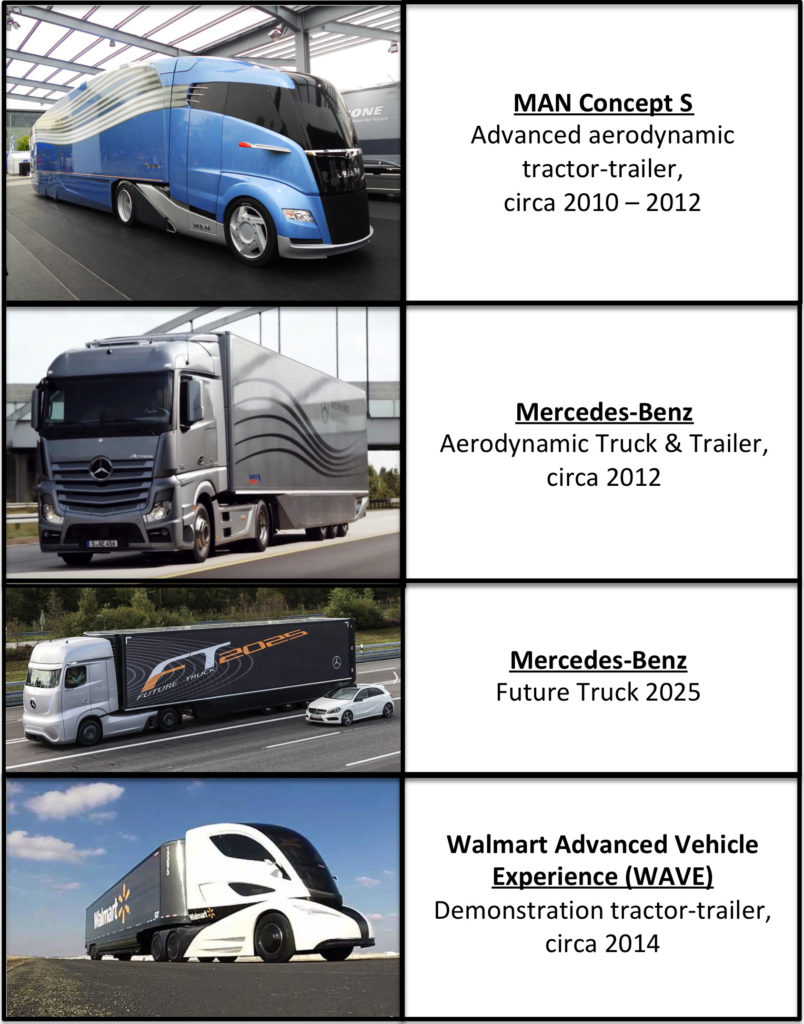
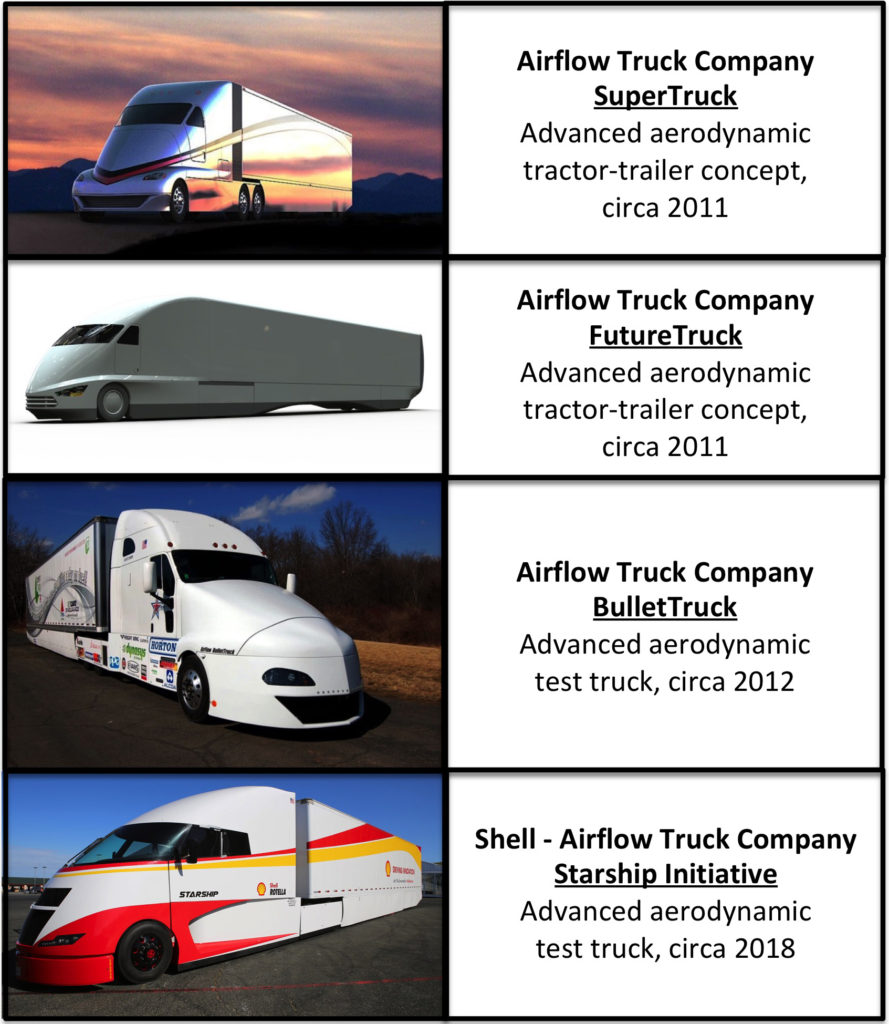
6. Other advanced Class 8 tractor-trailer designs and test trucks
The future of heavy freight vehicles is certain to include increasingly aerodynamic tractor-trailers with more efficient diesel and hybrid powertrains. While the five teams participating in the DOE SuperTruck program are demonstrating significantly improved Class 8 tractor-trailer performance, other firms have been working in parallel to develop their own advanced truck concepts and test trucks. In this section, we’ll take a look at the following advanced integrated tractor-trailers.
You’ll find my articles at these tractor-trailers at following links:
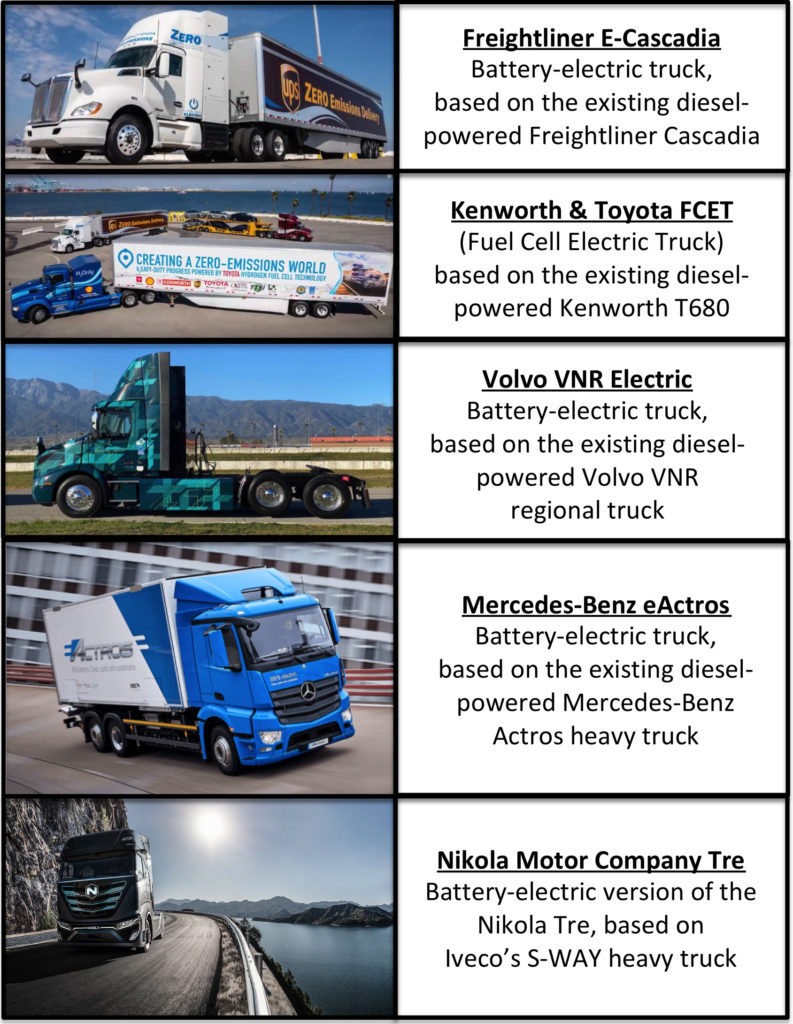
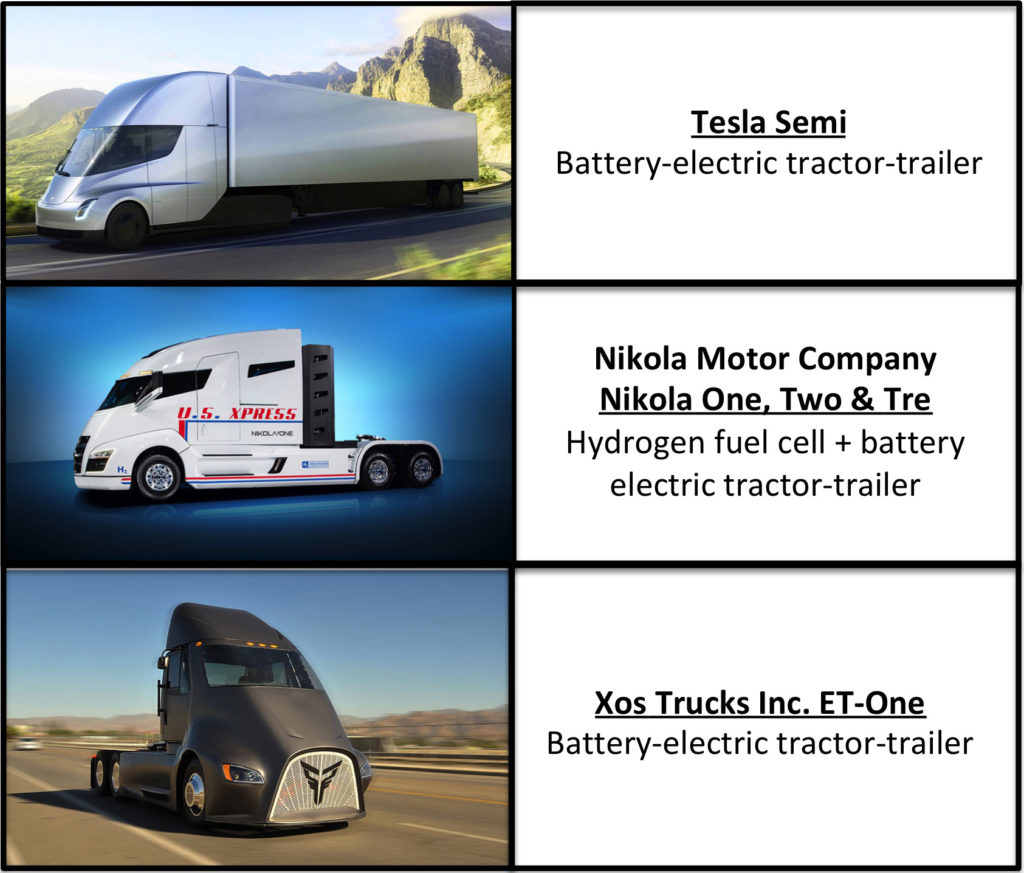
7. Advanced electric-powered Class 8 tractor-trailers
A variety of electric-powered heavy trucks and tractor trailers are being developed for the worldwide market and several are being operationally tested. The most common electric energy sources are be battery-electric or hydrogen fuel cell + battery.
“Battery electric vehicles are around 90% efficient with the electricity that flows into the charger when it is converted into motion by the onboard motors.”
“Hydrogen fuel cell vehicles are understandably less efficient, using the source electricity to break apart water, compress it, transfer it into the vehicle, and then convert the hydrogen back into electricity by combining it with ambient oxygen. Estimates for the efficiency of the electricity used to produce hydrogen, then get converted back to electricity in fuel cell vehicles, is around 40%.”
Lithium-ion batteries currently are the dominant type of battery used in electric vehicles. Boston Consulting Group reported that one particular type, the lithium nickel-manganese-cobalt (NMC) battery, has good overall performance, excels on specific energy, has the lowest self-heating rate, and is a preferred candidate for electric vehicles. For more information, see the 10 July 2019 Battery University article, “BU-205: Types of Lithium-ion Batteries,” at the following link: https://batteryuniversity.com/learn/article/types_of_lithium_ion
While less efficient in overall energy conversion, the hydrogen fuel cell weighs much less and can store much more energy than a comparably-sized, current-generation battery packaged for a heavy-duty truck application. For more information on hydrogen fuel cells, see the May 2017 University of California (UC) Davis presentation, “Fuel Cells and Hydrogen in Long-Haul Trucks,” at the following link: https://steps.ucdavis.edu/wp-content/uploads/2017/05/Andy-Burke-Hydrogen-Fuel-Cell-Trucks.pdf
In 2020, several heavy-duty electric truck designs are adaptations of existing Class 8 tractor-trailers with all-new electric powertrains. Examples are shown in the following table.
Some designs in 2020 were “clean-sheet” advanced electric-powered Class 8 tractor-trailers that also may offer a future path toward autonomous vehicle operation. Examples include:
Then there are even more advanced electric-powered heavy trucks that are designed originally as autonomous freight haulers without provisions for a driver’s cab. For example:
You can get a good overview of the current state of electric-powered heavy truck development in the following October 2019 video by Automotive Territory: “10 All-Electric Trucks and Freighters Showcasing the Future of Cargo Vehicles” (11:17 minutes): https://www.youtube.com/watch?v=smAleMBEszs
In this section, we’ll take a look at the “clean-sheet” advanced electric-powered Class 8 tractor-trailers. You’ll find my articles at these tractor-trailers at following links:
The DOE-sponsored SuperTruck 3 program initiated in 2022, which is funding work to develop battery-electric and fuel cell medium- and heavy-duty trucks and freight system solutions, is not funding any of the above three companies.
8. Conclusions:
Freight currently accounts for 9% of all U.S. greenhouse gas (GHG) emissions, and trucking is the dominant mode. The gradual phase-in of tractor-trailers with refined aerodynamics and diesel engines is improving fleet-wide fuel economy and thereby helping to decrease the carbon footprint of long-haul trucking.
Large improvements in freight efficiency (the product of payload weight in tons and fuel economy in miles per gallon; ton-miles per gallon) were demonstrated during the DOE SuperTruck 1 program, and greater gains are expected in SuperTruck 2, which continued into 2023. In the meantime, truck manufacturers are implementing SuperTruck technologies in their production model tractor-trailers. This is a significant step in the right direction.
With the introduction of electric-powered tractor-trailers in the next decade, the trucking industry has an opportunity to revolutionize its operations by deploying fleets of zero-emission trucks. The very aerodynamic, electric-powered Tesla Semi and the smaller freight vehicles being developed by Xos seem to be good first steps in starting the electric freight revolution. They will be joined by other electric-powered tractor-trailers and smaller freight vehicles being developed under the DOE SuperTruck 3 program, which will run thru 2027.
For the electric-powered trucks to compete effectively with diesel and hybrid-powered truck, the truck manufacturers and the freight industry needs to support deployment of the diverse nation-wide infrastructures for very-high capacity battery recharging and hydrogen refueling. With these new infrastructures in place, electric-powered freight operations can become routine and make a big contribution to reducing GHG emissions and the environmental impact of the nation’s freight hauling industry.
In spite of all of these opportunities for improving heavy tractor-trailer performance, there always will be cases when few of these are actually practical. As evidence, I offer the following photo taken at 80 mph on I-90 in South Dakota during my 2016 road trip. How do you optimize that giant drag coefficient?
National Academies report: “Review of the 21st Century Truck Partnership: Third Report,”, particularly Chapter 8, “SuperTruck,” 2015; https://www.nap.edu/download/21784
“NETL Project Partner Daimler Truck North America Debuts Next Level of Freight Efficiency with the Freightliner SuperTruck II,” National Energy Technology Laboratory press release, 3 August 2023: https://netl.doe.gov/node/12767
In my 19 December 2016 post, “What to do with Carbon Dioxide,” I provided an overview of the following three technologies being developed for underground storage (sequestration) or industrial utilization of carbon dioxide:
Store in basalt formations by making carbonate rock
In the past two years, significant progress has been made in the development of processes to convert gaseous carbon dioxide waste streams into useful products. This post is intended to highlight some of the advances being made and provide links to additional current sources of information on this subject.
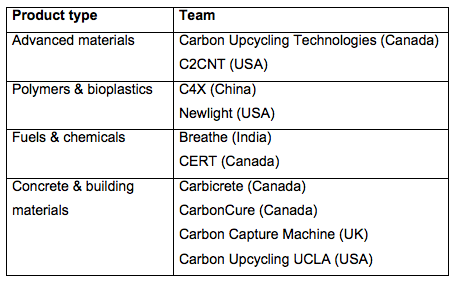
1. Carbon XPrize: Transforming carbon dioxide into valuable products
The NRG / Cosia XPrize is a $20 million global competition to develop breakthrough technologies that will convert carbon dioxide emissions from large point sources like power plants and industrial facilities into valuable products such as building materials, alternative fuels and other items used every day. You’ll find details on this competition on the XPrize website at the following link:
The competition is now in the testing and certification phase. Each team is expected to scale up their pilot systems by a factor of 10 for the operational phase, which starts in June 2019 at the Wyoming Integrated Test Center and the Alberta (Canada) Carbon Conversion Technology Center.
The teams will be judged by the amount of carbon dioxide converted into usable products and the value of those products. We’ll have to wait until the spring of 2020 for the results of this competition.
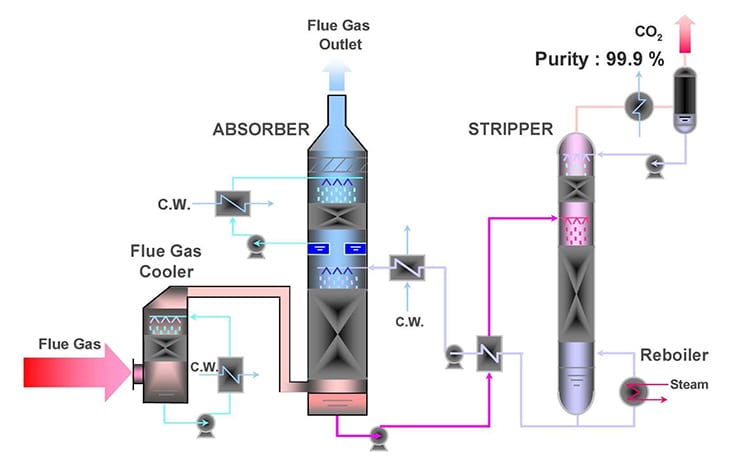
2. World’s largest post-combustion carbon capture project
Post-combustion carbon capture refers to capturing carbon dioxide from flue gas after a fossil fuel (e.g., coal, natural gas or oil) has been burned and before the flue gas is exhausted to the atmosphere. You’ll find a 2016 review of post-combustion carbon capture technologies in the paper by Y. Wang, et al., “A Review of Post-combustion Carbon DioxideCapture Technologies from Coal-fired Power Plants,” which is available on the ScienceDirect website here:
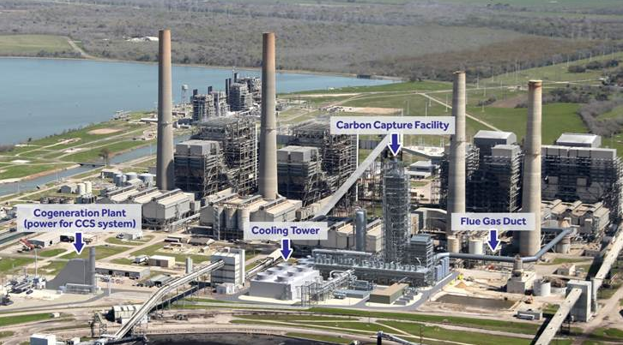
In January 2017, NRG Energy reported the completion of the Petra Nova post-combustion carbon capture project, which is designed to remove 90% of the carbon dioxide from a 240 MW “slipstream” of flue gas at the existing W. A. Parish generating plant Unit 8. The “slipstream” represents 40% of the total flue gas flow from the coal-fired 610 MW Unit 8. To date, this is the largest post-combustion carbon capture project in the world. Approximately 1.4 million metric tons of carbon dioxide will be captured annually using a process jointly developed by Mitsubishi Heavy Industries, Ltd. (MHI) and the Kansai Electric Power Co. The US Department of Energy (DOE) supported this project with a $190 million grant.
The DOE reported: “The project will utilize a proven carbon capture process, which uses a high-performance solvent for carbon dioxideabsorption and desorption. The captured carbon dioxide will be compressed and transported through an 80 mile pipeline to an operating oil field where it will be utilized for enhanced oil recovery (EOR) and ultimately sequestered (in the ground).”
Process flow diagram for Petra Nova carbon dioxidecapture and processing. Source: National Energy Technology LaboratoryThe Petra Nova site. Source: Petra Nova, a joint venture between NRG Energy and JX Nippon Oil & Gas ExplorationThe Petra Nova large-scale carbon dioxide scrubber. Source: Business Wire
You’ll find more information on the Petra Nova project at the following links:
3. Pilot-scale projects to convert carbon dioxideto synthetic fuel
Thyssenkrupp pilot project for conversion of steel mill gases into methanol
In September 2018, Thyssenkrupp reported that it had “commenced production of the synthetic fuel methanol from steel mill gases. It is the first time anywhere in the world that gases from steel production – including the carbon dioxide they contain – are being converted into chemicals. The start-up was part of the Carbon2Chem project, which is being funded to the tune of around 60 million euros by Germany’s Federal Ministry of Education and Research (BMBF)……..‘Today the Carbon2Chem concept is proving its value in practice,’ said Guido Kerkhoff, CEO of Thyssenkrupp. ‘Our vision of virtually carbon dioxide-free steel production is taking shape.’”
Berkeley Laboratory developing a copper catalyst that yields high efficiency carbon dioxide-to-fuels conversion
The DOE Lawrence Berkeley National Laboratory (Berkeley Lab) has been engaged for many years in creating clean chemical manufacturing processes that can put carbon dioxide to good use. In September 2017, Berkeley Lab announced that its scientists has developed a new electrocatalyst comprised of copper nanoparticles that can directly convert carbon dioxide into multi-carbon fuels and alcohols (e.g., ethylene, ethanol, and propanol) using record-low inputs of energy. For more information, see the Global Energy World article here:
The term negative emissions technology (NET) refers to an industrial processes designed to remove and sequester carbon dioxidedirectly from the ambient atmosphere rather than from a large point source of carbon dioxide generation (e.g. the flue gas from a fossil-fueled power generating station or a steel mill). Think of a NET facility as a carbon dioxideremoval “factory” that can be sited independently from the sources of carbon dioxide generation.
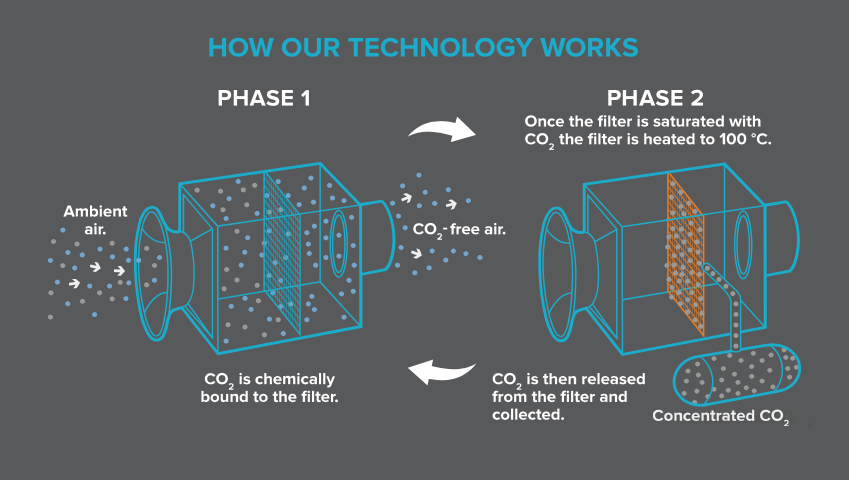
The Swiss firm Climeworks is in the business of developing carbon dioxideremoval factories using the following process:
“Our plants capture atmospheric carbon with a filter. Air is drawn into the plant and the carbon dioxide within the air is chemically bound to the filter. Once the filter is saturated with carbon dioxide it is heated (using mainly low-grade heat as an energy source) to around 100 °C (212 °F). The carbon dioxide is then released from the filter and collected as concentrated carbon dioxide gas to supply to customers or for negative emissions technologies. Carbon dioxide-free air is released back into the atmosphere. This continuous cycle is then ready to start again. The filter is reused many times and lasts for several thousand cycles.”
This process is shown in the following Climeworks diagram:
Source: Climeworks
You’ll find more information on Climeworks on their website here:
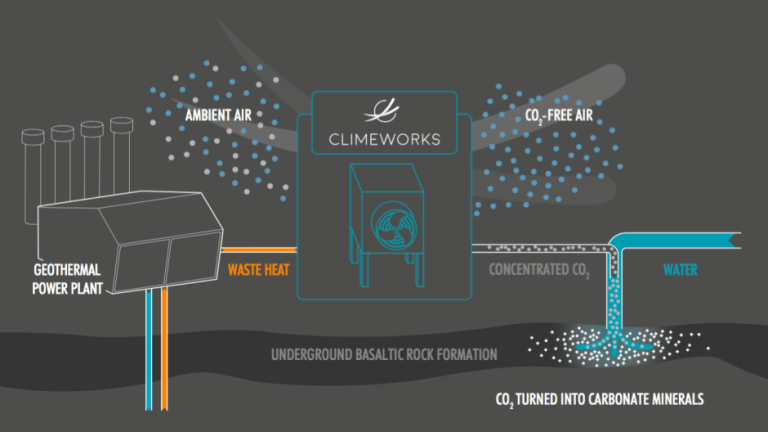
In 2017, Climeworks began operation in Iceland of their first pilot facility to remove carbon dioxide from ambient air and produce concentrated carbon dioxide that is injected into underground basaltic rock formations, where the carbon dioxide gets converted into carbonite minerals in a relatively short period of time (1 – 2 years) and remains fixed in the rock. Climeworks uses waste heat from a nearby geothermal generating plant to help run their carbon capture system. This process is shown in the following diagram.
Source: Climeworks
This small-scale pilot facility is capable of removing only about 50 tons of carbon dioxide from the atmosphere per year, but can be scaled up to a much larger facility. You’ll find more information on this Climeworks project here:
In October 2018, Climeworks began operation in Italy of another pilot-scale NET facility designed to remove carbon dioxide from the atmosphere. This facility is designed to remove 150 tons of carbon dioxide from the atmosphere per year and produce a natural gas product stream from the atmospheric carbon dioxide, water, and electricity. You’ll find more information on this Climeworks project here:
5. Consensus reports on waste stream utilization and negative emissions technologies (NETs)
The National Academies Press (NAP) recently published a consensus study report entitled, “Gaseous Carbon Waste Streams Utilization, Status and Research Needs,” which examines the following processes:
Mineral carbonation to produce construction material
Chemical conversion of carbon dioxideinto commodity chemicals and fuels
Biological conversion (photosynthetic & non-photosynthetic) of carbon dioxide into commodity chemicals and fuels
Methane and biogas waste utilization
The authors note that, “previous assessments have concluded that …… > 10 percent of the current global anthropogenic carbon dioxide emissions….could feasibly be utilized within the next several decades if certain technological advancements are achieved and if economic and political drivers are in place.”
Source: National Academies Press
You can download a free pdf copy of this report here:
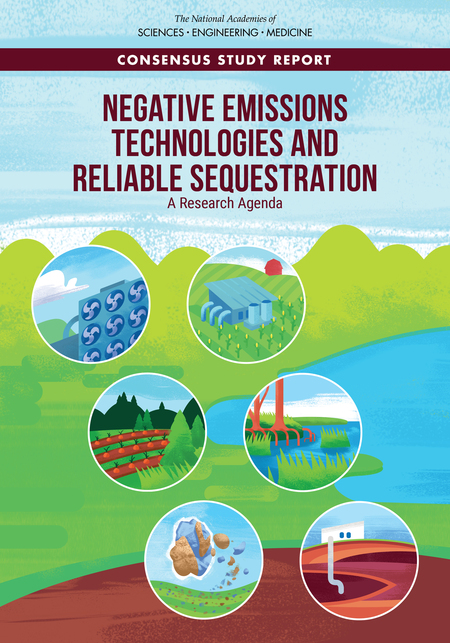
Also on the NAP website is a prepublication report entitled, “Negative Emissions Technologies and Reliable Sequestration.” The authors note that NETs “can have the same impact on the atmosphere and climate as preventing an equal amount of carbon dioxide from being emitted from a point source.”
Source: National Academies Press
You can download a free pdf copy of this report here:
In this report, the authors note that recent analyses found that deploying NETs may be less expensive and less disruptive than reducing some emissions at the source, such as a substantial portion of agricultural and land-use emissions and some transportation emissions. “ For example, NAPs could be a means for mitigating the methane generated from enteric fermentation in the digestive systems of very large numbers of ruminant animals (e.g., in the U.S., primarily beef and dairy cattle). For more information on this particular matter, please refer to my 31 December 2016 post, “Cow Farts Could be Subject to Regulation Under a New California Law,”which you’ll find here:
The Human Development Index (HDI), which is a measure of the quality of life, was developed in 1990 by the United Nations to enable cross-national comparisons of the state of human development. You can read about the HDI and download the UN’s annual Human Development Reports at the following link:
As you might imagine, there are large HDI differences among the world’s many nations. In its 2016 Human Development Report, the following nations were at the top and bottom of the HDI international ranking:
The top five places in the global HDI rankings are: Norway (0.949), Australia (0.939), Switzerland (0.939), Germany (0.926) with Denmark and Singapore (0.925) sharing the 5th spot.
The bottom five countries in rank order of HDI are: Burundi (0.404), Burkina Faso (0.402), Chad (0.396), Niger (0.353) and Central African Republic (0.352).
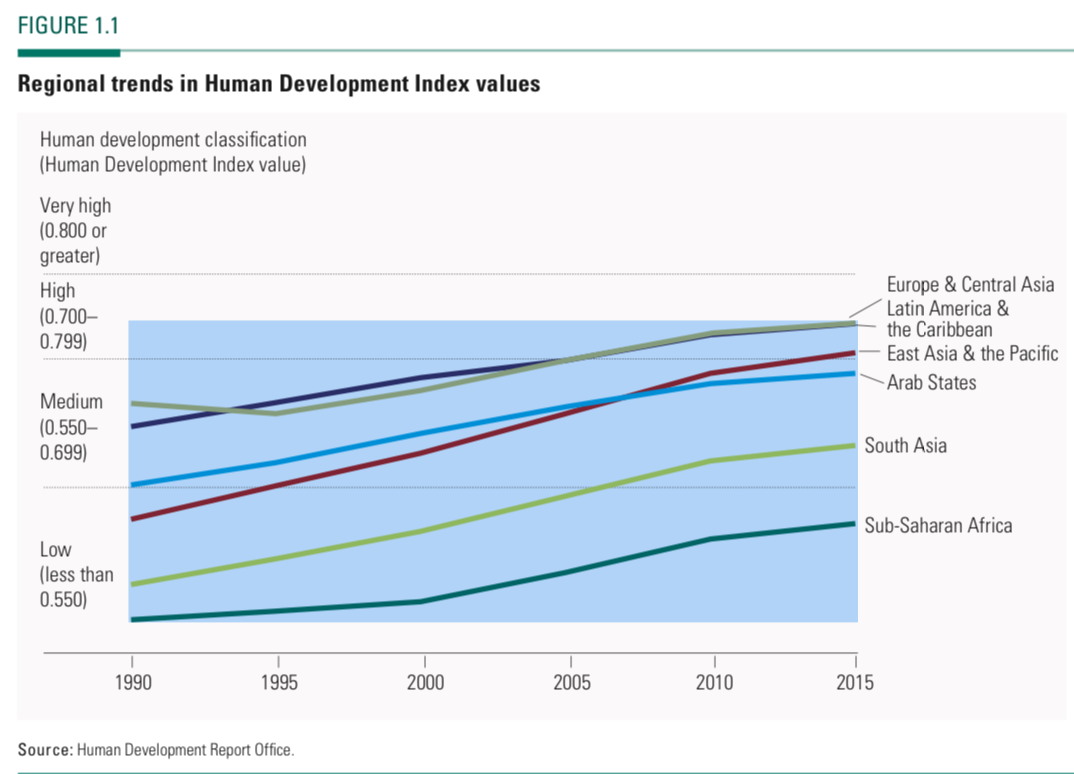
The UN reported that the regional HDI trends from 1990 to 2015 are up in all regions of the world, as shown in the following figure.
The U.S. Department of Energy (DOE) developed a general correlation between HDI and the annual per capita energy consumption in each nation, as shown in the following figure. Note that annual per capita energy consumption is not a factor in the UN’s determination of HDI.
Source: DOE “Nuclear Energy Research & Development Roadmap – Report to Congress”, April 2010
DOE reports:
“Figure 3 illustrates that a nation’s standard of living depends in part on energy consumption. Access to adequate energy is now and will continue to be required to achieve a high quality of life.”
Based on the 25-year HDI trends reported by the UN (Figure 1.1, above), nations generally have been moving up the HDI scale. Based on the DOE correlation (Figure 3, above), many of these nations, especially the least-developed nations, also should be moving up the scale for per capita energy consumption (to the right in the chart above) as their HDI increases. The net result should be a worldwide trend toward higher median per capita energy consumption. While conservation efforts may help reduce the per capita energy consumption in highly developed nations, there is a large fraction of the world’s population living in less developed nations. In these countries the per capita energy consumption will grow significantly as the local economies develop and the local populations demand basic goods and services that are commonplace in more developed nations.
In his commentary on global warming, Nobel laureate Dr. Ivar Giaever takes issue with CO2 being the cause of global warming by noting that the key “evidence” is a claimed global average temperature increase of 0.8 degrees (288 to 288.8 K) between 1880 and 2013 and a supposed correlation of this temperature increase with the increase of CO2 in the atmosphere. Dr. Giaever takes the position that measuring a worldwide average temperature trend is a difficult task, particularly with the modest number of measurement points available more than a hundred years ago, the consistency of measurement over the period of interest, and the still-modest number of measurement points in many parts of the world today. In addition, he notes that a 0.8 degree K change in worldwide average temperature over a period of 133 years seems to be a very high level of consistency rather than an alarming trend. During that same period, Dr. Giaever noted that world population increased from 1.5 to 7 billion and many human activities contributed to environmental change, yet the impacts of all these additional people are rarely mentioned in the climate change debate. You can watch one of Dr. Giaever lectures at the following link:
What is the impact of having 5.5 billion more people in the world today (and their many ancestors for the past 133 years) on global CO2 emissions? That’s hard to determine, but a simpler starting point is to assess the impact of one additional person.
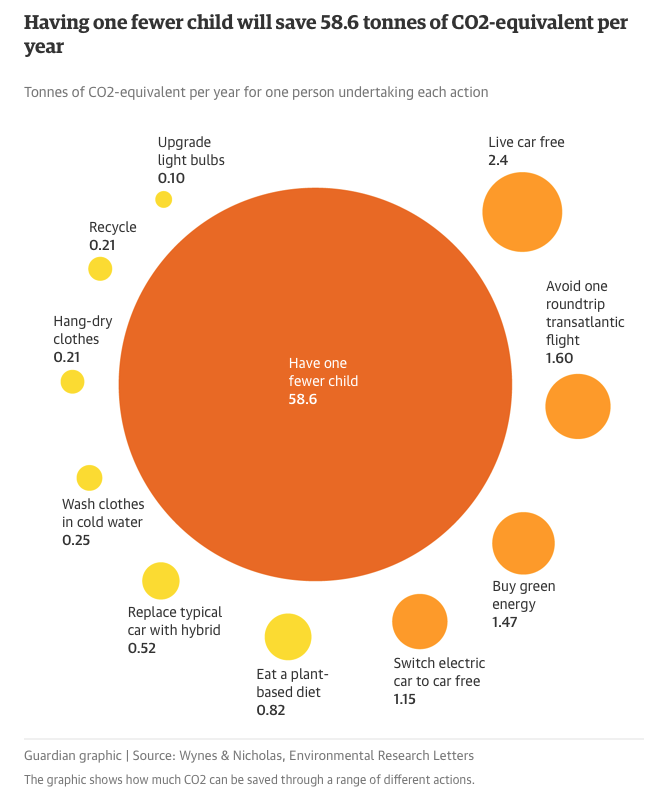
That matter was addressed in a 2017 article by Seth Wynes and Kimberly Nicholas entitled, “The climate mitigation gap: education and government recommendations miss the most effective individual actions,” which was published in Environmental Research Letters. The authors developed a ranking for a wide variety of human activities relative to their contribution to CO2 emission reduction measured in tonnes (metric tons, 2205 pounds) of CO2-equivalent per year. I can tell you that the results are surprising.
A synopsis of these results is published in The Guardian using the following simple graphic.
The study authors, Wynes and Nicholas, concluded:
“We recommend four widely applicable high-impact (i.e. low emissions) actions with the potential to contribute to systemic change and substantially reduce annual personal emissions: having one fewer child (an average for developed countries of 58.6 tonnes CO2-equivalent (tCO2e) emission reductions per year), living car-free (2.4 tCO2e saved per year), avoiding airplane travel (1.6 tCO2e saved per roundtrip transatlantic flight) and eating a plant-based diet (0.8 tCO2e saved per year). These actions have much greater potential to reduce emissions than commonly promoted strategies like comprehensive recycling (four times less effective than a plant-based diet) or changing household lightbulbs (eight times less).”
Surprise!! Population growth adds CO2 to the atmosphere and the biggest impact a person can have on their own carbon footprint is to not have an additional child.
The authors noted that average savings of 58.6 tCO2e per year for having one fewer child applies to developed countries, where we expect per-capita energy consumption to be high. In less developed nations, where we expect lower per-capita energy consumption, the average savings for having one fewer child will be smaller. However, as their HDI continues to increase, the per-capita energy consumption in less developed nations eventually will rise and may approach the values occurring now in medium- or high-developed countries.
You can read the synopsis of the Wynes and Nicholas analysis in The Guardian here:
The mathematical approach for estimating the CO2-equivalent per year of an additional child is based on a 2009 paper by Paul A. Murtaugh and Michael G. Schlax entitled, “Reproduction and the carbon legacies of individuals,” and published in Global Environmental Change. The authors state:
“Here we estimate the extra emissions of fossil carbon dioxide that an average individual causes when he or she chooses to have children. The summed emissions of a person’s descendants, weighted by their relatedness to him, may far exceed the lifetime emissions produced by the original parent.”
“It is important to remember that these analyses focus on the carbon legacies of individuals, not populations. For example, under the constant-emission scenario, an extra child born to a woman in the United States ultimately increases her carbon legacy by an amount (9441 metric tons) that is nearly seven times the analogous quantity for a woman in China (1384 tons), but, because of China’s enormous population size, its total carbon emissions (from its human population) currently exceed those of the United States.”
“…..ignoring the consequences of reproduction can lead to serious under-estimation of an individual’s long-term impact on the global environment.”
The Arctic Council describes itself as, “….the leading intergovernmental forum promoting cooperation, coordination and interaction among the Arctic States, Arctic indigenous communities and other Arctic inhabitants on common Arctic issues, in particular on issues of sustainable development and environmental protection in the Arctic.” The council consists of representatives from the eight Arctic states:
Canada,
Kingdom of Denmark (including Greenland and the Faroe Islands)
Finland
Iceland
Norway
Russia
Sweden
United States
In addition, six international organizations representing Arctic indigenous people have permanent participant status. You’ll find the Arctic Council’s website at the following link:
One outcome of the Arctic Council’s 2004 Senior Arctic Officials (SAO) meeting in Reykjavik, Iceland was a call for the Council’s Protection of the Arctic Marine Environment (PAME) working group to conduct a comprehensive Arctic marine shipping assessment as outlined in the AMSP. The key result of that effort was The Arctic Marine Shipping Assessment 2009 Report (AMSA), which you can download here:
This report provided a total of 17 summary recommendations for Arctic states in the following three areas:
I. Enhancing Arctic marine safety
A. Coordinating with international organizations to harmonize a regulatory framework for Arctic maritime safety.
B. Supporting International Maritime Organization (IMO) standards for vessels operating in the Arctic.
C. Developing uniform practices for Arctic shipping governance, including in areas of the central Arctic ocean that are beyond the jurisdiction of any Arctic state.
D. Strengthening passenger ship safety in Arctic waters
E. Supporting development of a multi-national Arctic search and rescue capability.
II. Protecting Arctic people and the environment
A. Conducting surveys of Arctic marine use by indigenous people
B. Ensuring effective engagement with Arctic coastal communities
C. Identifying and protecting areas of heightened ecological and cultural significance.
D. Where appropriate, designating “Special Areas” or “Particularly Sensitive Areas”
E. Protecting against introduction of invasive species
F. Preventing oil spills
G. Determining impacts on marine animals and take mitigating actions
H. Reducing air emissions (CO2, NOx, SO2 and black carbon particles)
III. Building the Arctic marine infrastructure
A. Improving the Arctic infrastructure to support development while enhancing safety and protecting the Arctic people and environment, including icebreakers to assist in response.
B. Developing a comprehensive Arctic marine traffic awareness system and cooperate in development of national monitoring systems.
C. Developing a circumpolar environmental response capability.
D. Investing in hydrographic, meteorological and oceanographic data needed to support safe navigation and voyage planning.
The AMSA 2009 Report is a useful resource, with thorough descriptions and findings related to the following:
Arctic marine geography, climate and sea ice
History of Arctic marine transport
Governance of Arctic shipping
Current marine use and the AMSA shipping database
Scenarios, futures and regional futures to 2020 (Bering Strait, Canadian Arctic, Northern Sea Route)
Human dimensions (for a total Arctic population of about 4 M)
Environmental considerations and impacts
Arctic marine infrastructure
Four status reports from 2011 to 2017 documented the progress by Arctic states in implementing the 17 summary recommendations in AMSA 2009. The fourth and final progress report entitled, “Status of Implementation of the AMSA 2009 Report Recommendations; May 2017,” is available at the following link:
Through PAME and other working groups, the Arctic Council will continue its important role in implementing the Arctic Marine Strategic Plan. You can download the current version of that plan, for the period from 2015 – 2025, here:
For example, on 6 November 2017, the Arctic Council will host a session entitled, “The global implications of a rapidly-changing Arctic,” at the UN Climate Change Conference COP23 meeting in Bonn, Germany. For more information on this event, use this link: