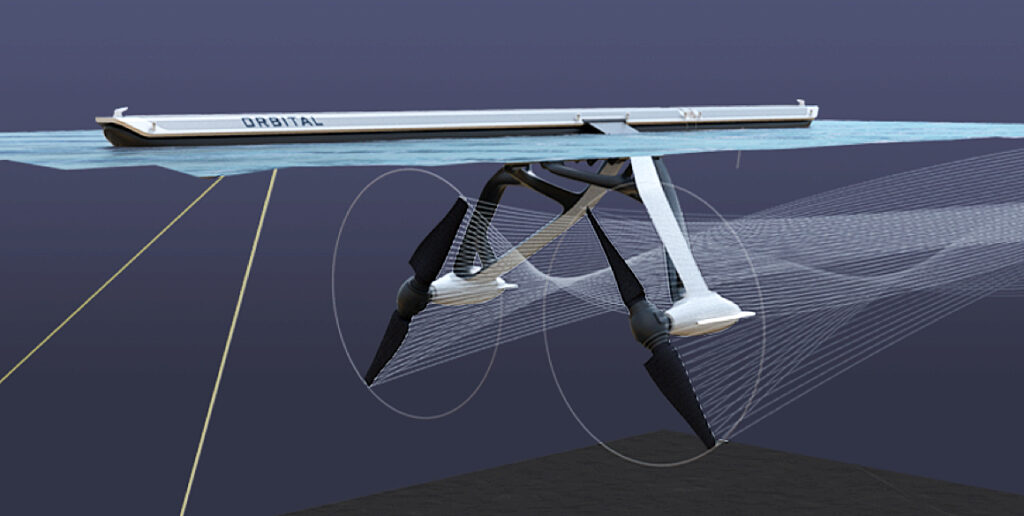
Orbital Marine Power (https://orbitalmarine.com) is developing a large, moored tidal turbine, the O2, which they claim is the most powerful tidal turbine in the world. The O2 soon will be deployed at sea off the Orkney Islands, northeast of Scotland.
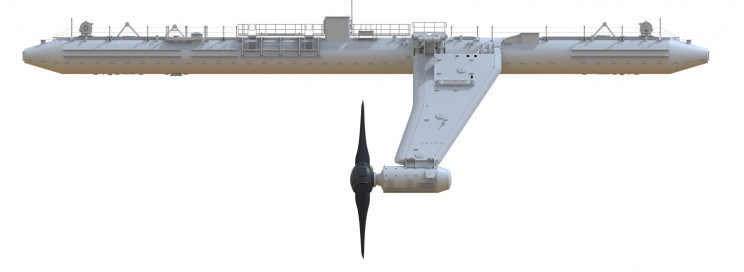
Rendering of the O2 tidal turbine. Source: Orbital Marine PowerSide view of the O2 tidal turbine. Source: Orbital Marine Power
Key features of the O2 tidal turbine are:
74 meter (243 ft) tubular steel hull with fore and aft mooring connections.
Hydraulically-actuated steel legs extending from the hull support the generator nacelles and rotors that are deployed underwater after the hull has been moored using a four-point mooring system.
Two 20 meter (65.6 ft) diameter, 2-bladed rotors give the O2 more than 600 m2 (6,458 ft2) of swept area to capture flowing tidal energy.
Blade pitch control enables bi-directional operation of the turbines with the hull in a fixed moored position (the hull doesn’t swing with the tide).
Each rotor drives a 1 MWe generator housed in the nacelle.
Power is delivered to shore by a submarine cable.
Here are three short videos that will give you a quick introduction to this remarkable machine:
“Orbital O2 2MW Tidal Turbine – World’s Most Powerful Tidal Turbine” (1:43 minutes), 2018 animation showing how the O2 design and how it will operate: https://www.youtube.com/watch?v=9hN3dBpPu8Q
O2 tidal turbine being moved in the shipyard in March 2021, prior to launch. The rotors are not yet attached to the nacelles.Source: Orbital Marine Power video screenshotO2 with the rotors attached in the water, under tow. Source: Orbital Marine Power
If the O2 demonstration proves to be successful, Orbital Marine Power plans to develop and deploy larger tidal turbines in the future.
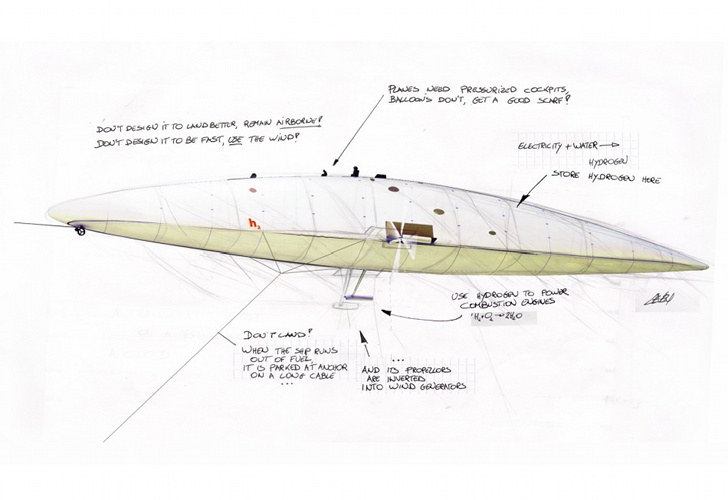
So, what does the O2 tidal turbine have in common with an airship? The Aeromodeller II airship design developed by Belgian engineer Lieven Standaert implements an airborne mooring as a means to generate power using two wind turbines while remaining aloft.
Ground anchor enables propellers to function as wind turbines for power generation while tethered. Source: Inhabit.com
Rendering of Aeromodeller II shown tethered. Source: www.aeromodeller2.be
Both the O2 tidal turbine and the Aeromodeller II airship are buoyant vehicles in their respective media (water and air, respectively) and both are designed to extract power from that medium while moored (or tethered). Important differences are that the O2 tidal turbine is permanently moored and supplies power to users on land. The Aeromodeller II drops its anchor periodically to recharge its own power system while tethered and then raises its anchor to continue its journey. You’ll find more information on the Aeromodeller II airship in my separate article here: https://lynceans.org/wp-content/uploads/2019/08/Aeromodeller-2-converted1.pdf
An FNPP is a transportable barge housing one or more nuclear power reactors that can deliver electric power and other services, such as low temperature process heat and/or desalinated water, to users at a wide variety of coastal or offshore sites. FNPPs are a zero-carbon energy solution that has particular value in remote locations where the lack of adequate electrical power and other basic services are factors limiting development and/or the quality of life.
After being manufactured in a shipyard, the completed FNPP is fueled, tested and then towed to the selected site, where a safe mooring provides the interfaces to connect to the local / regional electrical grid and other user facilities.
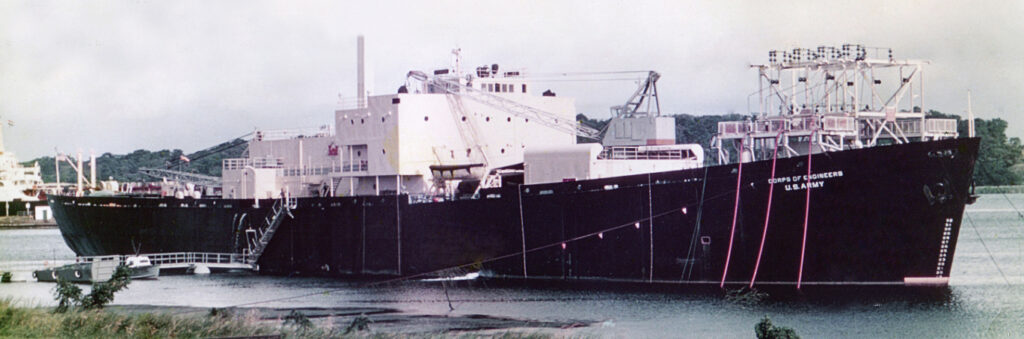
The US operated the first FNPP, Sturgis, in the Panama Canal from 1968 to 1975. Sturgiswas equipped with a 45 MWt / 10 MWe Martin Marietta MH-1A pressurized water reactor (PWR) that was developed under the Army Nuclear Power Program.
Sturgis moored in the Panama Canal. Source: Army Corps of Engg’s
Sturgis supplied electric power to the Panama Canal Zone grid, replacing the output of Gatun Hydroelectric Plant. This allowed more water from Gatun Lake to be available to fill canal locks, enabling 2,500 more ships per year to pass through the canal. After decommissioning, dismantling was finally completed in 2019.
2. Akademik Lomonosov – The first modern FNPP
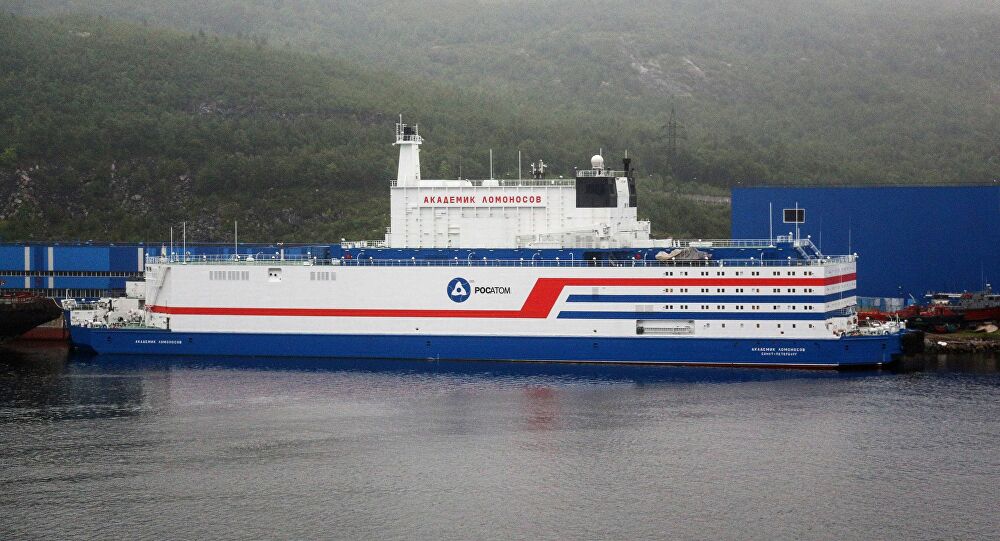
It wasn’t until 2019 that another FNPP, Russia’s Akademik Lomonosov, supplied power to a terrestrial electricity grid, 44 years after Sturgis. The Lomonosov is a one-of-a-kind, modern FNPP designed for operation in the Arctic. With two KLT-40S PWRs, Lomonosov supplies up to 70 MWe of electric power to the isolated Chukotka regional power grid or up to 50 Gcal/h of low temperature process heat at reduced electrical output to users in the industrial city of Pevek, near the eastern end of Russia’s Northern Sea Route.
Akademik Lomonosov at Pevek. Source: Sputnik / Pavel Lvov
Lomonosov started providing electricity to the grid on 19 December 2019 and regular commercial operation began on 22 May 2020.
3. FNPPs under development by several nations
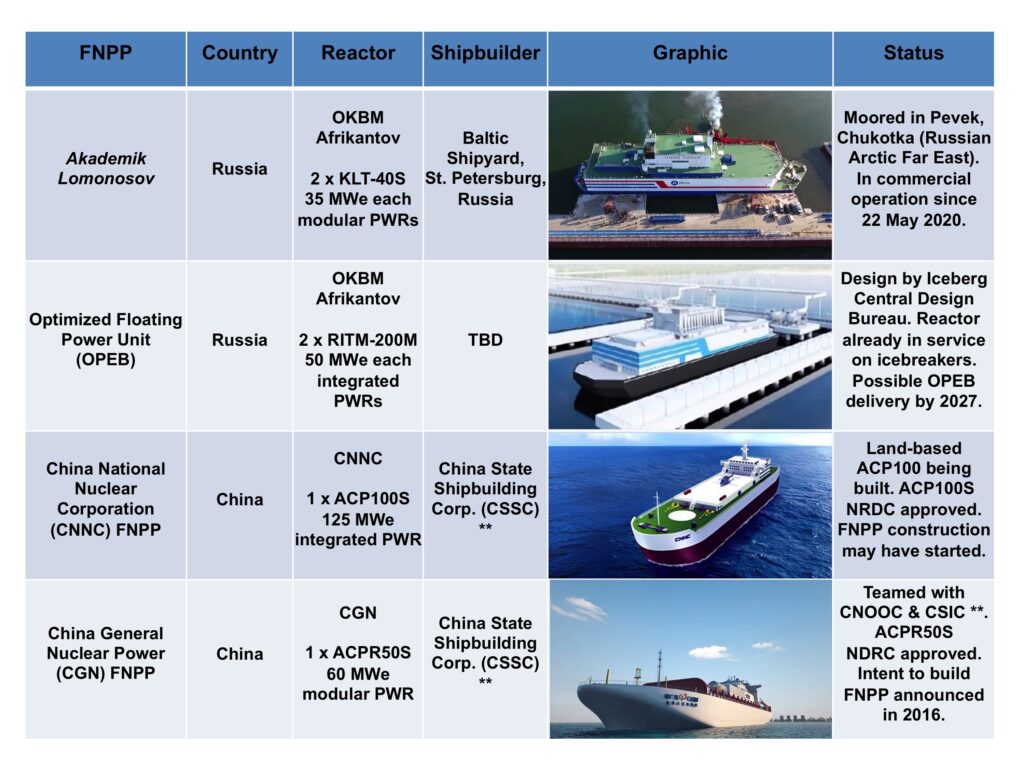
Several nations are developing new FNPP designs along with plans for their serial production for domestic and/or export sale. The leading contenders are presented in the following chart.
Floating Nuclear Power Plants in Operation & Under Development
Akademik Lomonosov and the first four new FNPP designs in the above chart use small PWRs in various compact configurations. PWRs have been the dominant type of power reactor worldwide since their introduction in naval reactors and commercial power reactors in the 1950s. The Seaborg power barges will use compact molten salt reactors (CMSRs) that have functional similarities to the Molten Salt Reactor Experiment (MSRE) that was tested in the US in the early 1960s.
Russia
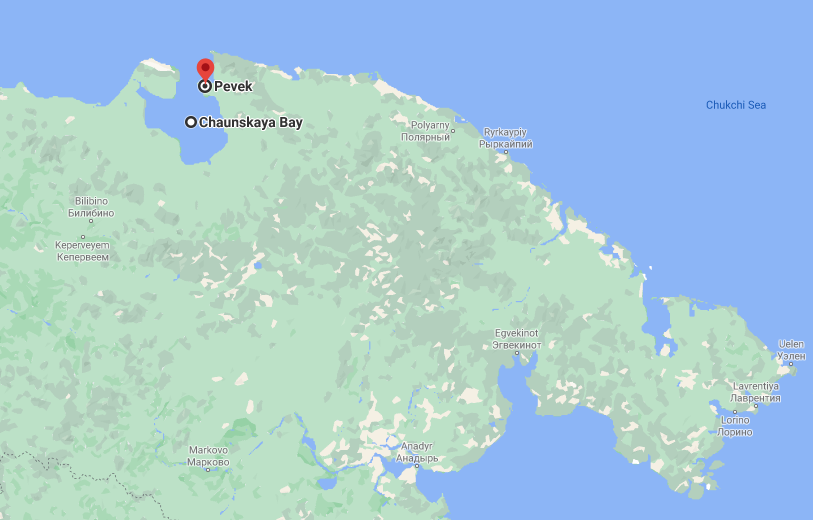
Russia is developing their 2nd-generation “optimized floating power unit” (OPEB) to deliver 100 MWe electric power, low temperature process heat and water desalination to support their domestic economic development in the Arctic. In November 2020, Rosatom director for development and international business, Kirill Komarov, reported that there was demand for FNPPs along the entire length of Russia’s Northern Sea Route, where a large number of projects are being planned. This was reinforced in May 2021, when Russia’s President Vladimir Putin endorsed a plan to deploy OPEBs to supply a new power line at Cape Nagloynyn, Chaunskaya Bay, to support the development of the Baimskaya copper project in Chukotka. The development plan calls for 350 MWe of new generation from nuclear or liquid natural gas (LNG) generators. Baimskaya currently is supplied from Pevek, where the Lomonosov is based.
Chaunskaya Bay & Pevek in Russia’s Arctic Far East. Source: Google maps
A version of the OPEB also is intended for international export and has been designed with the flexibility to operate in hot regions of the world. Bellona reported that “Rosatom has long claimed that unspecified governments in North Africa, the Middle East and Southeast Asia are interested in acquiring floating nuclear plants.”
China
In the 1960s, China Shipbuilding Industry Corporation (CSIC) set up the 719 Research Institute, also known as the Wuhan Second Ship Design Institute or CSIC 719, to develop applications for nuclear power technology in marine platforms. CSIC has become China’s biggest constructor of naval vessels, including nuclear submarines.
About a decade ago, China considered importing FNPP technology from Russia. In 2015, China’s National Development and Reform Commission (NDRC) agreed with a CSIC 719 design plan to develop an indigenous offshore marine nuclear power platform. This plan included both floating nuclear power plants and seabed-sited nuclear power plants. Today, part of this plan is being realized in the FNPP programs at China National Nuclear Corporation (CNNC) and China General Nuclear Power (CGN), two staunch competitors in China’s nuclear power business sector.
China included the development of CNNC’s 125 MWe ACP100S and CGN’s 65 MWe ACPR50S marine PWR plants in its 13th five-year plan for 2016 to 2020. The NDRC subsequently approved both marine reactor designs.
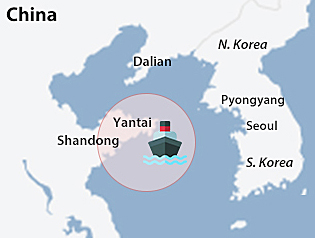
As an example of the magnitude of China’s domestic offshore market for FNPPs, the total installed fossil fuel-powered generation in China’s offshore Bohai oilfield was estimated to be about 1,000 MWe in 2020 and growing. Replacing just these generators and providing heating and desalination services for offshore facilities represents a near-term market for a dozen or more FNPPs. Other domestic application include providing these same services at remote coastal sites and offshore islands. China has announced its intention to construct a batch 20 FNPPs for domestic use. The Nuclear Power Institute of China (NPIC) has recommended installing the country’s first FNPP at a coastal site on the Yellow Sea near Yantai, Shandong Province. South Korea raised its objection to this siting plan in 2019.
Possible site for China’s first FNPP. Source: Pulse (22 Mar 2019)
Other possible FNPP deployment sites may include contested islands that China has begun developing the South China Sea. This is a very sensitive political issue that may partially account for why there has been very little recent news on the CNNC and CGN FNPP programs. Based on their development plans discussed about five years ago, it seemed that China’s first FNPP would be completed in the early 2020s.
In addition to their domestic applications, China has repeatedly expressed interest in selling their FNPPs to international customers.
South Korea & Denmark
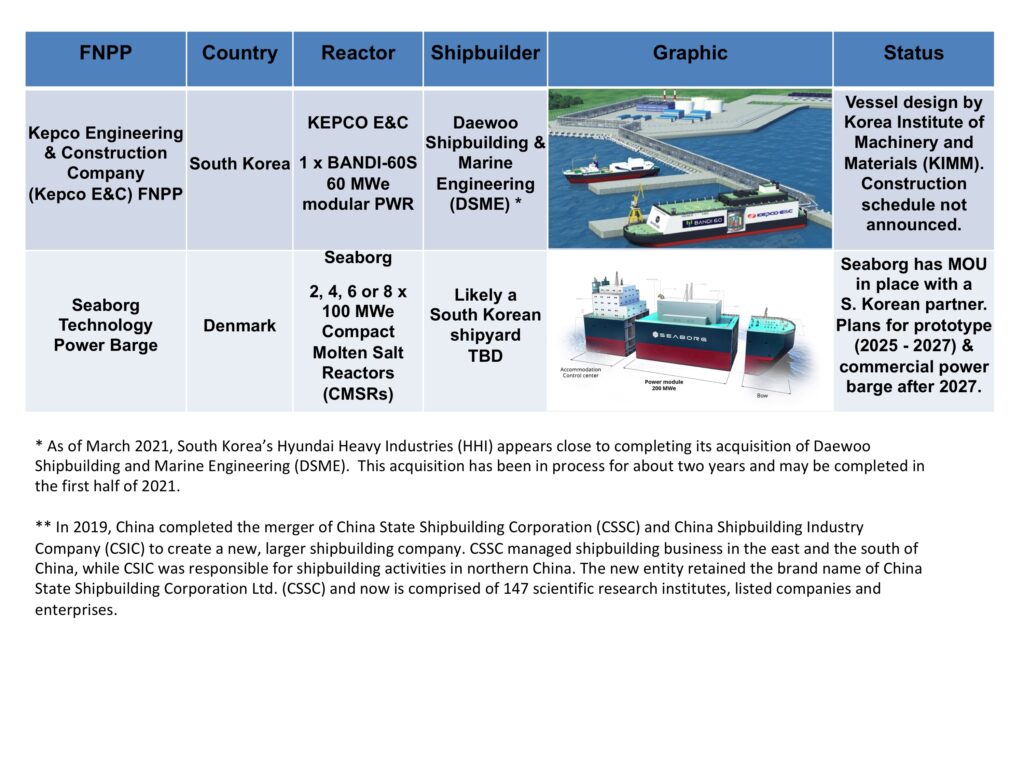
In the absence of clear domestic FNPP markets in South Korea and Denmark, KEPCO E&C and Seaborg Technologies are focusing on the export market, primarily with developing nations.
Details on modern FNPP designs
You’ll find more details on these new FNPPs in my separate articles at the following links:
All of the new FNPPs require regular reactor refueling and periodic maintenance overhauls during their long service lives. The periodic overhauls ensure that the marine vessel, the reactor systems and ship’s systems remain in good condition for their planned service life, which could be 60 or more years.
The FNPPs with PWRs have refueling intervals ranging from about 2 years (ACP100S) to as long as 10 years (RITM-200). Some of the PWR refuelings will be conducted dockside, while others will be conducted in a shipyard during a periodic maintenance overhaul. For Russian FNPPs, such overhauls (referred to as “factory repairs”) are scheduled to occur at 12-year intervals for the Lomonosov and 20-year intervals for the OPEB.
The fundamentally different Seaborg CMSR, with molten salt fuel, is refueled regularly while the reactor is operating. Periodic maintenance overhauls would still be expected to ensure the condition of the marine vessel, the reactor systems and ship’s systems.
With a fleet of FNPPs in service, most will be operating, while some are in the shipyard for their periodic maintenance overhauls. In addition, new FNPPs would be entering service periodically. When it is time to service an FNPP in a shipyard, it will be replaced by a different (existing or new) FNPP that is brought in to take its place.
At the end of its service life, an FNPP will be returned to a shipyard to be decommissioned, decontaminated and then dismantled, like Sturgis. Russia already has established special long-term spent fuel and radioactive waste storage facilities in mainland Russia. China, South Korea and Denmark will need to make similar provisions for the end-of-life processing and safe disposition of their retired FNPPs.
5. Economic issues
In March 2019, Jim Green wrote on what he called “the questionable economics of SMRs” in his article, “An obituary for small modular reactors.” One of his conclusions was that, “…in truth there is no market for SMRs.” Another conclusion was that “No-one wants to pay for SMRs. No company, utility, consortium or national government is seriously considering building the massive supply chain that is at the very essence of the concept of SMRs ‒ mass, modular factory construction. Yet without that supply chain, SMRs will be expensive curiosities.”
I might agree that this could be the case for land-based SMRs, but marine FNPPs are a different matter. In remote areas being considered for FNPP deployment, there probably are fewer energy options, energy price competition is a lesser concern, and an extended fuel supply chain is undesirable or impractical. Examples include FNPP applications supporting resource development along Russia’s Northern Sea Route and in China’s offshore waters. The domestic markets in both nations probably can support production runs of 10s of FNPPs. While this isn’t “mass production” in the sense of many heavy industries, it would certainly be a big enough production run to change the manufacturing paradigm in the marine nuclear industry and provide a real validation of the economics of SMRs.
6. International nuclear regulatory / legal / political issues
Deployment of the first modern FNPP, the Akademik Lomonosov, in the Arctic was accomplished under Russian domestic nuclear laws and regulations and, after the reactors were fueled, the transit to its destination was accomplished within Russian territorial waters. The final destination, Pevek, is about 980 km (609 miles) from the Bering Strait and the nearest international boundary. Not without controversy, particularly among Scandinavian nations, Lomonosov’s deployment was straightforward after the vessel completed all stages of licensing and regulatory reviews required in Russia. Now Lomonosov has been commissioned and is setting an example for the rest of the world by operating successfully in a remote Arctic port.
Except for Russia’s nuclear-powered icebreaking vessels, there have been no other civilian nuclear vessels in service since Japan’s Mutsu retired in 1992. For almost 30 years, there has been no need to establish and maintain a comprehensive international civilian nuclear vessel regulatory and legal framework.
In her August 2020 article, “Legal framework for nuclear ships,” Iris Bjelica Vlajić reports that the main international documents regulating the use of civil nuclear ships are:
UN Convention on the Law of the Sea (UNCLOS)
IMO Convention for the Safety of Life at Sea (SOLAS)
IMO Convention on The Liability of Operators of Nuclear Ships and the Code of Safety for Nuclear Merchant Ships
Further FNPP deployment along Russia’s arctic coast and initial FNPP deployment in China’s territorial coastal waters can be accomplished under the respective nation’s domestic nuclear laws and regulations. It’s easy to imagine that a range of international issues will arise as FNPP deployment becomes more widespread, in situations like the following
An FNPP is deployed to a site close to an international border.
An FNPP is deployed in a sensitive international ecosystem.
A fueled FNPP from any nation needs to transit an international strait or an exclusive economic zone (EEZ) of another nation enroute to its destination.
An FNPP is deployed to an island that is contested by one or more other nations (i.e., several islands and island groups in the South China Sea).
There has been speculation recently that the sensitivity of the last issue, above, may be contributing to increased secrecy in the last couple of years related to China’s FNPP programs.
As FNPP deployment expands, the international community will be playing catch-up as the UN, IMO, IAEA and others contribute to developing a modern nuclear regulatory and legal framework for FNPPs.
7. Conclusions
In the next decade, I think it’s very likely that two or more of the new FNPP designs will enter service. The leading contenders seem to be Russia’s OPEB and China’s ACP100S FNPP. It remains to be seen if economic issues and/or international nuclear regulatory / legal / political issues will stand in the way of eventual FNPP deployments to sites around the world.
“Advances in Small Modular Reactor Technology Developments – A Supplement to: IAEA Advanced Reactors Information System (ARIS) 2020 Edition,” International Atomic Energy Commission, 2020: https://aris.iaea.org/Publications/SMR_Book_2020.pdf
Other FNPP designs and concepts for “transportable reactor units” (only the nuclear steam supply section of an FNPP) and seabed-sited nuclear power plants are included in my 2018 post: “Marine Nuclear Power: 1939 – 2018:” https://lynceans.org/all-posts/marine-nuclear-power-1939-2018/
Goodbye Indian Point 2 and 3. Your contributions of zero-carbon energy to New York’s “clean energy grid of the future” will be greatly missed.
In an average year, the 1,028-MWe Indian Point Unit 2 nuclear power plant and the 1,041-MWe Unit 3 operated at capacity factors of greater than 90% and delivered more than 18,000 GWh (thousand MWh) per year of zero-carbon electricity to the New York state electrical grid. Unit 2 was shutdown on 30 April 2020 and Unit 3 followed on 30 April 2021. Prior to its final shutdown, Unit 3 had run continuously for 753 day, which set a new nuclear industry world record. The ANS Newswire reported, “The plant’s closure is the result of a settlement agreement reached in 2017 by Entergy and the State of New York and environmental groups opposed to Indian Point’s operation. According to an April 28 (2021) news release from Entergy, its decision to accede to the shutdown was driven by a number of factors, including ‘sustained low current and projected wholesale energy prices that reduced revenues.’”
Now, Indian Point Units 2 and 3 are delivering exactly zero zero-carbon energy. I imagine the environmental groups involved in the settlement agreement are hailing the shutdowns as great achievements. I think the shutdowns represent remarkable shortsightedness (I’m using the kindest words I can think of) on the parts of Entergy and the State of New York.
New York Independent System Operator, Inc. (NYISO) operates the New York state electrical grid, which is divided into two main parts, “downstate”, which includes New York City and the Indian Point Units 2 and 3 nuclear power plants, and “upstate,” which includes the Nine Mile Point and Ginna nuclear power plants. I credit NYISO with providing the public with excellent reports that summarize their annual grid and electrical market performance. In their Power Trends 2021 report, NYISO states: “The NYISO is committed to offering the tools, skills, independent perspectives, and experience necessary to transition to a zero-emission power system by 2040.”
I’ll refer to two of those NYISO Power Trend reports to illustrate the impact of closing the Indian Point 2 and 3 nuclear power plants on progress toward New York’s “clean energy grid of the future.” Using their own graphics, let’s take a look at how NYISO was doing in 2019 (with both Indian Point Unit 2 & 3 operating), 2020 (Unit 2 shutdown in April), and their projected performance in summer 2021 (after Unit 3 shutdown).
2019: New York statewide: 58% zero-emission; Upstate: 88% zero-emission; Downstate: 29% zero-emission
Source: NYISO Power Trends 2020
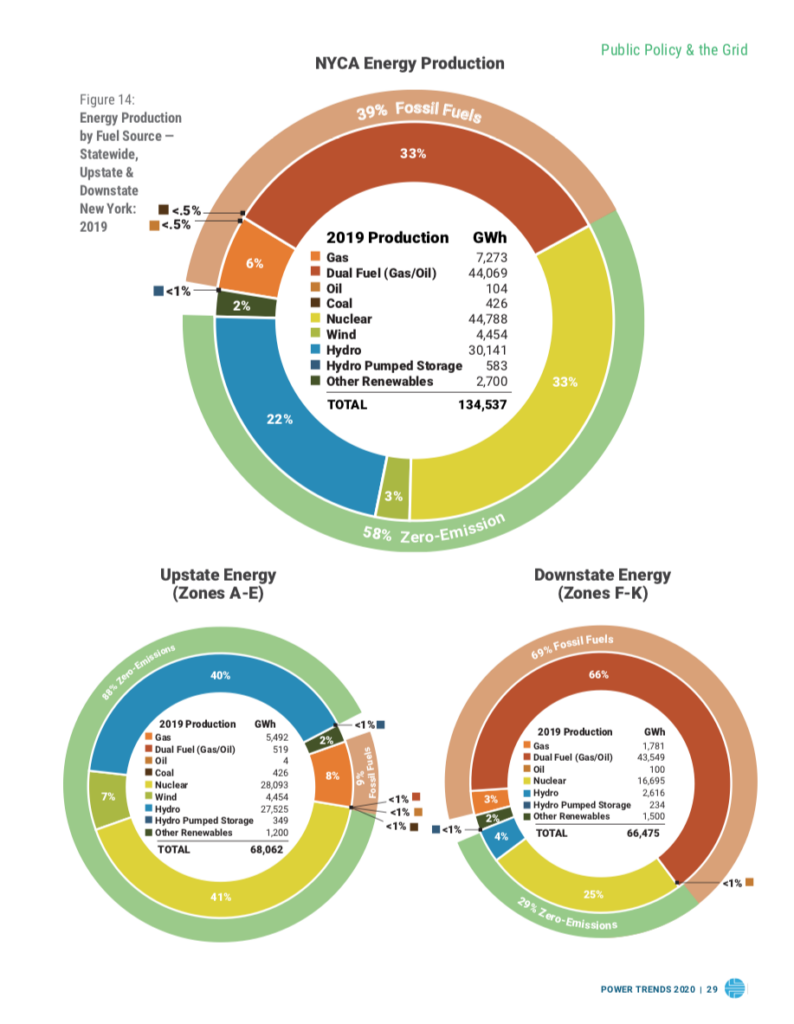
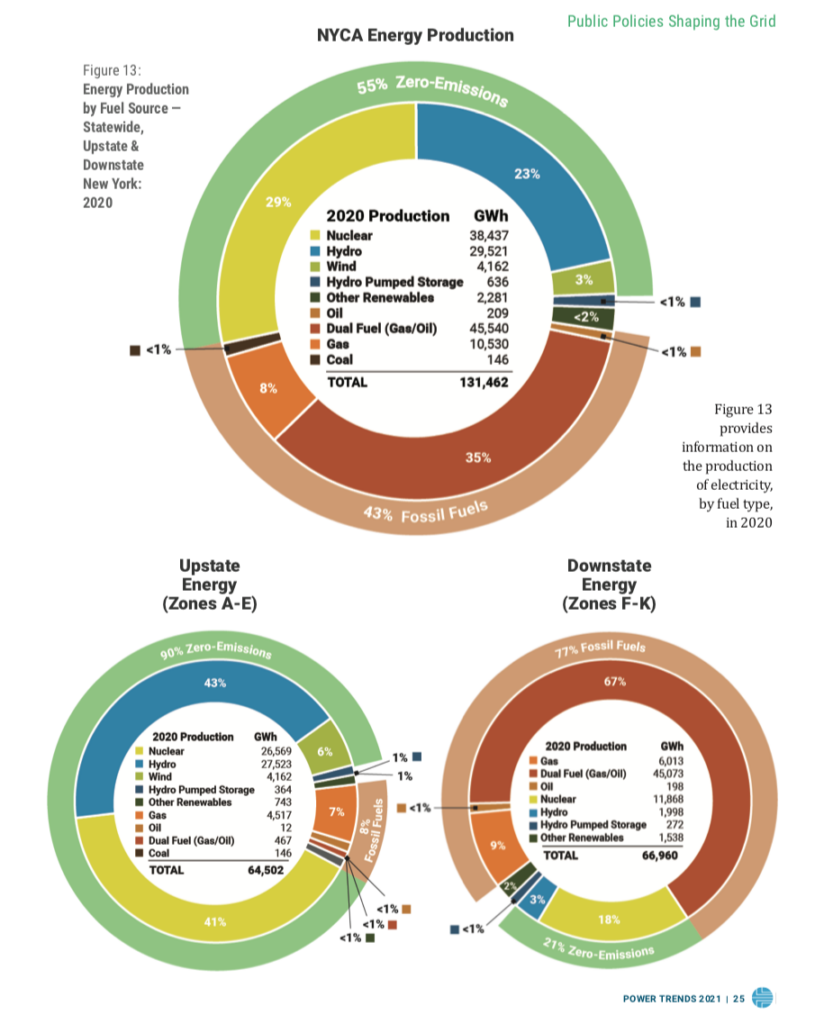
2020: New York statewide: 55% zero-emission; Upstate: 90% zero-emission; Downstate: 21% zero-emission
Source: NYISO Power Trends 2021
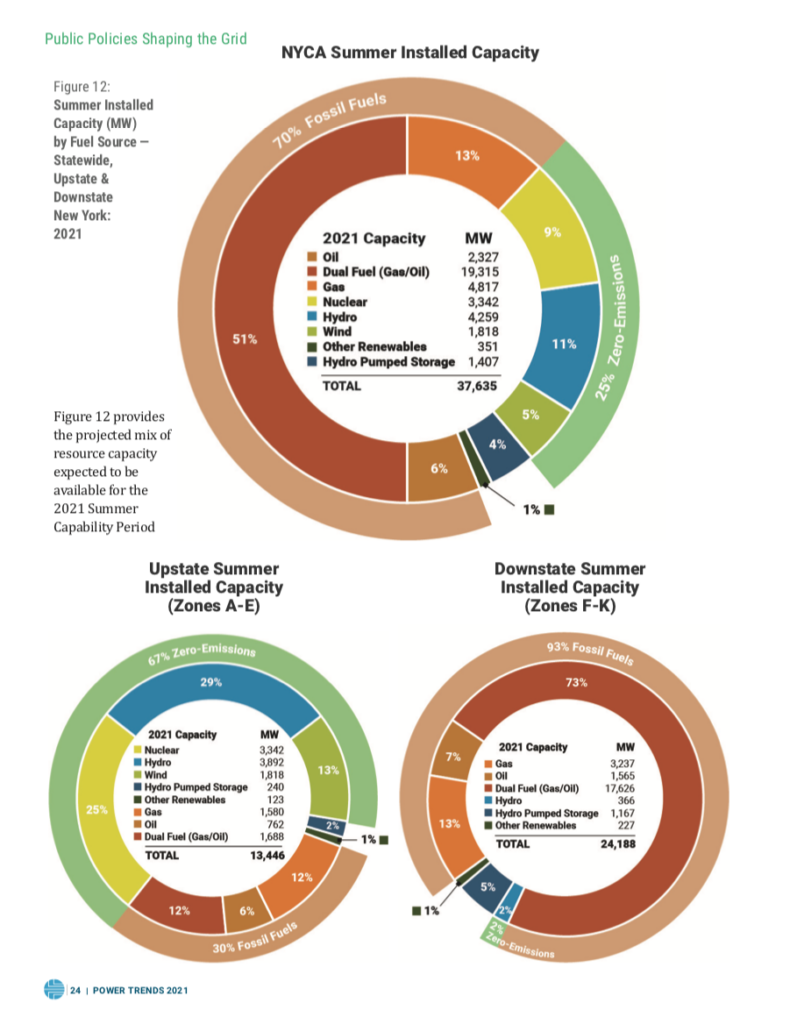
2021: New York statewide (projected, summer): 25% zero-emission; Upstate: 67% zero-emission; Downstate: 2% zero-emission
Source: NYISO Power Trends 2021
Anyone who can draw a tend chart from 2019 to 2021 using the above three years of data and then extrapolate to the State’s goal of a zero-emission power system by 2040 can see that New York’s plans for its “clean energy grid of the future” have come off the rails. The slope of the curve to get from where NYISO is today to the State’s 2040 goal has gotten a lot steeper, and that translates directly into the cost of achieving that goal. Surely the New York ratepayers served by NYISO will pay the price in the years ahead as the State works to improve its zero-emission performance. Even getting back to where they were in 2019 would be a big improvement.
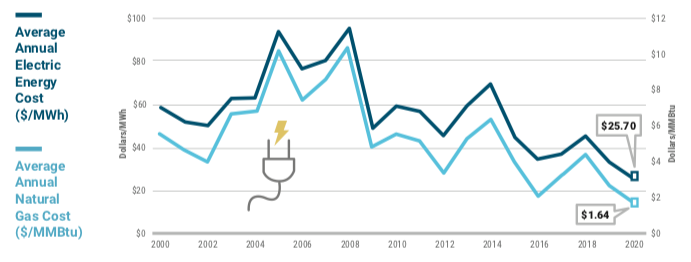
So, I reiterate that the Indian Point Unit 2 and 3 shutdowns represent remarkable shortsightedness on the parts of Entergy and the State of New York, both of which have undervalued two reliable sources of bulk zero-emission electric power generation, and have failed to appreciate Indian Point’s potential long-term contribution to achieving the State’s 2040 zero-emission power system goal (at a rate of more than 18,000 GWh per year). New York State has failed to step up and provide economic incentives to enable Entergy to compete effectively against fossil fuel generators that have been benefiting for more than a decade from the low cost of natural gas fuel. In the wholesale market, the fossil generators can undercut nuclear generators and drive the cost of electricity down to levels that no longer support the continued operation of zero-emission nuclear power plants. These trends can be seen in the following NYISO chart.
Source: NYISO Power Trends 2021
Beyond the significant loss of zero-carbon electrical generation capacity, the closure of a nuclear power plant will have significant local and statewide impacts through the loss of many full-time and temporary jobs, associated wages, and income and property taxes. You’ll find a thorough discussion of these issues in the May 2021 ANS Nuclear Newswire article, “The consequences of closure: The local cost of shutting down a nuclear power plant,” at the following link: https://www.ans.org/news/article-2877/the-consequences-of-closure-the-local-cost-of-shutting-down-a-nuclear-power-plant/
R.I.P. Indian Point Units 2 and 3.
Update – 29 July 2022
In July 2022, the American Nuclear Society reported, “Stats show that closing Indian Point was a ‘mistake’ for New York.” I’d say that’s putting it mildly.
As the world generates an increasing fraction of its electricity from intermittent renewable energy sources, there currently are growing problems with grid stability and there will be problems delivering electric power on demand 24/7 unless the huge swings in intermittent renewable generating capacity are brought under control.
The nature of the intermittent photovoltaic (PV) energy generation problem is described in a 2020 paper by Alberto Boretti, et al., in which the authors note, “Because of increasing uptake (of electricity) and the phasing out of back-up conventional power plants producing energy on demand, there is the necessity to study the current variability of the (PV) capacity factors based on the actual energy production.” The authors concluded, “While the best-performing (PV) facilities achieve annual capacity factors of about 32-33%, the average annual capacity factor is less than 30%, at about 26-27%.”
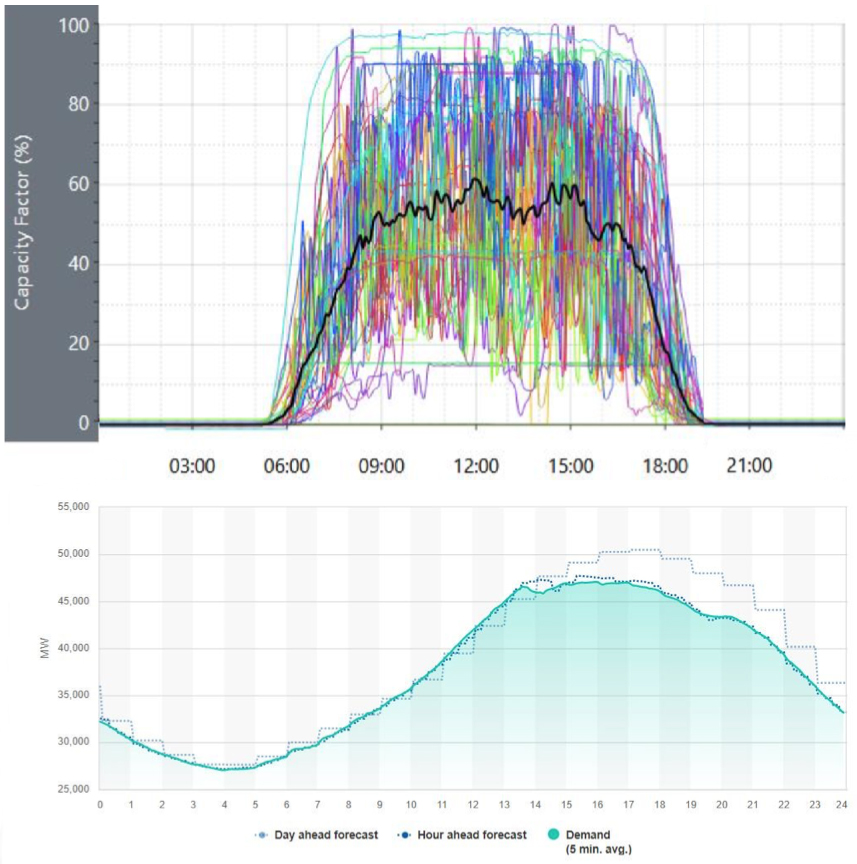
During the course of an average day, PV generation can go from 0% at night to 100% at mid-day, with “tails” as generation capacity grows in the morning and falls off in the evening, and variability during the day due to weather. Using Australian high-frequency capacity factor data (because similar data were unavailable in the US), Alberto Boretti, et al., developed the following chart that compiles the capacity factors from many individual PV plants and computes their average capacity factor (the dark line in the top chart), which is a measure of the average PV generating capacity actually delivered to the grid over the course of a 24 hour period.
The second chart shown below shows the actual load demand in megawatts (MW) from the California grid operator, CAISO, for 18 August 2020, a hot day with high load demand. The broad (5-hour) peak mid-day demand on the CAISO grid was about 47,000 MW. Minimum demand at about 4 AM was about 27,000 MW.
Comparison of a representative PV generation cycle & grid demand cycle. Sources: (Top) adapted from Alberto Boretti, et al. (2020), (Bottom): CAISO via GreenTechMedia (19 Aug 2020)
Hopefully, you see the problem. In this case for PV generation, the generation cycle is not in sync with the demand cycle. If states and nations are unwilling to address this mismatch with reliable generators that can be started on demand, then large-scale deployment of long-duration, grid-scale energy storage systems will be needed to meet electricity demand 24/7.
What do “long duration” and “grid-scale” mean? Look at the above curves and you can see the answers for yourself. How long is there no PV generation between sunset and sunrise? It’s 10 to 14 hours in Southern California, depending on the time of year. How much is 10% of peak demand on the CAISO grid? On 18 August 2020, that would have been about 4,700 MW, about the generating capacity for four nuclear power plants (but California only has two nuclear power plants, and those will be retired in 2024 and 2025). My point is that even 10% of peak demand is a big number and to store just one hour of that requires 4,700 MWh (megawatt-hours) of storage. The numbers only get bigger as you look at the amount of energy storage needed to meet demand for several hours, or over night.
To establish a point of reference regarding grid-scale energy storage capacity, here are a few important points.
California has a goal of having an energy generation portfolio with 60% renewable generation sources by 2030. That equates to a renewable generating capacity of up to 28,000 MW during the broad mid-day peak demand period on a hot day.
California has a goal of having 10,000 MW of “energy storage” by 2030, but they haven’t defined the needed storage capacity in terms of MWh. Most of the battery energy storage systems (BESS) delivered to date in California can operate at rated power for only 1 – 2 hours. That can help reduce short-term power peaking problems during the day, but is not useful for long-term power delivery at night.
The Gateway Energy Storage project in San Diego County, CA, currently the largest BESS in the world. It is rated a 250 MW with an energy storage capacity of about 250 MWh. That will supply about 0.5% of CAISO’s peak grid demand for less than one hour because the battery can’t be fully discharged. In terms of grid-scale energy storage requirements, this “world’s largest energy storage project” is still pretty small. It represents less than 10% of the output of the Diablo Canyon nuclear power plant for one hour, after which the BESS would be exhausted while Diablo Canyon would continue delivering electricity for the remaining 23 hours of the day, generating about 54,000 MWh per day with zero carbon emissions, day after day.
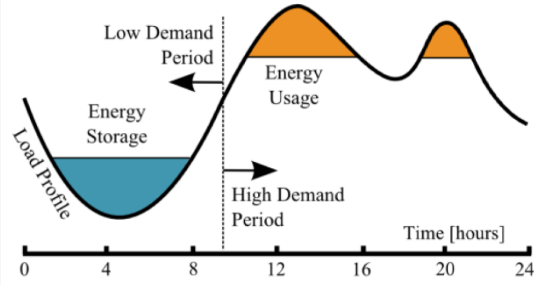
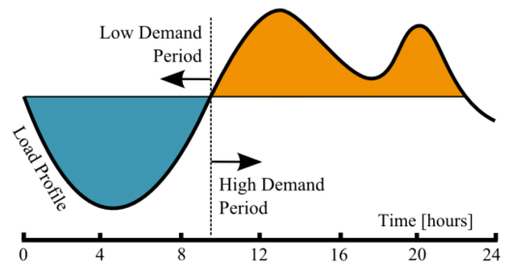
An approach for using energy storage systems to help meet daily peak load demand is shown in the following graphs, with energy storage from online power generators early in the day (blue) and stored energy dispatch (orange) later in the day to supplement online power generators and reduce the peak generation demand. In the top curve, the online power generators need to follow the load profile curve between the lower and upper limits set by the “energy storage” and “energy usage” horizontal lines. With more energy storage capacity, the second graph illustrates the case of constant online generation capacity (the single horizontal line), with all demand variability being absorbed by charging and discharging energy storage systems.
Examples of daily load leveling using electrical energystorage systems to absorb variability in demand (more storage available in the bottom graph) Source, both graphics: Siraj Sabihuddin, et.al. (2014)
As electric vehicles proliferate, the peak of the demand curve will likely continue longer into the evening and night as commercial and private vehicles are recharged. The mismatch between the generation cycle of intermittent PV energy sources and the demand curve will be getting larger.
In this post, we’ll take a look two technologies for long-duration, grid-scale energy storage systems:
Advanced compressed air energy storage (A-CAES)
Solid medium gravity energy storage
Both of these energy storage systems convert electrical energy into potential energy that can be released on demand, for example, as high-pressure air or a large suspended weight. As you might expect, these are not “perpetual motion” systems and energy is consumed with each energy storage and discharge cycle. That means that less electricity can be dispatched than was originally input for storage. High cycle efficiency becomes a very important performance parameter for energy storage systems. Manchester University, UK, reported on a BESS that had round-trip energy losses between 9.6% and 12.5% for a variety of full charge / discharge cycles, placing BESS cycle efficiency at between 87.5% and 90.4%.
The A-CAES and solid medium gravity energy storage technologies appear to have long operating lifetimes, which could give them an advantage over battery energy storage systems. The National Renewable Energy Laboratory (NREL) has determined that current technology lithium-ion battery life in BESS applications is limited to about 10 years with active thermal management and restricted cycling, and about 7 years without thermal management. Over the operating life of a grid-scale BESS, the batteries will have to be replaced periodically, adding to BESS life-cycle cost.
Keep in mind why these energy storage systems are needed. Going “green” is not simple, and relying on power generation from intermittent renewable energy sources comes with the obligation to deploy long-duration, grid-scale energy storage systems to ensure that electricity demand can be met 24/7. Rest assured, this will all show up on your future electricity bills.
2. Advanced compressed air energy storage (A-CAES)
Toronto-based Hydrostor (https://www.hydrostor.ca/company/) is a leading developer of Advanced Compressed Air Energy Storage (A-CAES) systems. Their first system entered service in 2019. Several other A-CAES systems are being developed.
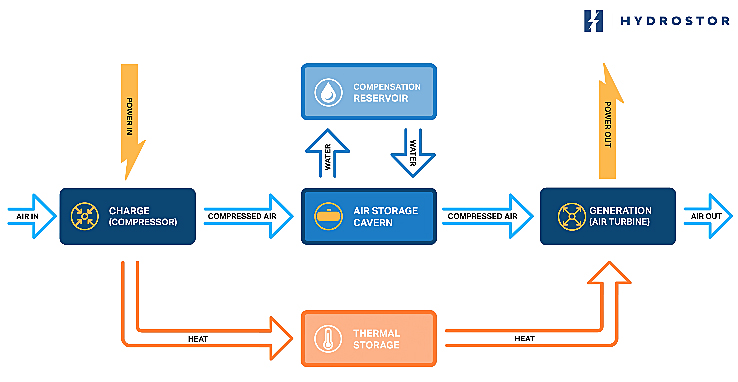
The basic A-CAES process is shown in the following diagram.
A-CAES process flow. Source: Hydrostor.
Surplus electric generating capacity is used to compress ambient air to produce heated compressed air. A thermal management system captures and stores the heat produced during compression as sensible heat. The cooled, compressed air is stored in a purpose-built underground storage cavern that is maintained at constant pressure by the hydrostatic head of water in a standpipe connected to a compensation reservoir on the surface. As the storage cavern is charged, water in the cavern is displaced and flows up the standpipe, into the compensation reservoir.
When there is a demand for energy from the storage system, compressed air is released from the underground air storage cavern, reheated by the thermal management system and discharged through an air turbine to generate electricity. Water flows back from the compensation reservoir on the surface into the storage cavern to maintain the pressure of the air remaining in storage.
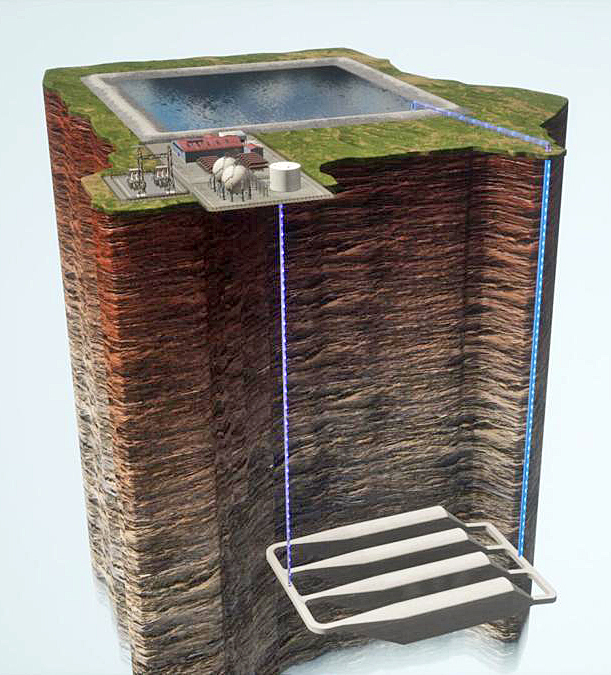
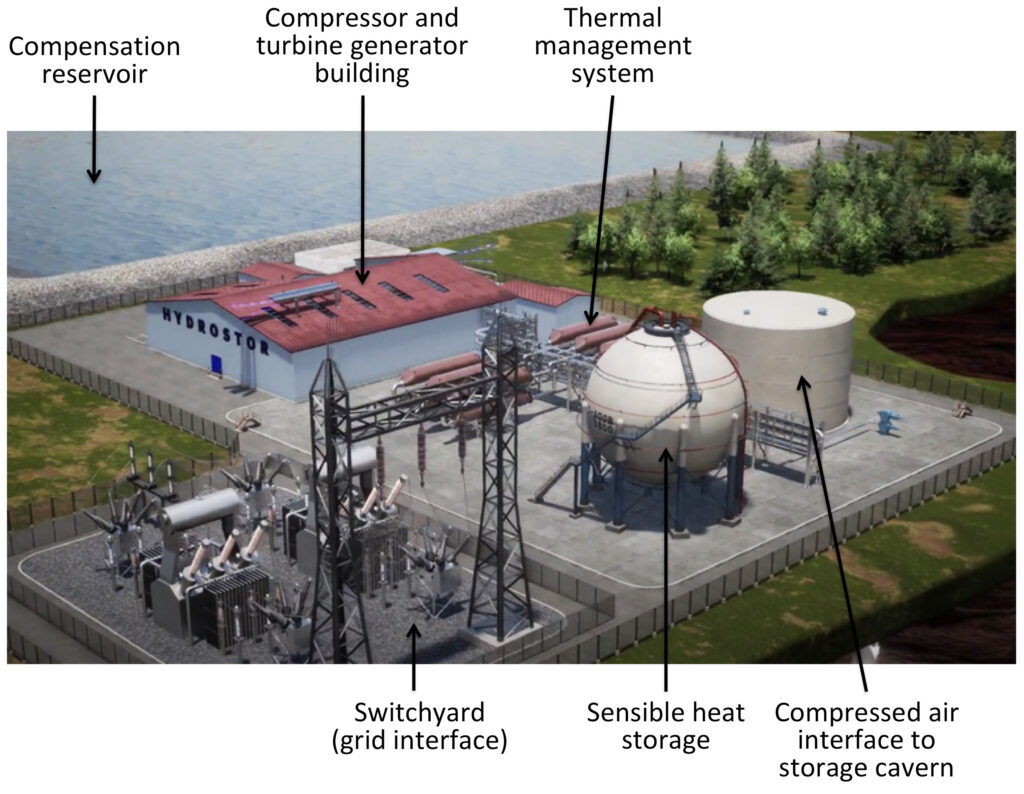
A representative Hydrostor installation showing the purpose-built underground air storage cavern and its bi-directional interfaces with the compressed air system (purple line) and the hydrostatic compensation reservoir on the surface (blue line). Source: HydrostorGeneral arrangement of the aboveground facilities of a representative A-CAES facility. Source: Adapted from Hydrostor
This A-CAES process is entirely fuel-free and produces zero greenhouse gas emissions. The operation of the Hydorstor system is explained in the 2021 video, “How Hydrostor Is Enabling The Energy Transition” (3:54 minutes) at the following link: https://www.youtube.com/watch?v=cOWjwwKSR78
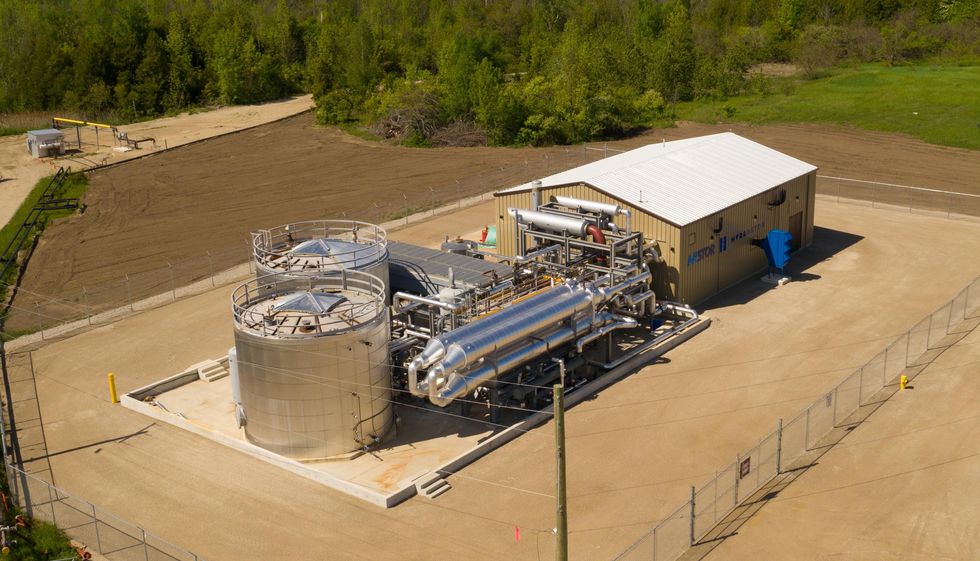
Hydrostor’s Goderich A-CAES Facility
The Goderich A-CAES Facility, which went into service in 2019 in Goderich, Ontario, Canada, is the world’s first commercially contracted A-CAES facility. It is in regular service on Ontario’s Independent Electricity System Operator (IESO) grid.
This utility-scale system can deliver a peak power output of 1.75 MW, has a maximum charge rate of 2.2 MW, and has more than 10 MWh of energy storage capacity. The system can deliver rated power for 5 to 6 hours.
Hydrostor notes that this use of A-CAES technology “is a significant achievement, conforming to all interconnection, uptime, performance and dispatch standards as set out by the IESO. Hydrostor’s Goderich energy storage facility proves out the ability of Hydrostor’s A-CAES technology to fully participate in and deliver a range of valuable grid services to electricity markets.”
The aboveground portion of the Goderich A-CAES Facility. Source: Hydrostor
Rosamond Energy Storage Project
Hydrostor, with partners Pattern Development and Meridiam, is developing the much larger Rosamond Energy Storage Project in Kern County, CA. This A-CAES project will have a rated power of 500 MW and an energy storage capacity of 4,000 MWh, which will provide for 8 hours of operation at rated power. This project was announced on 29 April 2021 and is expected to enter service in 2026. Customers would include the Los Angeles Department of Water and Power and the operator of the state power grid, CAISO.
Pumped storage hydroelectric (PSH) is a type of gravity energy storage system that has been in existence for many decades. Such systems are dependent on regional topography with a suitable water source in proximity to a suitable elevated water storage basin. Surplus electric power is used to pump a large volume of water up to the elevated storage basin. Later, water is released through a penstock to a hydroelectric turbine to generate electricity on demand. Among current energy storage technologies, the Electric Power Research Institute (EPRI) rates PSH highest as a long-duration, grid-scale energy storage system. General Electric reports that the round-trip energy efficiency of PSH typically is about 80%.
The solid medium energy storage systems work on a similar principle of using surplus power to raise a solid mass to a relatively high elevation and later release the suspended mass and use it to mechanically drive a generator during its controlled descent. Two firms working on this type of gravity energy storage system are Energy Vault and Gravitricity. Unlike PSH, their gravity energy storage systems are not dependent on the local topography. Here’s a brief look at their systems.
Energy Vault
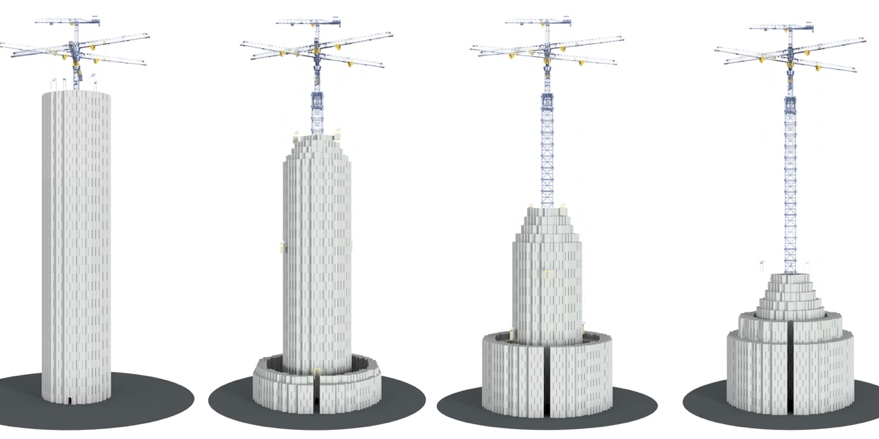
California-based startup incubator Idealab (https://www.idealab.com), developed an energy storage concept that uses a tall tower topped with tower cranes as a platform for systematically building and deconstructing stacks of regularly shaped heavy masses (bricks). Potential energy is stored as bricks are raised and emplaced at a higher elevation. Energy is recovered when a brick at a higher elevation is picked up and lowered while using the suspended mass to drive a generator, a bit like the regenerative braking system on a Toyota Prius. With multiple cranes in use to move the bricks, energy storage and discharge rates can be adjusted to match operational needs until the stack of bricks is completely constructed (fully charged) or deconstructed (discharged). The Swiss firm Energy Vault (https://energyvault.com) is commercializing this gravity energy storage technology.
(L to R) Deconstructing an Energy Vault tower to recover energy. Source: Business Wire
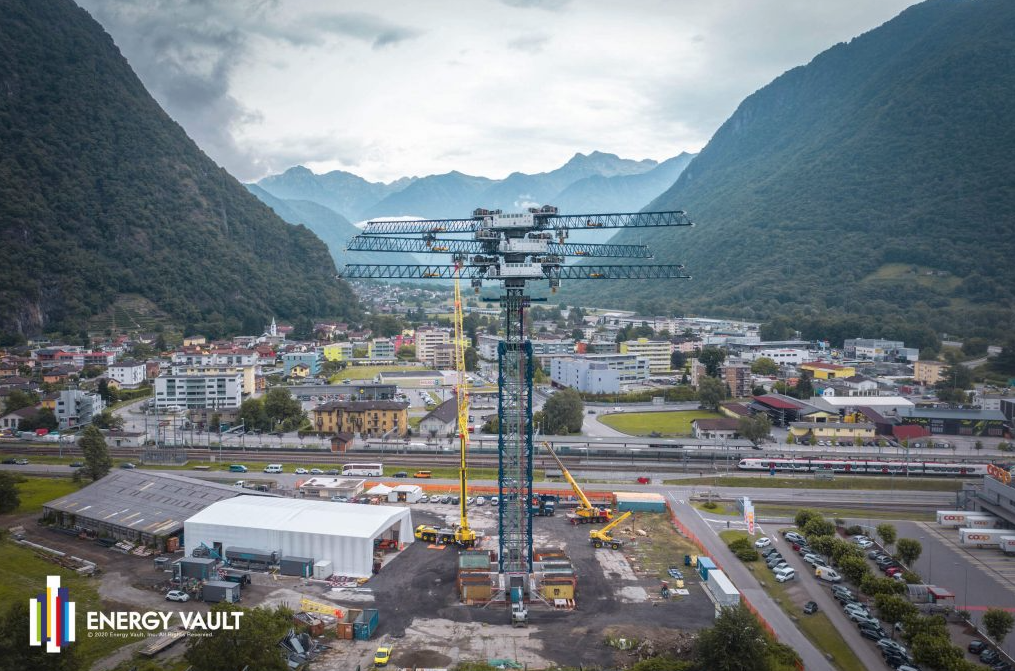
In partnership with Italian energy company ENEL, Energy Vault built a sub-scale demonstration system in Ticino, Switzerland and has operated the system connected to the regional grid since July 2020.
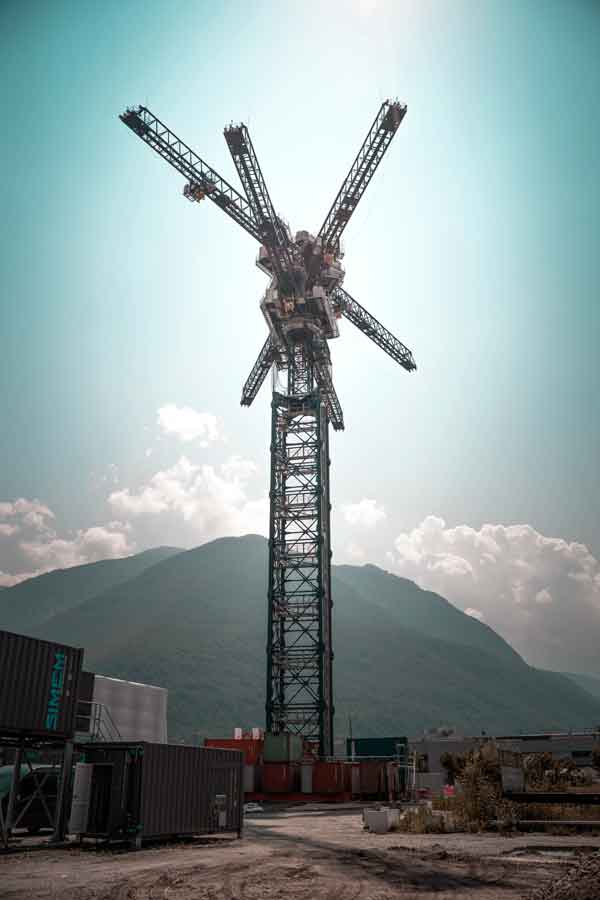
Energy Vault’s demonstration system in Ticino, Switzerland. Source: Energy Vault
The 110 meter (361 ft) tall unit can store 35 MWh of energy.Energy Vault reported that, from proposition to working prototype, the demonstration system took about nine months to complete and cost less than US $2 million.
Energy Vault’s demonstration system in Ticino, Switzerland, not including the 35 metric ton bricks. Source: Energy Vault
Lessons learned from the demonstration unit include:
A tower can be erected quickly; the cranes can be delivered within months and erected within weeks.
The heavy masses (35 ton composite bricks) can be made from a variety of materials, including concrete construction debris that would otherwise go to a landfill. At a coal plant site, the bricks could be made with coal ash aggregate.
The mechanical systems do not degrade, providing a long operating life of the project.
Specially engineered control software ensures the bricks are placed in exactly the right location each time.
Round-trip cycle efficiency is between 80% and 90%.
Energy Vault claims that they have created the world’s only cost-effective, utility-scale gravity-based energy storage system that is not dependent on land topography or specific geology underground.
With its modular, scalable system design, Energy Vault expects to offer energy storage systems with a range of power ratings, from 4 to 8 MW, and energy storage capacities, from 20 to 80 MWh. These systems can serve as long-duration power sources, delivering rated power for hours.
Gravitricity
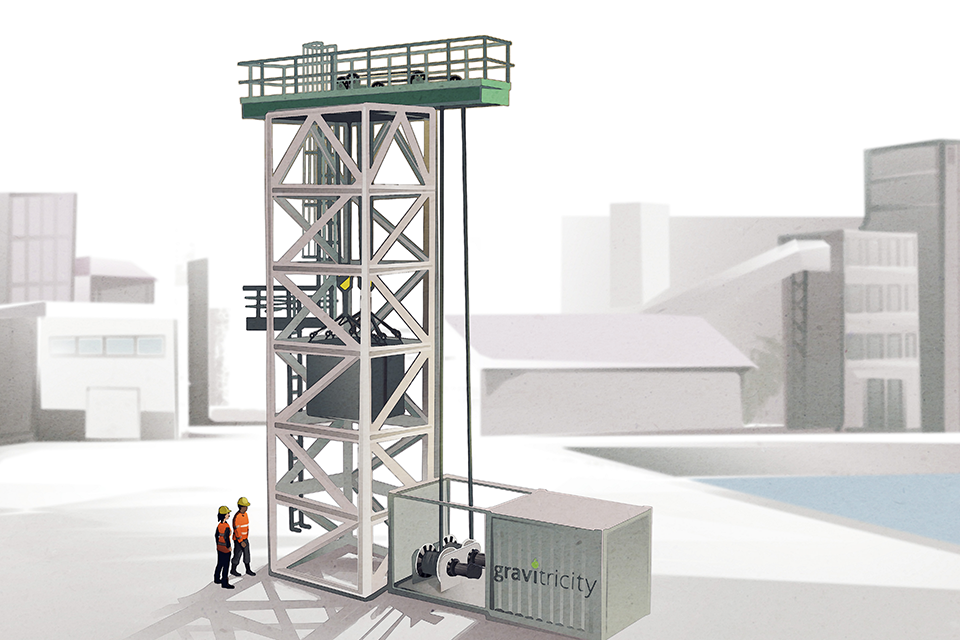
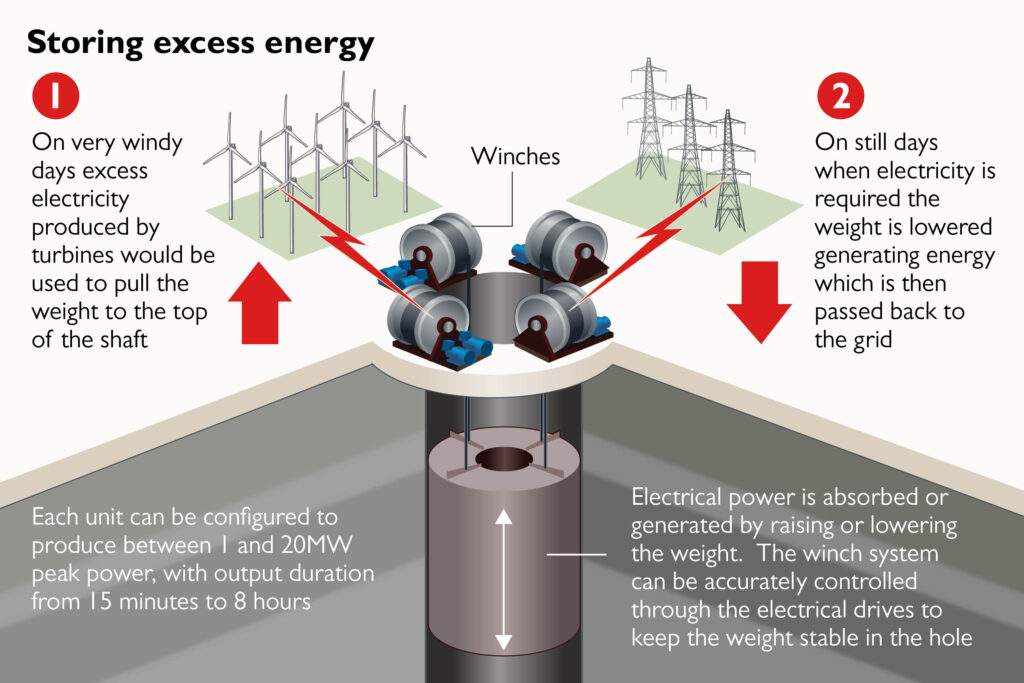
Scottish firm Gravitricity Ltd. (https://gravitricity.com) is developing a novel mechanical energy storage technology in which excess electric power is used to power winches that raise a heavy mass inside a deep shaft. At its new, higher elevation, potential energy has been stored in the heavy mass. Electricity is generated when needed by releasing the heavy mass and allowing it to drop under the influence of gravity, but restrained by a braking system that extracts kinetic energy as electricity until the heavy mass makes a controlled stop at the bottom of the shaft, or at some intermediate height.
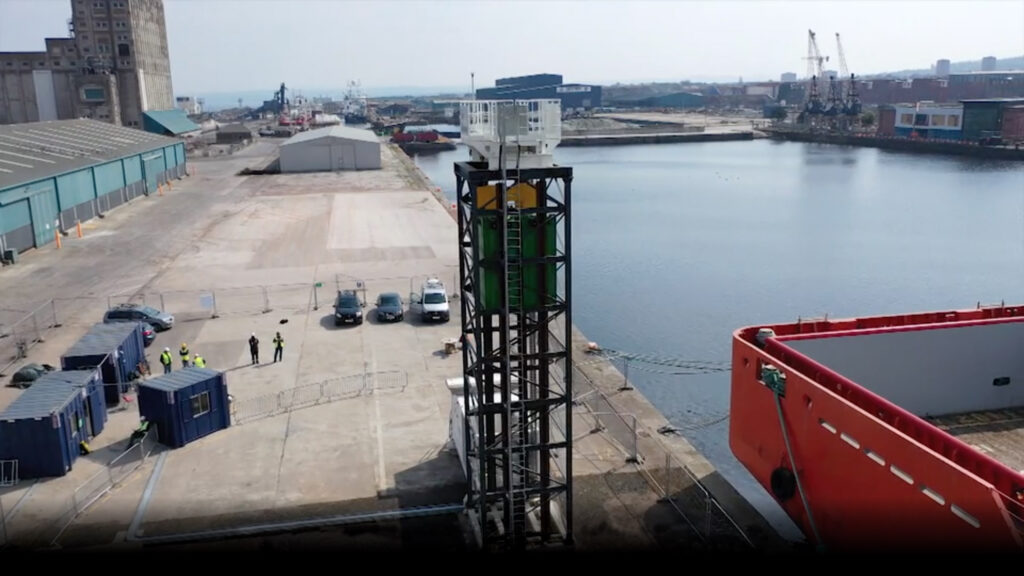
To demonstrate this technology, Gravitricity constructed a 15-meter (49-foot) tall test rig at a cost of £1 million (US $1.4 million) at the Port of Leith in Edinburgh, Scotland.
Test rig schematic drawing. Source: GravitricityThe actual test rig. Source: Gravitricity
This 250 kW concept demonstrator uses two 25-metric ton (27.5-ton) weights suspended by steel cables connected to two winches. With a 7-meter (23-ft) lift, this demonstration system should be able to store almost 1.0 kWh of energy. After being released at the top of the tower, the two weights discharge their stored energy via a regenerative braking system for little more than 10 seconds. While the test duration is short, it is sufficient to demonstrate that the concept works. Moreover, the demonstrator is being used to validate engineering simulations that will be used in the design of a full-scale system.
Gravitricity plans to offer systems in the 1 MW to 20 MW power range with output durations from 15 minutes to 8 hours. Key operating parameters are:
Flexible, controllable power output and total energy delivered.
Response time: zero to full power in less than one second.
Cycle efficiency: between 80% and 90%
Design life: 50-years, with no cycle limit or degradation
A single mass system is well suited for applications that require high power quickly and for a short duration.
Concept for a single-weight energy storage system. Source: Gravitricity
Multiple-weight systems are better suited to storing more energy and releasing power over a longer period.
Concept for a multiple-weight energy storage system. Source: Gravitricity
A full-scale system will be designed to operate in retired (end-of-life) mine shafts or purpose-built deep shafts rather than in tall towers. In the UK, some potentially suitable mines have end-of-life shafts that go to depths of 750 m (2,461 ft). Deep shafts specifically built for the job could have a depth in excess of 2 km (1.2 miles). Masses up to 12,000 metric tons / 13,200 tons may be used.
The energy storage capacity of a Gravitricity system can be quite significant. For example:
A 12,000 metric ton mass suspended at the top of a 750 m deep mineshaft has a potential energy of about 24.5 MWh.
The same 12,000 metric ton mass suspended at the top of a 2 km purpose-built deep shaft has a potential energy of about 65.3 MWh.
Gravitricity reports that they currently are developing a number of project opportunities at existing mines with end-of-life shafts that are suitable for full-scale prototype energy storage systems. Candidate end-of-life shafts have been identified in the UK, the Moravian Silesian Region of Czech Republic and adjacent areas in Poland, and in South Africa. Gravitricity estimates that over 10,000 MWh of energy storage capacity can be deployed globally in existing end-of-life mine shafts.
In the longer term, Gravitricity plans to sink purpose-built shafts, allowing their energy storage technology to be deployed wherever it is required. Multiple, purpose-built shafts can be built in the same area to scale the total energy storage capacity to meet user requirements.
Gravitricity expects that their system will have a levelized cost of storage (cost/MWh) that is significantly less than for lithium-ion battery energy storage systems
Kandler Smith, et al., “Life Prediction Model for Grid- Connected Li-ion Battery Energy Storage System,” National Renewable Energy Laboratory & SunPower Corp., presented at the American Control Conference, Seattle, WA, 24-26 May 2017: https://www.nrel.gov/docs/fy17osti/67102.pdf
US coal production was strong from the 1990s until 2014, with coal production each year being near or above 1 billion short tons (a “short ton” is 2,000 pounds). The highest annual level of production was achieved in 2008: 1.17 billion short tons. Since then, the coal industry has seen a steady decline in production, and trends indicate that the decline will continue.
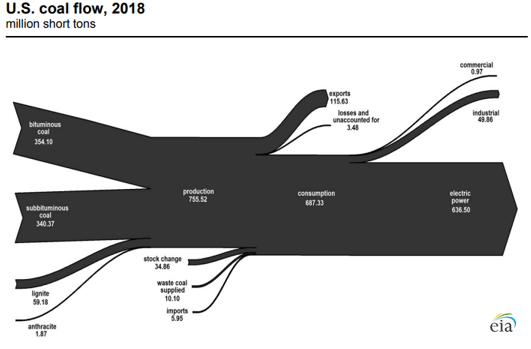
In their 10 July 2019 report, “Almost all US coal production is consumed by electric power,” the US Energy Information Administration (EIA) reported that coal is still one of the main sources of energy in the US, accounting for 16% of the nation’s primary energy production in 2018. Nearly all of the coal consumed in the US is produced domestically, and most is consumed by the electric power sector to generate electricity, while some is exported. The following EIA “coal flow” diagram shows where the coal comes from and (approximately) how it was consumed in 2018. Total production was about 755 million short tons. The electric power sector consumed about 84% of production, with only modest amounts being consumed by the industrial sector or exported.
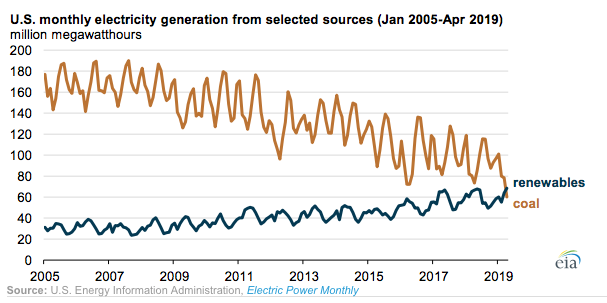
Electricity generation from coal has been on the decline in the US for almost two decades. On 26 June 2019, EIA reported that US electricity generation from renewables surpasses coal in April 2019. In the following EIA chart, you can see the long-term increase in generation from renewables, which contrasts sharply with the long-term decline of generation from coal due to the decommissioning of many coal-fired power plan and the commissioning of no plants since about 2014.
Between 2010 and the first quarter of 2019, US power companies announced the retirement of more than 546 coal-fired power units, totaling about 102 gigawatts (GW) of generating capacity. Plant owners intend to retire another 17 GW of coal-fired capacity by 2025. You’ll find the EIA’s 26 July 2019 report on decommissioning US coal-fired power plants here: https://www.eia.gov/todayinenergy/detail.php?id=40212
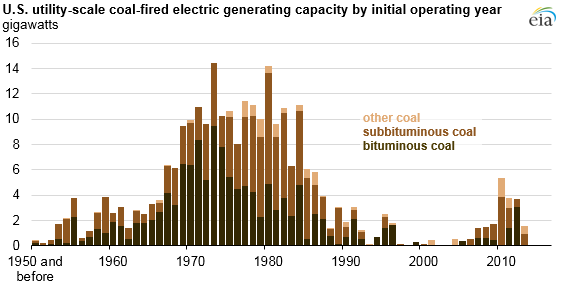
In April 2017, EIA reported that on the age of the US coal-fired generating plant fleet. The following chart shows the distribution of coal-fired plants based on their initial operating year. EIA reported a fleet average age of 39 years in 2017.
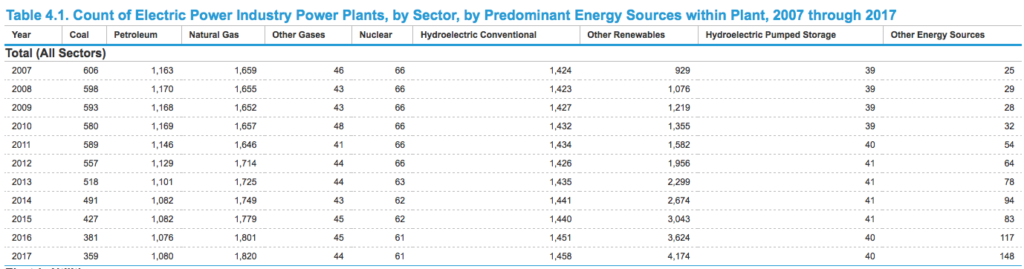
The following table lists EIA data on the numbers of different types of generating plants in the US between 2007 and 2017. In 2007, the US had 606 coal-fired generating plants. By the end of 2017, that number had dropped to 359.
In another decade, coal-fired generation will be only a small part of the US electric power generation portfolio and the average fleet age will be about 50 years old.
In my 19 December 2016 post, “What to do with Carbon Dioxide,” I provided an overview of the following three technologies being developed for underground storage (sequestration) or industrial utilization of carbon dioxide:
Store in basalt formations by making carbonate rock
In the past two years, significant progress has been made in the development of processes to convert gaseous carbon dioxide waste streams into useful products. This post is intended to highlight some of the advances being made and provide links to additional current sources of information on this subject.
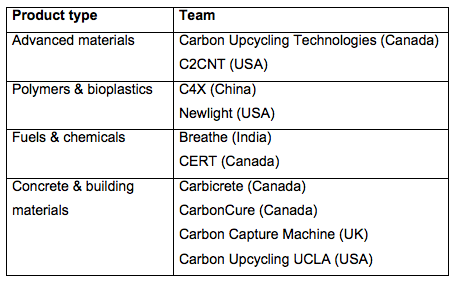
1. Carbon XPrize: Transforming carbon dioxide into valuable products
The NRG / Cosia XPrize is a $20 million global competition to develop breakthrough technologies that will convert carbon dioxide emissions from large point sources like power plants and industrial facilities into valuable products such as building materials, alternative fuels and other items used every day. You’ll find details on this competition on the XPrize website at the following link:
The competition is now in the testing and certification phase. Each team is expected to scale up their pilot systems by a factor of 10 for the operational phase, which starts in June 2019 at the Wyoming Integrated Test Center and the Alberta (Canada) Carbon Conversion Technology Center.
The teams will be judged by the amount of carbon dioxide converted into usable products and the value of those products. We’ll have to wait until the spring of 2020 for the results of this competition.
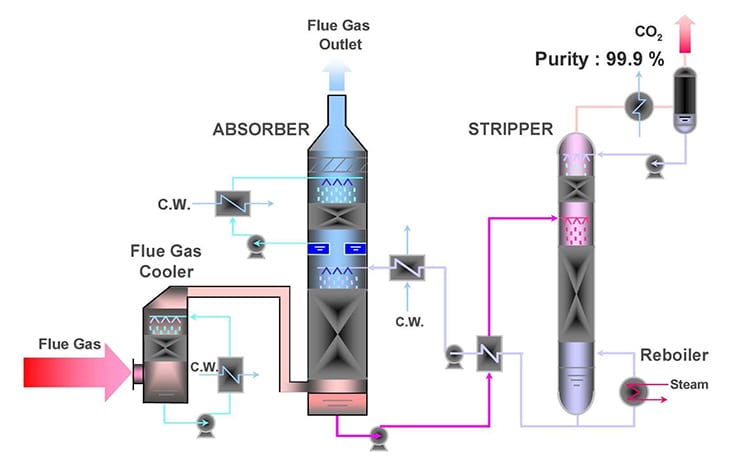
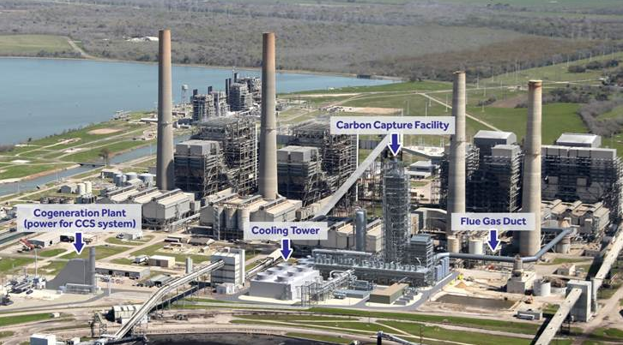
2. World’s largest post-combustion carbon capture project
Post-combustion carbon capture refers to capturing carbon dioxide from flue gas after a fossil fuel (e.g., coal, natural gas or oil) has been burned and before the flue gas is exhausted to the atmosphere. You’ll find a 2016 review of post-combustion carbon capture technologies in the paper by Y. Wang, et al., “A Review of Post-combustion Carbon DioxideCapture Technologies from Coal-fired Power Plants,” which is available on the ScienceDirect website here:
In January 2017, NRG Energy reported the completion of the Petra Nova post-combustion carbon capture project, which is designed to remove 90% of the carbon dioxide from a 240 MW “slipstream” of flue gas at the existing W. A. Parish generating plant Unit 8. The “slipstream” represents 40% of the total flue gas flow from the coal-fired 610 MW Unit 8. To date, this is the largest post-combustion carbon capture project in the world. Approximately 1.4 million metric tons of carbon dioxide will be captured annually using a process jointly developed by Mitsubishi Heavy Industries, Ltd. (MHI) and the Kansai Electric Power Co. The US Department of Energy (DOE) supported this project with a $190 million grant.
The DOE reported: “The project will utilize a proven carbon capture process, which uses a high-performance solvent for carbon dioxideabsorption and desorption. The captured carbon dioxide will be compressed and transported through an 80 mile pipeline to an operating oil field where it will be utilized for enhanced oil recovery (EOR) and ultimately sequestered (in the ground).”
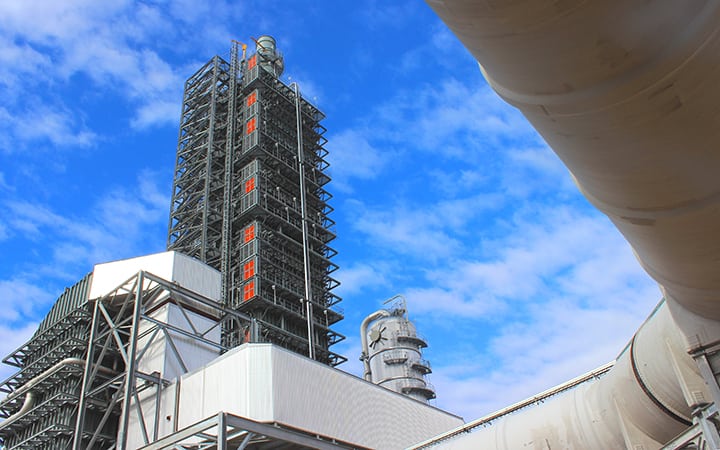
Process flow diagram for Petra Nova carbon dioxidecapture and processing. Source: National Energy Technology LaboratoryThe Petra Nova site. Source: Petra Nova, a joint venture between NRG Energy and JX Nippon Oil & Gas ExplorationThe Petra Nova large-scale carbon dioxide scrubber. Source: Business Wire
You’ll find more information on the Petra Nova project at the following links:
3. Pilot-scale projects to convert carbon dioxideto synthetic fuel
Thyssenkrupp pilot project for conversion of steel mill gases into methanol
In September 2018, Thyssenkrupp reported that it had “commenced production of the synthetic fuel methanol from steel mill gases. It is the first time anywhere in the world that gases from steel production – including the carbon dioxide they contain – are being converted into chemicals. The start-up was part of the Carbon2Chem project, which is being funded to the tune of around 60 million euros by Germany’s Federal Ministry of Education and Research (BMBF)……..‘Today the Carbon2Chem concept is proving its value in practice,’ said Guido Kerkhoff, CEO of Thyssenkrupp. ‘Our vision of virtually carbon dioxide-free steel production is taking shape.’”
Berkeley Laboratory developing a copper catalyst that yields high efficiency carbon dioxide-to-fuels conversion
The DOE Lawrence Berkeley National Laboratory (Berkeley Lab) has been engaged for many years in creating clean chemical manufacturing processes that can put carbon dioxide to good use. In September 2017, Berkeley Lab announced that its scientists has developed a new electrocatalyst comprised of copper nanoparticles that can directly convert carbon dioxide into multi-carbon fuels and alcohols (e.g., ethylene, ethanol, and propanol) using record-low inputs of energy. For more information, see the Global Energy World article here:
The term negative emissions technology (NET) refers to an industrial processes designed to remove and sequester carbon dioxidedirectly from the ambient atmosphere rather than from a large point source of carbon dioxide generation (e.g. the flue gas from a fossil-fueled power generating station or a steel mill). Think of a NET facility as a carbon dioxideremoval “factory” that can be sited independently from the sources of carbon dioxide generation.
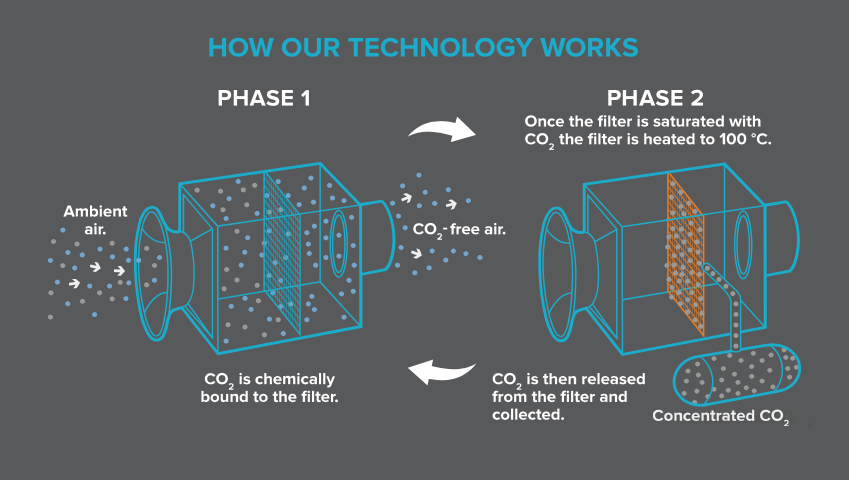
The Swiss firm Climeworks is in the business of developing carbon dioxideremoval factories using the following process:
“Our plants capture atmospheric carbon with a filter. Air is drawn into the plant and the carbon dioxide within the air is chemically bound to the filter. Once the filter is saturated with carbon dioxide it is heated (using mainly low-grade heat as an energy source) to around 100 °C (212 °F). The carbon dioxide is then released from the filter and collected as concentrated carbon dioxide gas to supply to customers or for negative emissions technologies. Carbon dioxide-free air is released back into the atmosphere. This continuous cycle is then ready to start again. The filter is reused many times and lasts for several thousand cycles.”
This process is shown in the following Climeworks diagram:
Source: Climeworks
You’ll find more information on Climeworks on their website here:
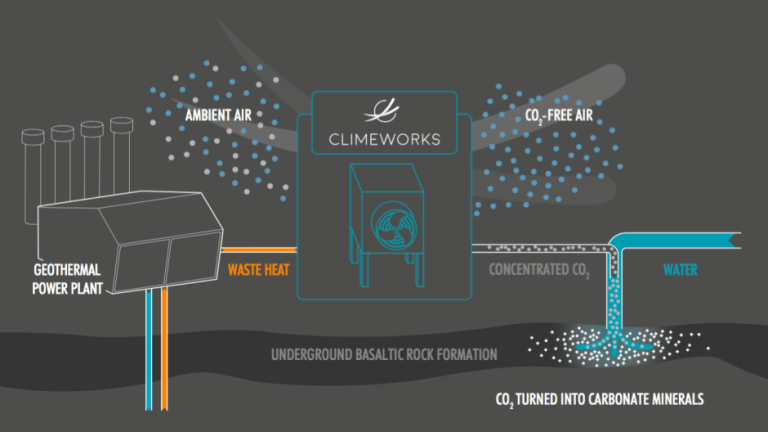
In 2017, Climeworks began operation in Iceland of their first pilot facility to remove carbon dioxide from ambient air and produce concentrated carbon dioxide that is injected into underground basaltic rock formations, where the carbon dioxide gets converted into carbonite minerals in a relatively short period of time (1 – 2 years) and remains fixed in the rock. Climeworks uses waste heat from a nearby geothermal generating plant to help run their carbon capture system. This process is shown in the following diagram.
Source: Climeworks
This small-scale pilot facility is capable of removing only about 50 tons of carbon dioxide from the atmosphere per year, but can be scaled up to a much larger facility. You’ll find more information on this Climeworks project here:
In October 2018, Climeworks began operation in Italy of another pilot-scale NET facility designed to remove carbon dioxide from the atmosphere. This facility is designed to remove 150 tons of carbon dioxide from the atmosphere per year and produce a natural gas product stream from the atmospheric carbon dioxide, water, and electricity. You’ll find more information on this Climeworks project here:
5. Consensus reports on waste stream utilization and negative emissions technologies (NETs)
The National Academies Press (NAP) recently published a consensus study report entitled, “Gaseous Carbon Waste Streams Utilization, Status and Research Needs,” which examines the following processes:
Mineral carbonation to produce construction material
Chemical conversion of carbon dioxideinto commodity chemicals and fuels
Biological conversion (photosynthetic & non-photosynthetic) of carbon dioxide into commodity chemicals and fuels
Methane and biogas waste utilization
The authors note that, “previous assessments have concluded that …… > 10 percent of the current global anthropogenic carbon dioxide emissions….could feasibly be utilized within the next several decades if certain technological advancements are achieved and if economic and political drivers are in place.”
Source: National Academies Press
You can download a free pdf copy of this report here:
Also on the NAP website is a prepublication report entitled, “Negative Emissions Technologies and Reliable Sequestration.” The authors note that NETs “can have the same impact on the atmosphere and climate as preventing an equal amount of carbon dioxide from being emitted from a point source.”
Source: National Academies Press
You can download a free pdf copy of this report here:
In this report, the authors note that recent analyses found that deploying NETs may be less expensive and less disruptive than reducing some emissions at the source, such as a substantial portion of agricultural and land-use emissions and some transportation emissions. “ For example, NAPs could be a means for mitigating the methane generated from enteric fermentation in the digestive systems of very large numbers of ruminant animals (e.g., in the U.S., primarily beef and dairy cattle). For more information on this particular matter, please refer to my 31 December 2016 post, “Cow Farts Could be Subject to Regulation Under a New California Law,”which you’ll find here:
I was impressed in 2007 by the following chart in Scientific American, which shows where our energy in the U.S. comes from and how the energy is used in electricity generation and in four consumer sectors. One conclusion is that more than half of our energy is wasted, which is clearly shown in the bottom right corner of the chart. However, this result shouldn’t be surprising.
Source: Scientific American / Jen Christiansen, using LLNL & DOE 2007 data
The waste energy primarily arises from the efficiencies of the various energy conversion cycles being used. For example, the following 2003 chart shows the relative generating efficiencies of a wide range of electric power sources. You can see in the chart that there is a big plateau at 40% efficiency for many types of thermal cycle power plants. That means that 60% of the energy they used is lost as waste heat. The latest combined cycle plants have demonstrated net efficiencies as high as 62.22% (Bouchain, France, 2016, see details in my updated 17 March 2015 post, “Efficiency in Electricity Generation”).
Source: Eurelectric and VGB PowerTech, July 2003
Another source of waste is line loss in electricity transmission and distribution from generators to the end-users. The U.S. Energy Information Administration (EIA) estimates that electricity transmission and distribution losses average about 6% of the electricity that is transmitted and distributed.
There is an expanded, interactive, zoomable map of U.S. energy data that goes far beyond the 2007 Scientific American chart shown above. You can access this interactive map at the following link:
The interactivity in the map is impressive, and the way it’s implemented encourages exploration of the data in the map. You can drill down on individual features and you can explore particular paths in much greater detail than you could in a physical chart containing the same information. Below are two example screenshots. The first screenshot is a top-level view. As in the Scientific American chart, energy sources are on the left and final disposition as energy services or waste energy is on the right. Note that waste energy is on the top right of the interactive map.
The second screenshot is a more detailed view of natural gas production and utilization.
As reported by Lulu Chang on the digitaltrends.com website, this interactive map was created by Saul Griffith at the firm Otherlab (https://otherlab.com). You can read her post at the following link:
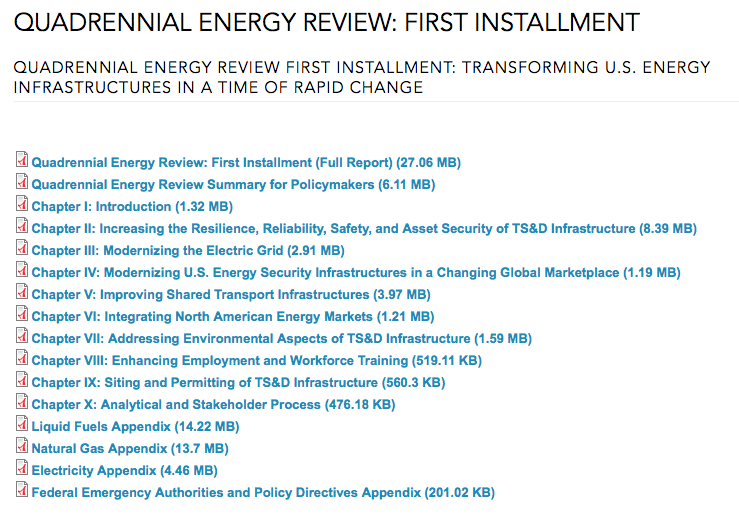
On 9 January 2014 the Administration launched a “Quadrennial Energy Review” (QER) to examine “how to modernize the Nation’s energy infrastructure to promote economic competitiveness, energy security, and environmental responsibility…” You can read the Presidential Memorandum establishing the QER at the following link:
On April 21, 2015, the QER Task Force released the “first installment” of the QER report entitled “Energy Transmission, Storage, and Distribution Infrastructure.” The Task Force announcement stated:
“The first installment (QER 1.1) examines how to modernize our Nation’s energy infrastructure to promote economic competitiveness, energy security, and environmental responsibility, and is focused on energy transmission, storage, and distribution (TS&D), the networks of pipelines, wires, storage, waterways, railroads, and other facilities that form the backbone of our energy system.”
The complete QER 1.1 report or individual chapters are available at the following link:
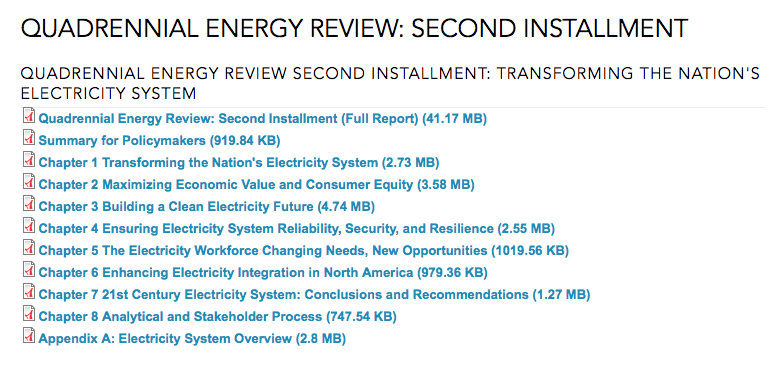
On January 6, 2017, the QER Task Force released the “second installment” of the QER report entitled “Transforming the Nation’s Electricity System.” The Task Force announcement stated:
“The second installment (QER 1.2) finds the electricity system is a critical and essential national asset, and it is a strategic imperative to protect and enhance the value of the electricity system through modernization and transformation. QER 1.2 analyzes trends and issues confronting the Nation’s electricity sector out to 2040, examining the entire electricity system from generation to end use, and within the context of three overarching national goals: (1) enhance economic competitiveness; (2) promote environmental responsibility; and (3) provide for the Nation’s security.
The report provides 76 recommendations that seek to enable the modernization and transformation of the electricity system. Undertaken in conjunction with state and local governments, policymakers, industry, and other stakeholders, the recommendations provide the building blocks for longer-term, planned changes and activities.”
The complete QER 1.2 report or individual chapters are available at the following link:
I hope you take time to explore the QERs. I think the Task Force has collected a great deal of actionable information in the two reports. Converting this information into concrete actions will be a matter for the next Administration.