Category Archives: Astrophysics

The Event Horizon Telescope Team has Produced the First Image Showing the Shadow of the Sgr A* Black Hole at the Center of our Milky Way Galaxy

Peter Lobner

Background

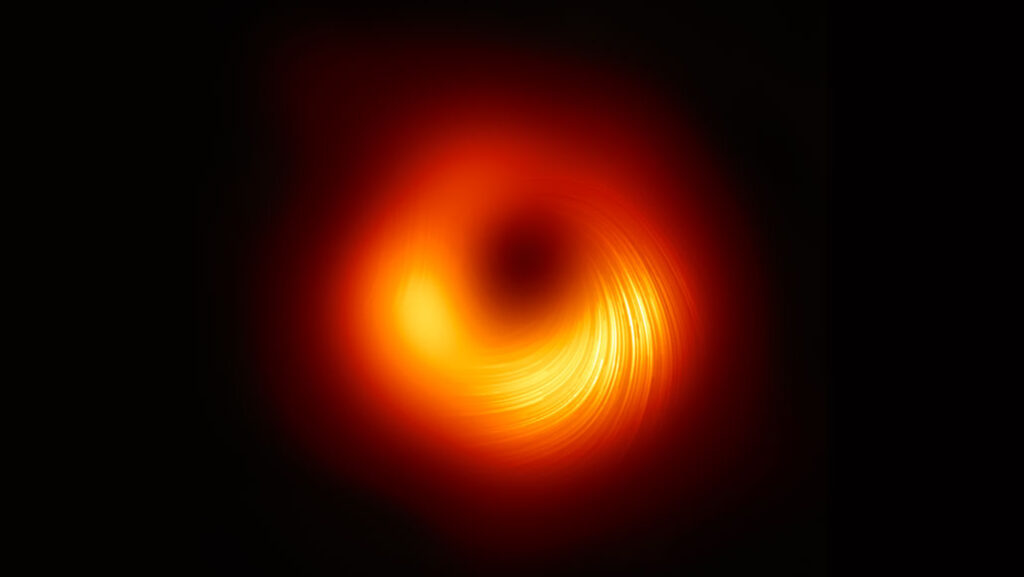
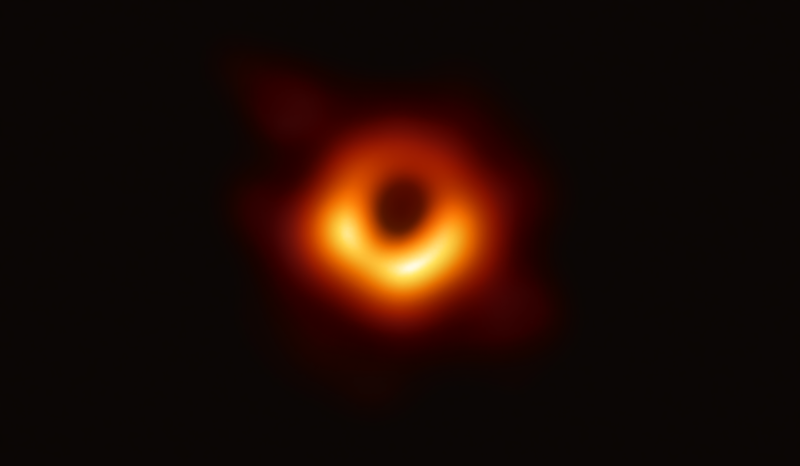
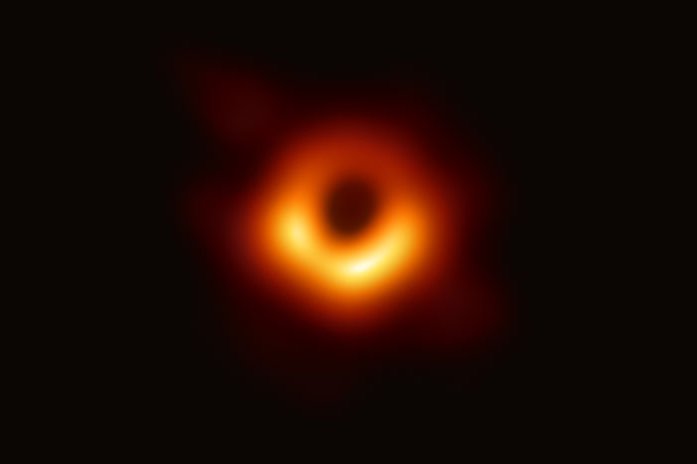
The first-ever direct image of a black hole was released on 10 April 2019 by the Event Horizon Telescope (EHT) team and the National Science Foundation (NSF).  The target for their observation was the supermassive M87* black hole at the center of the distant Messier 87 (M87) galaxy, some 54 million light years away. The EHT team estimated that M87* has a mass of about 6.5 billion Solar-masses (6.5 billion times greater than the mass of our Sun), and the black hole consumes the equivalent of about 900 Earth-masses per day. One Solar mass is roughly equivalent to the weight of the Sun and about 333,000 times the mass of Earth. Gases orbiting around the giant M87* black hole take days to weeks to complete an orbit. For more information on the first M87* black hole image, see my 10 April 2019 article here: https://lynceans.org/all-posts/the-event-horizon-telescope-team-has-produced-the-first-image-showing-the-shadow-of-a-black-hole/

For decades, there has been mounting evidence that there is a massive black hole, known as Sagittarius A*, or Sgr A* for short, at the center of our Milky Way galaxy.  Its presence has been inferred from the motions of visible stars that are orbiting under the gravitational influence of the black hole or are in the general vicinity of the black hole.  Using observed data from more than 30 stars in the region around the galactic center, scientists developed high-resolution simulations that helped refine estimates of the location, mass and size of the Sgr A* black hole without having data from direct observations.  For more information on this work, see my 24 January 2017 article here: https://lynceans.org/all-posts/the-black-hole-at-our-galactic-center-is-revealed-through-animations/

First-ever image of Sgr A*

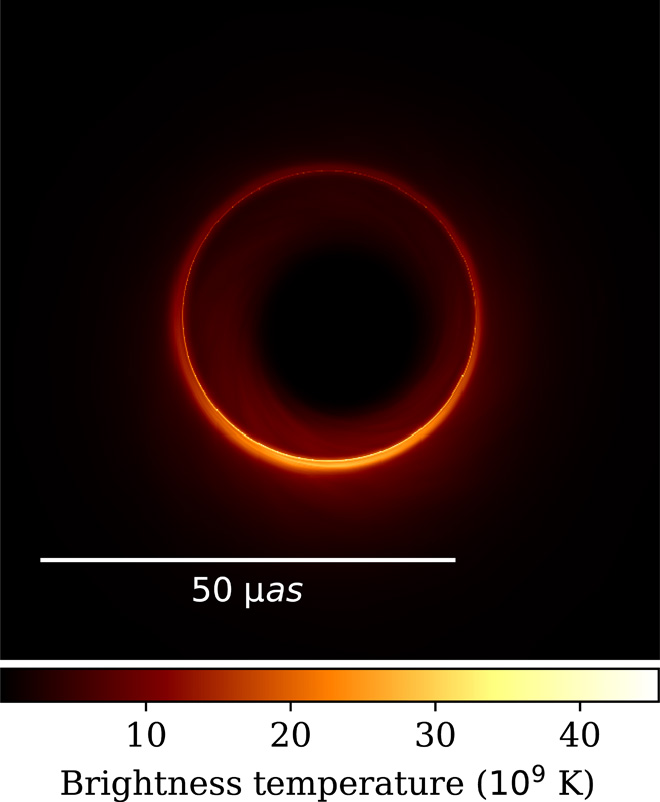
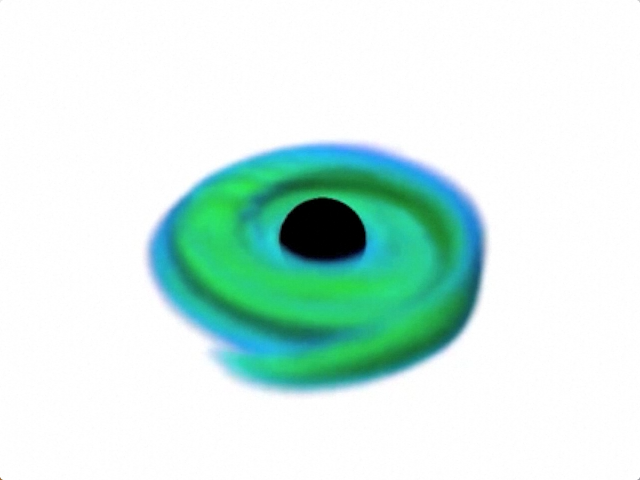
On 12 May 2022, the EHT team and the European Southern Observatory (ESO) held a press conference and released the first-ever image to directly show the ring of glowing gas surrounding the Sgr A* black hole.  You can read their press release here: https://eventhorizontelescope.org/blog/astronomers-reveal-first-image-black-hole-heart-our-galaxy

Initial EHT team and ESO results from their Sgr A* observations have been published and are available on The Astrophysical Journal Letters website here: https://iopscience.iop.org/journal/2041-8205/page/Focus_on_First_Sgr_A_Results

First-ever image looking down into the ring of rotating, glowing gas
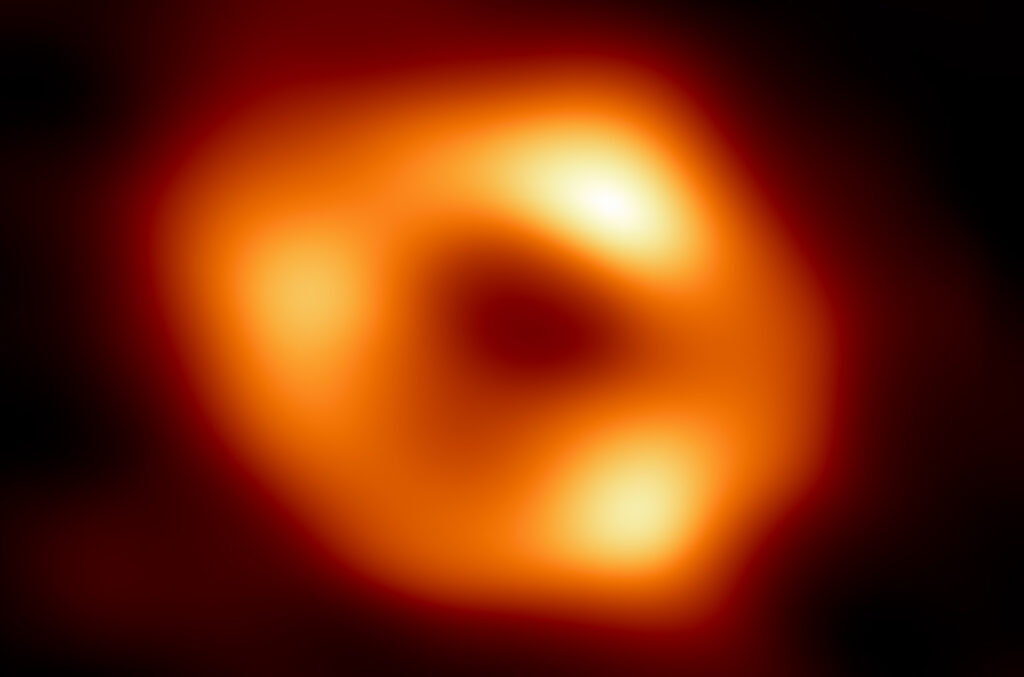
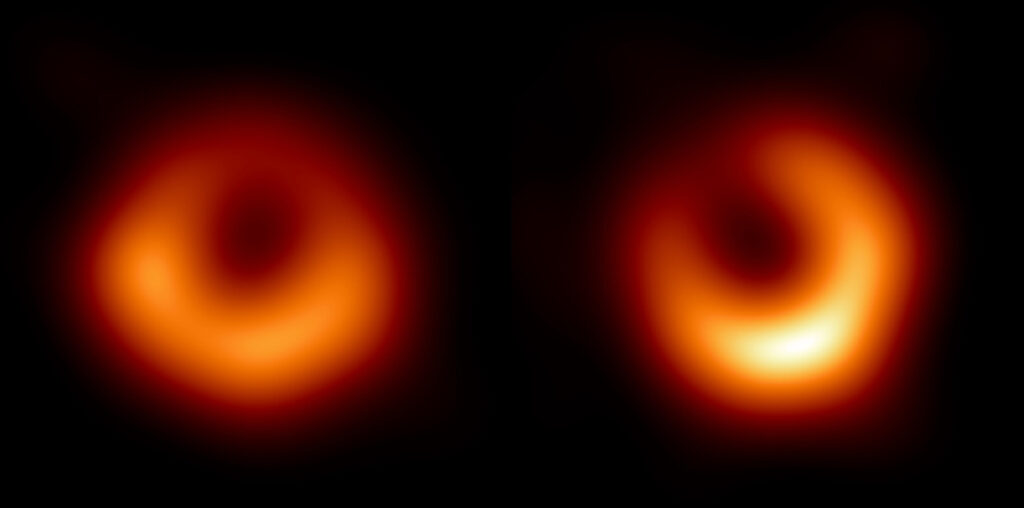
surrounding Sgr A*. Source: EHT Collaboration
Composite image showing the location of the Sgr A* black hole (inset) in a composite 
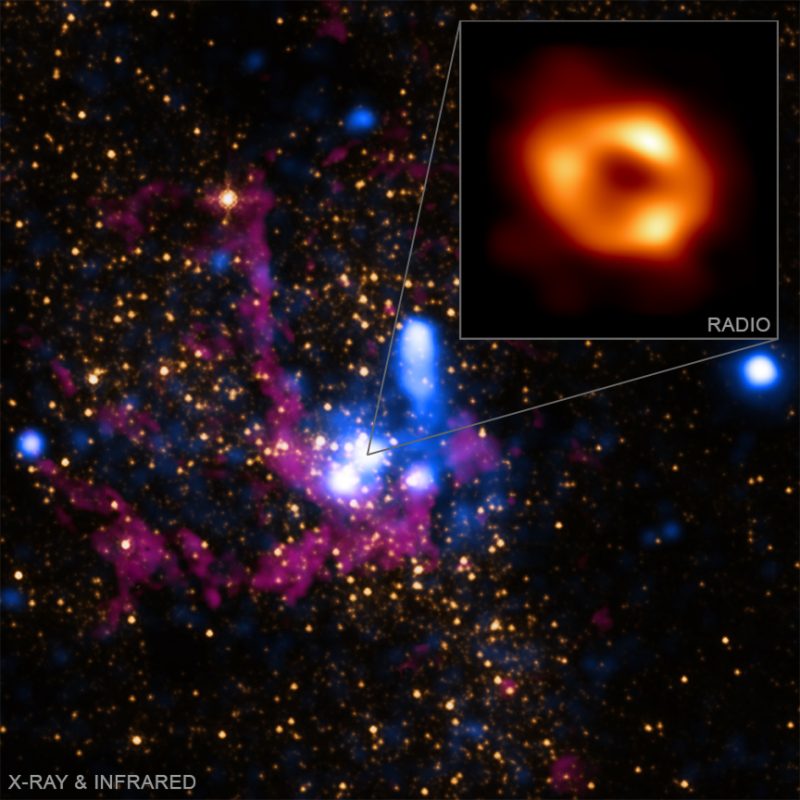
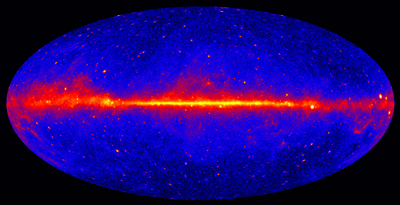
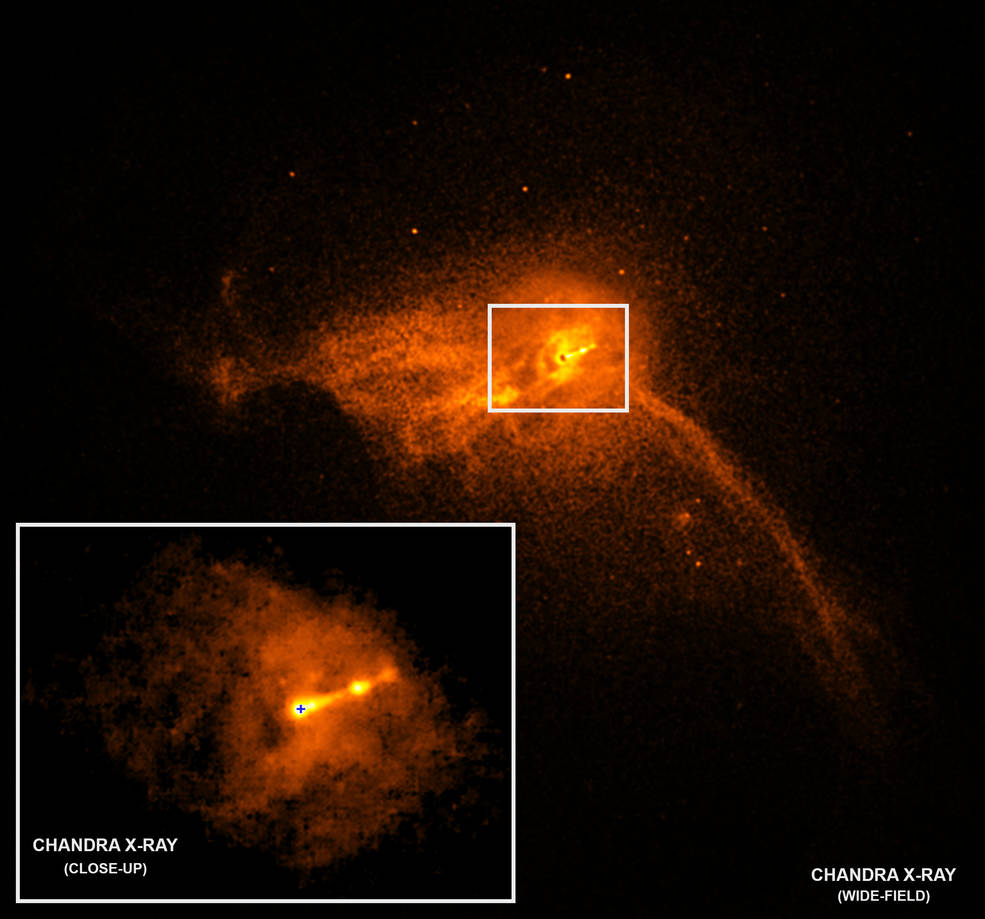
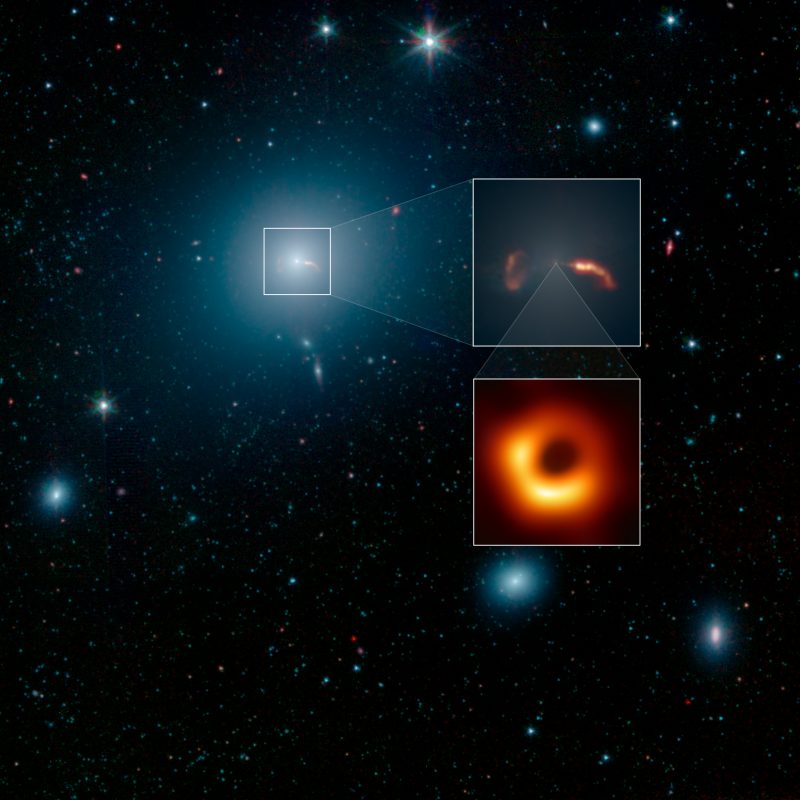
X-ray/infrared NASA image of the heart of our Milky Way galaxy. 
Source: EHT Collaboration & NASA

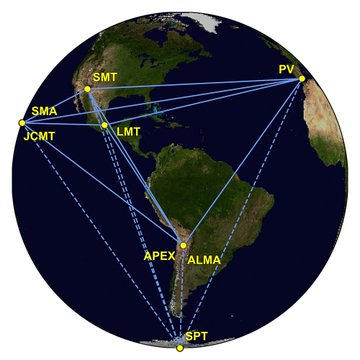
Even though it was much closer than M87*, getting an image of Sgr A* was much harder because the Sgr A* black hole had to be viewed through the densely populated central plane of our Milky Way.  The Sgr A* radio frequency (millimeter wave) observations were made in 2017 at a wavelength of 1.3 mm (230 GHz), the same as the first image of M87*. 

Details that have emerged so far from the Sgr A* observation include the following.

  • Sgr A* is about 27,000 light years away, at the heart of our own galaxy (about 2 thousand times closer than M87*, which is in a different galaxy). 
  • Sgr A* has a mass is about 4 million times the mass of our Sun, which is just a small fraction (1/1,500th , or 0.07%) of the mass of M87*.
  • The glowing gas ring surrounding the Sgr A* black hole has an outer diameter of about 72 million miles (115 million km) across, which is approximately the diameter of Mercury’s orbit around the Sun in our solar system. The EHT team reported, “We were stunned by how well the size of the ring agreed with predictions from Einstein’s Theory of General Relativity.”  By comparison, M87* is vastly larger, with the inner black hole region measuring about 23.6 billion miles (38 billion km) across (about 330 times the diameter of the entire Sgr A* black hole, including the glowing gas ring), as shown in the following scale diagram.
Comparison of the sizes of M87* (left) and Sgr A* (right). 
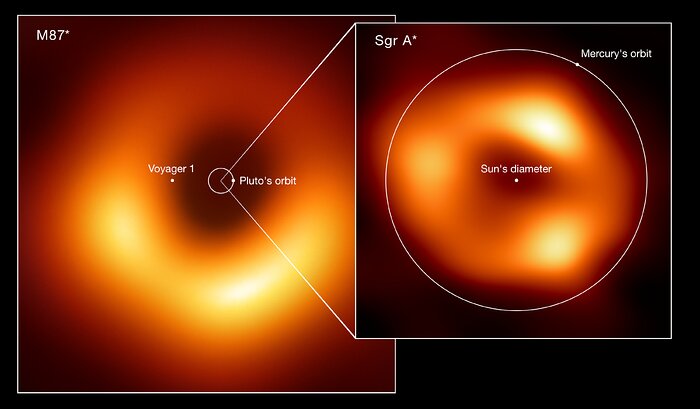
Source: EHT Collaboration (acknowledgment: Lia Medeiros)
  • The two black holes subtend approximately the same angle when viewed from Earth. The EHT team reported that the M87* bright emission disk subtends an angle of 42 ± 3 microarcseconds.
  • Gases orbiting around the Sgr A* black hole take mere minutes to an 1 hour to complete an orbit.  The fast moving gases blur the image for an EHT observation typically lasting several hours. The released image of the Sgr A* black hole is an average of many different images the EHT team extracted from the data.
  • Sgr A* is far less active than M87*, and consumes only about 1/1,000th the mass per day (equivalent of about 1 Earth-mass per day).
  • The source of the three bright spots in the glowing gas ring are unknown at this time.  They may be artifacts of the EHT observation process.

Follow-on EHT observations will benefit from additional telescopes joining the EHT network and significant technical improvements being made to the EHT telescopes and network systems.  For example, operating the telescopes in the EHT array at a shorter wavelength of 0.87 mm (frequency of 345 GHz) will improve angular resolution by about 40%. More frequent observations and faster data processing would enable time-lapse movies to be created to show the dynamics of gas motion around the black hole. Details on planned improvements are discussed in my 9 April 2020 article here: https://lynceans.org/all-posts/working-toward-a-more-detailed-view-of-a-black-hole/

For more information

Anti-Stars and Anti-Star Clusters May be Hiding in Plain Sight

Peter Lobner

It is generally assumed that all of the observable objects in our universe in composed of ordinary matter.  The rationale for this assumption if explained in a 1999 Scientific American article by Steve Naftilan: https://www.scientificamerican.com/article/how-do-we-know-that-dista/

In most of the electromagnetic spectrum, a star composed of normal matter and a star composed of antimatter (anti-star) will look the same to an observer on Earth. Their visible spectra will be indistinguishable. A key difference in behavior may be observable in the gamma ray spectrum, where high-energy gamma rays characteristic of matter-antimatter annihilation (i.e., baryon-antibaryon reactions) may reveal the identity of an antimatter star within our galaxy or an antimatter star cluster outside our galaxy.  Luigi Foschini provides a good introduction to this subject in his 2000 paper at the following link: https://cds.cern.ch/record/447091/files/0007180.pdf

NASA’s Alpha Magnetic Spectrometer (AMS) has developed into an important tool in the search for anti-stars. The prototype, AMS-01 flew on the STS-91 Space Shuttle mission from 2 to 12 June 1998 and was successfully tested in orbit. The full-scale AMS-2 was launched aboard the STS-134 Space Shuttle mission on 16 May 2011. Since it was installed on the International Space Station (ISS) and activated on 19 May 2011, this 18,739 pound (8,500 kg), 2,250 cu. ft (64 cu meter) instrument has collected and analyzed more than 165 billion cosmic ray events (as of April 2021), and identified 9 million of these as antimatter, including the possible detection of antihelium nuclei.

You’ll find more information on AMS-1 and -2 on the NASA website here: https://ams.nasa.gov

AMS-2 installed on the ISS.  Source: NASA

Another important source of data related to antimatter in our universe is NASA’s Fermi Gamma-ray Space Telescope, which was launched into a low Earth orbit on June 11, 2008.  NASA’s website for the ongoing Fermi mission is here: https://fermi.gsfc.nasa.gov

The entire sky at gamma-ray energies greater than 1 GeV based on five years of data from Fermi’s Large Area Telescope (LAT) instrument. Brighter colors indicate brighter gamma-ray sources. Source: NASA/DOE/Fermi LAT Collaboration

In an 8 February 2021 article, astrophysicist Paul Sutter postulates the existence of antimatter star clusters that escaped the primordial matter-antimatter annihilations and now exist in relative isolation, for example, as an antimatter star cluster orbiting our Milky Way galaxy.  

The antimatter stars in the cluster would continuously shed antimatter into the cosmos, leading to subsequent matter-antimatter interactions that produce high-energy particles that may be detectable from Earth.

Sutter commented, “…if astronomers are able to pinpoint a globular cluster as a particularly strong source of anti-particles, it would be like opening a time capsule, giving us a window into the physics that dominated the universe when it was only a second old.” 

In a 20 April 2021 paper, authors Dupourqué, Tibaldo, and von Ballmoos report the possible detection of 14 anti-stars within our Milky Way galaxy.  They used 10 years of data on 5,800 gamma-ray sources in Fermi’s data catalog to develop an estimate of the possible abundance of anti-stars. The authors report: “We identify in the catalog 14 anti-star candidates not associated with any objects belonging to established gamma-ray source classes and with a spectrum compatible with baryon-antibaryon annihilation.”  

Fourteen celestial sources of gamma rays (colored dots in this all-sky map of the Milky Way; yellow / green indicates bright sources and blue shows dim sources) may come from stars made of antimatter.  Source: Simon Dupourqué / IRAP via ScienceNews

The 14 anti-star candidates await further analysis to confirm or refute their existence.  If confirmed, they represent only a small fraction of the population of all gamma-ray sources observed by the Fermi Gamma-ray Space Telescope.  Nonetheless, even one confirmed anti-star would be a remarkable achievement.

For more information:

Polarized Image Provides New Insights Into the M87 Black Hole

Peter Lobner, 25 March 2021

The first image of the shadow of a black hole was released on 10 April 2019 by the Event Horizon Telescope (EHT) collaboration and the National Science Foundation (NSF).  The target of their observation was the supermassive black hole located near the center of the Messier 87 (M87) galaxy, which is about 55 million light years from Earth.  That black hole is estimated to have a mass 6.5 billion times greater than our Sun.

Non-polarized image of M87 released 10 April 2019.  Source: EHT & NSF

After further analysis of the historic M87 data, EHT astronomers have been able to measure the polarization of the radio frequency signals from the bright disk of the black hole.  Polarization is a signature of the direction of the very strong magnetic fields in the hot glowing gas at the edge of a black hole, which can be seen in the following image released on 24 March 2021.  

Polarized image of M87 released 24 March 2021.  Source: EHT 

The ability to measure the polarization in fine detail provides a new tool for mapping the dynamic magnetic field structure of a black hole.  The new image shows the magnetic fields in the swirling accretion disk, which contains matter that is falling into the black hole.  

Researchers also measured polarization that is pointing directly toward or away from the black hole, perpendicular to the accretion disk.  Very strong magnetic fields in these directions may be responsible for launching plasma jets into space, away from the black hole.  Such jets have been observed emanating from some black holes.

These are exciting times in astronomy and astrophysics.

For more information:

The Cosmic Microwave Background Provides a Refined View of Our Universe

Peter Lobner, 12 January 2021

The Atacama Cosmology Telescope (ACT) is a six-meter (19.7 foot) radio telescope designed to make high-resolution, microwave-wavelength surveys of the cosmic microwave background (CMB).  It is located at a remote site in the Atacama Desert at an elevation of 5,190 meters (17,030 feet) in northern Chile. 

The ACT site.  Source: ACT Collaboration

ACT observes in three frequency bands (148, 218 and 277 GHz) and has a resolution of 1.3 arc minutes at 148 GHz, near the peak of the CMB spectrum.  This is significantly higher than the 5-10 arc minute resolution of the Planck spacecraft, which observed the CMB from 2009 to 2013 in the frequency range from 30 to 857 GHz. You’ll find a detailed description of the Atacama Cosmology Telescope (ACT) at the following link: https://www.cosmos.esa.int/documents/387566/387653/Ferrara_Dec3_09h20_Devlin_ACT.pdf

I reported on key results of the Planck CMB survey results in my post at the following link: https://lynceans.org/all-posts/the-universe-is-isotropic/

New results from the ACT survey, reported in December 2020, affirm the Planck CMB survey results.  

  • The universe is isotropic
  • The estimate of the age of the universe was refined to 13.77 billion years old ± 0.04 billion years, overlapping uncertainty bands with the 2015 Planck estimate of 13.813 ± 0.038 billion years
  • The value of the Hubble constant was refined to 67.6 kilometers / second / megaparsec, up slightly from the 2018 Planck estimate of 67.4 kilometers / second / megaparsec.  The significant difference from the value derived from astrophysical measurements, 73.5 km / second / megaparsec, remains unexplained.
ACT high resolution image of the isotropic cosmic background radiation covering a section of the sky 50 times the width of a full moon. This image represents a region of space 20 billion light-years across. Source: ACT Collaboration via EarthSky

For more information:

CNO Fusion Cycle in the Sun Confirmed by Borexino

Peter Lobner, 26 November 2020

Background

Fusion reactions in our Sun are predominately proton – proton reactions that lead to the production of the light elements helium, lithium, beryllium and boron.  The next step up on the periodic table of elements is carbon.

Carbon is formed in our Sun by the “triple alpha” process shown in the following diagram.  First, two helium-4 nuclei (4He, an alpha particles) fuse, emit a gamma ray and form an atom of unstable beryllium-8 (8Be), which can fuse with another helium nucleus, emit another gamma ray and form an atom of stable carbon-12 (12C). Timing is everything, because that fusion reaction must occur during the very short period of time before the unstable beryllium-8 atom decays (half life is about 8.2 x 10⁻¹⁷ seconds).  

Stellar process for producing carbon-12.  Source:  Borb via Wikipedia

Stellar process for producing carbon-12.  Source:  Borb via Wikipedia

The carbon produced by the above reaction chain is the starting point for the carbon-nitrogen-oxygen (CNO) fusion cycle, which accounts for about 1% of the fusion reactions in a relatively small star the size of our Sun.  In larger stars, the CNO cycle becomes the dominant fusion cycle.

The In the following diagram, the CNO cycle starts at the top-center:

  • First, an atom of stable carbon-12 (12C) captures a proton (1H) and emits a gamma ray (γ), producing an atom of nitrogen-13 (13N), which has a half-life of almost 10 minutes.  
  • The cycle continues  when the atom of nitrogen-13 decays into an atom of stable carbon-13 (13C) and emits a neutrino (ν) and a positron (β+).  
  • When the carbon-13 atom captures of a proton, it emits a gamma ray and produces an atom of stable nitrogen-14 (14N).  
  • When the nitrogen-14 atom captures a proton, it emits a gamma ray and produces an atom of oxygen-15 (15O), which has a half-life of almost 71 seconds.
  • The cycle continues  when the atom of oxygen-15 decays into an atom of stable nitrogen-15 (15N) and emits a neutrino (ν) and a positron (β+).  
  • After one more proton capture, the nitrogen-15 atom splits into a helium nucleus (4He) and an atom of stable carbon-12, which is indistinguishable from the carbon-12 atom that started the cycle.
The carbon-nitrogen-oxygen (CNO) cycle.  
Source:  Borb via Wikipedia

As shown in the previous diagram, the CNO cycle generates characteristic emissions of gamma rays, positrons and neutrinos.  With a neutrino detector, scientists would search for the neutrinos emissions from the nitrogen-13 and oxyger-15 decay steps in the CNO cycle.

The Big News!

On 25 November 2020, the Italian National Institute for Nuclear Physics (INFN) announced that a team of scientists, known as the Borexino Collaboration, had made the first detection of neutrinos that can be traced to CNO cycle at work within within the Sun. You can read the INFN press release here: https://home.infn.it/en/media-outreach/press-releases/4201-borexino-ottiene-la-prima-prova-sperimentale-di-come-brillano-le-stelle-massive-2

The Borexino experimental facility is located at the INFN’s Gran Sasso National Laboratories in the Apennine Mountains, about 65 miles (105 km) northeast of Rome. The official website of the Borexino Experiment is here:  http://borex.lngs.infn.it

The Borexino neutrino detector is in a underground laboratory hall deep in the mountain, which protects the detector from cosmic radiation, with the exception of neutrinos that pass through Earth undisturbed.  Even with the huge Borexino detector in this very special, protected laboratory environment, the research team reported that detecting  CNO neutrinos has been very difficult. Only about seven neutrinos with the characteristic energy of the CNO cycle are spotted in a day.

The Borexino neutrino detector is shown in the following diagram.  

Source: INFN

INFN reported, “Previously Borexino had already studied in detail the main mechanism of energy production in the Sun, the proton-proton chain, through the individual detection of all neutrino fluxes that originate from it.”

For more information:

Adieu to Radio Astronomy at Arecibo

Peter Lobner, Updated 19 October 2022

The Arecibo Observatory (AO) on Puerto Rico has been out of service since 10 August 2020, when a three-inch auxiliary support cable slipped out of its socket and fell onto the fragile radio telescope dish below. Three months later, on 6 November 2020, a second cable associated with the same support tower broke, damaging nearby cables, causing more damage to the reflector dish, and leaving the radio telescope’s support structure in a weakened and uncertain state.

On 19 November 2020, the National Science Foundation (NSF) announced it has begun planning for decommissioning the 57-year old Arecibo Observatory’s (AO) 1,000-foot (305-meter) radio telescope due to safety concerns after the two support wires broke and seriously damaged the antenna.  You can read NSF News Release 20-010 at the following link: https://www.nsf.gov/news/news_summ.jsp?cntn_id=301674

The 1,000-foot (305-m) dish at Arecibo Observatory in better days, in Spring 2019. Source: AO/University of Central Florida (UCF)
The damaged Arecibo Observatory radio telescope in November 2020.  
Source: NSF
A view from under the damaged dish. 
Source: AO/University of Central Florida (UCF)

The NSF website for AO is at the following link:  https://www.naic.edu/ao/telescope-description

This website includes a timeline summarizing the most important discoveries made by AO since 1967: https://www.naic.edu/ao/legacy-discoveries

Not included in the NSF timeline is the 1974 first-ever broadcast into deep space of a powerful signal that could alert other intelligent life to our technical civilization on Earth. The 1,679 bit “Arecibo Message” was directed toward the globular star cluster M13, which is 22,180 light years away. The message will be in transit for another 22,134 years.

The Arecibo Message. Source:  SETI

You’ll find a description of the Arecibo Message on the SETI website here: https://www.seti.org/seti-institute/project/details/arecibo-message

A key capability lost is AO’s planetary radar capability that enabled the large dish to function as a high-resolution, active imaging radar.  You’ll find examples of AO’s radar images of the Moon, planets, Jupiter’s satellites, Saturn’s rings, asteroids and comets on the NSF website here:  https://www.naic.edu/~pradar/radarpage.html

More impressive than the still images were animations created from a sequence of AO radar images, particularly of passing asteroids.  The animations defined the motion of the object as it flew near Earth. As an example, you can watch the following short (1:07 minutes) video, “Big asteroid 1998 OR2 seen in radar imagery ahead of fly-by”:

The US still has a reduced capability for planetary radar imaging with NASA’s Deep-Space Network’s Uplink Array.

AO’s radio telescope dish was the largest in the world until 2016 when China completed its 500-meter (1,640-foot) FAST radio telescope. It looks like the torch was passed just in time.  You’ll find information on FAST here: https://lynceans.org/all-posts/chinas-five-hundred-meter-aperture-spherical-telescope-fast-will-be-the-worlds-largest-radio-telescope/

Arecibo was not part of the Event Horizon Telescope (EHT) Collaboration of worldwide radio telescopes that succeeded in imaging the shadow of a black hole in 2019.  You’ll find this story here: https://lynceans.org/all-posts/the-event-horizon-telescope-team-has-produced-the-first-image-showing-the-shadow-of-a-black-hole/

The 19 November 2020 NSF news release stated, “After the telescope decommissioning, NSF would intend to restore operations at assets such as the Arecibo Observatory LIDAR facility — a valuable geospace research tool — as well as at the visitor center and offsite Culebra facility, which analyzes cloud cover and precipitation data.”

Adieu to radio astronomy at Arecibo.

Update 1 December 2020: Arecibo radio telescope collapsed.

NPR reported, “The Arecibo Observatory in Puerto Rico has collapsed, after weeks of concern from scientists over the fate of what was once the world’s largest single-dish radio telescope. Arecibo’s 900-ton equipment platform, suspended 500 feet above the dish, fell overnight after the last of its healthy support cables failed to keep it in place. No injuries were reported, according to the National Science Foundation, which oversees the renowned research facility.”

Arecibo after the collapse. Source: Ricardo Arduengo / AFP via Getty Images

Update 8 December 2020: National Science Foundation video shows the moment of collapse.

Update 19 October 2022: No NSF funding

On 18 October 2022, Science magazine reported on NSF’s plans to convert the iconic observatory in Puerto Rico into a center for education and outreach in science, technology, engineering, and math (STEM). The limited funding available for this purpose “does not include support for remaining instruments at the site, including a 12-meter radio telescope, a radio spectrometer, and a suite of optical laser instruments for studying the upper atmosphere.”

Adieu to radio astronomy at Arecibo, indeed.

For more information:

Working Toward a More Detailed View of a Black Hole

Peter Lobner, updated 17 August 2021

1.  Introduction

The Event Horizon Telescope (EHT) Collaboration reported a great milestone on 10 April 2019 when they released the first synthetic image showing a luminous ring around the shadow of the M87 black hole.

First synthetic image of the M87 black hole.
Source: Event Horizon Telescope Collaboration

The  bright emission ring surrounding the black hole was estimated to have an angular diameter of about 42 ± 3 μas (microarcseconds), or 1.67 ± 0.08 e-8 degrees, at a distance of 55 million light years from Earth.  At the resolution of the EHT’s first black hole image, it was not possible to see much detail of the ring structure.   

Significantly improved telescope performance is required to discern more detailed structures and, possibly, time-dependent behavior of spacetime in the vicinity of a black hole.  The EHT Collaboration has a plan for improving telescope performance.  A challenging new observational goal has been established by scientists who recently postulated the existence of a “photon ring” around a black hole.  Let’s take a look at these matters.

2. Improving the performance of the EHT terrestrial observatory network

As I described in my 3 March 2017 post on the EHT, a very long baseline interferometry (VLBI) array with the diameter of the Earth (12,742 km, 1.27e+7 meters) operating in the EHT’s millimeter / submillimeter wavelength band (1.3 mm to 0.6 mm) has a theoretical angular resolution of 25 to 12 μas, with the better resolution at the shorter wavelength.

The EHT team plans to improve telescope performance in the following key areas:

Improve the resolution of the EHT

  • Observe at shorter wavelengths:  The EHT’s first black hole image was made at a wavelength of 1.3 mm (230 GHz). Operating the telescopes in the EHT array at a shorter wavelength of 0.87 mm (frequency of 345 GHz) will improve angular resolution by about 40%.  This upgrade is expected to start after 2020 and take 3 – 5 years to deploy to all EHT observatories.
  • Extend baselines: Adding more terrestrial radio telescopes will lengthen some observation baselines, up to the limit of the Earth’s diameter. 

Improve the sensitivity of the EHT

  • Collect data at multiple frequencies (wide bandwidth): Black holes emit radiation at many frequencies.  EHT sensitivity and signal-to-noise ratio can be improved by increasing the number of frequencies that are monitored and recorded during EHT observations.  This requires multi-channel receivers and faster, more capable data processing and recording systems at all EHT observatories. 
  • Increase the EHT aperture:  The EHT team notes that the most straightforward way to boost the sensitivity of the EHT is to increase the net collecting area of the dishes in the array.  You can all of the observatories participating in EHT here:  https://eventhorizontelescope.org/blog/global-web-tour-eht-observatories

The size of individual radio telescopes in the EHT array vary from the 12 m Greenland Telescope with an aperture of about 113 square meters to the 50 m Large Millimeter Telescope (LMT) in Mexico with an aperture of about 2,000 square meters.  

  • The telescope with the largest aperture is the phased ALMA array, which is comprised of up to 54 x 12 m telescopes with a effective aperture of about 7,200 square meters.  The Greenland Telescope originally was a prototype for the ALMA array and was relocated to Greenland to support VLBI astronomy.
  • A phased array is an effective solution for VLBI observations because the requirements for mechanical precision and rigidity of the dish are easier to meet with a smaller radio telescope dish that can be manufactured in large numbers.

With higher angular resolution and improved sensitivity, and with more powerful signal processing to handle the greater volume of data, it may be possible for the EHT to “see” some detailed structures around a black hole.  Multiple images of a black hole over a period of time could be used to create a dynamic set of images (i.e., a short “video”) that reveal time-dependent black hole phenomena.    

You’ll find more information on these telescope system upgrades on the EHT website here:(https://eventhorizontelescope.org/technology).

3. Photon ring:   New insight into the fine structure in the vicinity of a black hole

On 18 March 2020, a team of scientists postulated the existence of a “photon ring” closely orbiting a black hole.  The scientists further postulated that the “glow” from the first few photon sub-rings may be directly observable with a VLBI array like the EHT. 

Time-averaged results of computer simulations of the photon ring surrounding the M87 black hole.  
Source:  Michael Johnson, et al., 18 March 2020

The abstract and part of the summary of the paper are reproduced below.

  • Abstract:  “The Event Horizon Telescope image of the supermassive black hole in the galaxy M87 is dominated by a bright, unresolved ring. General relativity predicts that embedded within this image lies a thin “photon ring,” which is composed of an infinite sequence of self-similar subrings that are indexed by the number of photon orbits around the black hole. The subrings approach the edge of the black hole “shadow,” becoming exponentially narrower but weaker with increasing orbit number, with seemingly negligible contributions from high-order subrings. Here, we show that these subrings produce strong and universal signatures on long interferometric baselines. These signatures offer the possibility of precise measurements of black hole mass and spin, as well as tests of general relativity, using only a sparse interferometric array.”
  • Summary: “In summary, precise measurements of the size, shape, thickness, and angular profile of the nth photon subring of M87 and Sgr A* may be feasible for n = 1 (the first ring) using a high-frequency ground array or low Earth orbits, for n = 2 (the second ring) with a station on the Moon, and for n = 3 (the third ring) with a station in L2 (Lagrange Point).”
Five Lagrange points in the Earth-Sun system. 
L2 is behind the Earth.  Source: NASA

The complete, and quite technical, 18 March 2020 paper by Michael Johnson, et al., “Universal interferometric signatures of a black hole’s photon ring,” is available on the Science Advances website here:  https://advances.sciencemag.org/content/6/12/eaaz1310

You’ll find a more narrative summary by Camille Carlisle, writing for SkyandTelescope.com, here:  https://skyandtelescope.org/astronomy-news/scientists-predict-countless-rings-of-light-encircle-black-holes/

4.  EHT images black hole-powered relativistic jets

On 7 April, 2020, the EHT Collaboration reported that it had produced images with the finest detail ever seen of relativistic jets produced by a supermassive black hole.  The target of their observation was Quasar 3C 279, which contains a black hole about one billion times more massive than our Sun, and is about 5 billion light-years away from Earth in the constellation Virgo.  

With a resolution of 20 μas (microarcseconds) for observations at a wavelength of 1.3 mm, the EHT imaging revealed that two relativistic jets existed.  As shown in the following figure, lower resolution imaging by the Global 3mm VLBI Array (GMVA) and a VLBI array observing at 7 mm wavelength did not show two distinct jets. 

Illustration of multi-wavelength 3C 279 jet structure in April 2017.
The observing dates, arrays, and wavelengths are noted at each panel. Source: J.Y. Kim (MPIfR), Boston University Blazar Program (VLBA and GMVA), and Event Horizon Telescope Collaboration

In their 7 April 2020 press release, the EHT Collaboration reported:  “For 3C 279, the EHT can measure features finer than a light-year across, allowing astronomers to follow the jet down to the accretion disk and to see the jet and disk in action. The newly analyzed data show that the normally straight jet has an unexpected twisted shape at its base and revealing features perpendicular to the jet that could be interpreted as the poles of the accretion disk where the jets are ejected. The fine details in the images change over consecutive days, possibly due to rotation of the accretion disk, and shredding and infall of material, phenomena expected from numerical simulations but never before observed.”

Time-dependent behavior of the two relativistic jets from 
Quasar 3C 279.  Source:  Screenshot from 
Event Horizon Telescope Collaboration video

The following short video (1:14 minutes) from the EHT Collaboration shows the 3C 279 quasar jets and their motion over the course of one week, from 5 April to 11 April 2017, as observed by the EHT.

5. Adding space-based EHT observatories

Imaging the M87 photon ring will be a challenging goal for future observations with an upgraded EHT.  As indicated in the paper by Michael Johnson, et al., an upgraded terrestrial EHT array may be able to “see” the first photon sub-ring.  However, space-based telescopes will be needed to significantly extend the maximum 12,742 km (7,918 miles) baseline of the terrestrial EHT array and provide a capability to image the photon ring in greater detail.

Here’s how the EHT terrestrial baseline would change with space-based observatories:

  • Low Earth orbit (LEO):  Add 370 – 460 km (230 – 286 miles) for a single telescope in an orbit similar to the International Space Station
  • Geosynchronous orbit: Add 35,786 km (22,236 mi) for a single telescope, or up to twice that for multiple telescopes
  • Moon: Add Earth-Moon average distance: 384,472 km (238,900 miles)
  • L2 Lagrange point: Add about 1.5 million km (932,057 miles)

It seems to me that several EHT observatories in geosynchronous orbits could be a good solution that could be implemented sooner than an observatory on the Moon or at L2.  Geosynchronous telescopes would greatly expand the EHT baseline and the spacecraft could make long observing runs from orbital positions that are relatively fixed in relation to the terrestrial EHT sites.  In-orbit servicing would be more practical in geosynchronous orbit than at L2.  In February 2020, Northrop-Grumman demonstrated the ability to remotely restore a large communications satellite that was running out of fuel in geosynchronous orbit.  With remote servicing, a geosynchronous observatory could have a long operating life.

6. In conclusion:

With the ongoing improvements to the terrestrial EHT array and its data recording and processing systems, we should see many more black hole observations reported in the years ahead.  I’m looking forward to direct observation of M87’s photon ring and the first look at the Sagittarius A* black hole near the center of our Milky Way galaxy.  The time delay between data acquisition (i.e., from a series of observation runs of a particular target) and reporting is about three years. This is understandable given the mass of data that must be aggregated from the many EHT observatories to synthesize images of a target black hole.  Hopefully, this time delay can be shortened in the years ahead. 

Within the next decade, a plan to expand the EHT array to include orbital and/or lunar observatories could be in developed.  Hopefully, funding for spacecraft development and deployment will follow.

7. For more information:

See the following sources for more information on the EHT and imaging a black hole:

A Third Source of Gravitational Waves Appears to Have Been Detected

Peter Lobner

The US Laser Interferometer Gravitational-Wave Observatory (LIGO) began its third “observing run,” O3, on 1 April 2019 after a series of upgrades were completed on both LIGO instruments (in Hanford, Washington and Livingston, Louisiana) during an 18-month shutdown period after the second observing run, O2, ended on 25 August 2017.  The European Gravitational Observatory’s (EGO) Virgo instrument also joined O3.  Since its last observing run, which coincided with part of LIGO O2, Virgo also received a series of upgrades that have almost doubled its sensitivity.  O3 is scheduled to last for one calendar year.  Check out the details of these gravitational wave instruments and O3 at the following websites:

On 12 August, the LIGO / Virgo team reported:

“By July 31st, 2019, LIGO had sent out 25 alerts to possible detections, three have since been retracted, leaving us with 22 ‘candidate’ gravitational wave events. We call them “candidates” because we still need time to vet all of them. If all candidates are verified, then the number of detections made by LIGO in just the first third of O3 will double the number of detections made in its first two runs combined……So far, no electromagnetic counterparts related to our public alerts have been observed, but all candidates are being actively analyzed by LSC/Virgo science teams.”

As of July 31, 2019 LIGO/Virgo had seen:

  • 18 binary black hole merger candidates
  • 4 binary neutron star merger candidates

The LIGO-Virgo Collaboration has created the Gravitational Wave Candidate Event Database (GraceDB), which members of the public can access to track observations made during O3 here: 

https://gracedb.ligo.org/superevents/public/O3/

On 14 August 2019, the LIGO and Virgo instruments detected a gravitational wave event that appears to have come from a previously undetected source: the collision of a black hole and a neutron star.  This event, tentatively identified as S190814bv, is estimated to have occurred about 900 million light-years away.   Data from the three detectors enabled scientists to locate the source of these gravitational waves to a 23 square degree region of the sky, which would be about seven times the diameter of the Moon as seen from Earth.  While the gravitational wave signal was characterized as “remarkably strong,” so far, there have been no “multi-messenger” detections in the electromagnetic spectrum to help further refine the location and the nature of the event.

You’ll find a description of a black hole collision with a neutron star on the Simulating eXtreme Spacetimes (SXS) website at the following link:

https://www.black-holes.org/the-science-compact-objects/compact-objects/black-holes-and-neutron-stars

Here, SXS offers the following sequence of events for this exotic collision. 

Neutron star beginning to disrupt. The tidal forces of the black hole squeeze the star like a tube of toothpaste. The distance between the neutron star and the black hole is about 50 km, and they are orbiting hundreds of times per second. Source: SXS
Ejected tail flinging off into space. This matter will eventually contribute rare heavy elements to the interstellar medium. Source: SXS
Accretion disk swirling around the black hole. The accretion disk survives outside the black hole for less than a second. But this is enough time to release an enormous amount of energy in the form of neutrinos. It spans a little more than a hundred km from side to side.
Source: SXS

For more information, check the LIGO and Virgo websites for their news updates.

The Event Horizon Telescope Team has Produced the First Image Showing the Shadow of a Black Hole

Peter Lobner, updated 7 April 2020 & 19 January 2024

The first image of a black hole was released on 10 April 2019  at a press conference in Washington D.C. held by the Event Horizon Telescope (EHT) team and the National Science Foundation (NSF).  The subject of the image is the supermassive black hole known as M87* located near the center of the Messier 87 (M87) galaxy.  This black hole is about 55 million light years from Earth and is estimated to have a mass 6.5 billion times greater than our Sun.  The image shows a glowing circular emission ring surrounding the dark region (shadow) containing the black hole.  The brightest part of the image also may have captured a bright relativistic jet of plasma that appears to be streaming away from the black hole at nearly the speed of light, beaming generally in the direction of Earth.

The first ever image showing the shadow of a black hole (M87*), which remains unseen at the center of the dark circular region. Source:The EHT Collaboration, et al.

The EHT is not one physical telescope.  Rather, it an array of millimeter and sub-millimeter wavelength radio telescopes located around the world.  The following map shows the eight telescopes that participated in the 2017 observations of M87.  Three additional telescopes joined the EHT array in 2018 and later.  

The EHT array as used for the April 2017 observations.  
Source: The EHT Collaboration, et al.

All of the EHT telescopes are used on a non-dedicated basis by an EHT team of more than 200 researchers during a limited annual observing cycle.  The image of the M87* black hole was created from observations made during a one week period in April 2017.

The long baselines between the individual radio telescopes give the “synthetic” EHT the resolving power of a physical radio telescope with a diameter that is approximately equal to the diameter of the Earth. A technique called very long-baseline interferometry (VLBI) is used to combine the data from the individual telescopes to synthesize the image of a black hole. EHT Director, Shep Doeleman, referred to VLBI as “the ultimate in delayed gratification among astronomers.” The magnifying power of the EHT becomes real only when the data from all of the telescopes are brought together and the data are properly combined and processed. This takes time.

At a nominal operating wavelength of about 1.3 mm (frequency of 230 GHz), EHT angular resolution is about 25 microarcseconds (μas), which is sufficient to resolve nearby supermassive black hole candidates on scales that correspond to their event horizons.  The EHT team reports that the M87* bright emission disk subtends an angle of 42 ± 3 microarcseconds.

For comparison, the resolution of a human eye in visible light is about 60 arcseconds (1/60thof a degree; there are 3,600 arcseconds in one degree) and the 2.4-meter diameter Hubble Space Telescope has a resolution of about 0.05 arcseconds (50,000 microarcseconds).

You can read five open access papers on the first M87* Event Horizon Telescope results written by the EHT team and published on 10 April 2019 in the Astrophysical Journal Letters here:

Congratulations to the EHT Collaboration for their extraordinary success in creating the first-ever image of a black hole shadow.

7 April 2020 Update:  EHT observations were complemented by multi-spectral (multi-messenger) observations by NASA spacecraft

On 10 April 2019, NASA reported on its use of several orbiting spacecraft to observe M87 in different wavelengths during the period of the EHT observation.

  • “To complement the EHT findings, several NASA spacecraft were part of a large effort, coordinated by the EHT’s Multiwavelength Working Group, to observe the black hole using different wavelengths of light. As part of this effort, NASA’s Chandra X-ray Observatory, Nuclear Spectroscopic Telescope Array (NuSTAR) and Neil Gehrels Swift Observatory space telescope missions, all attuned to different varieties of X-ray light, turned their gaze to the M87* black hole around the same time as the EHT in April 2017. NASA’s Fermi Gamma-ray Space Telescope was also watching for changes in gamma-ray light from M87* during the EHT observations.”
  • “NASA space telescopes have previously studied a jet extending more than 1,000 light-years away from the center of M87*. The jet is made of particles traveling near the speed of light, shooting out at high energies from close to the event horizon. The EHT was designed in part to study the origin of this jet and others like it.”

NASA’s Neutron star Interior Composition Explorer (NICER) experiment on the International Space Station also contributed to the multi-spectral observations of M87*, which were coordinated by EHT’s Multiwavelength Working Group.

Chandra X-ray Observatory close-up of the core of the M87 galaxy,
showing the location of the M87* black hole (+) and the relativistic jet.
Source: NASA/CXC/Villanova University/J. Neilsen

On April 25, 2019, NASA released the following composite image showing the M87 galaxy, the position of the M87* black hole and large relativistic jets of matter being ejected from the black hole.  These infrared images were made by NASA’s orbiting Spitzer Space Telescope.  

The M87 galaxy, with two expanded views, first showing the location of the M87* black hole and two plasma jets (orange) at the center of the galaxy, and second, the closeup EHT image of the M87* black hole’s shadow.  
Source: NASA/JPL-Caltech/IPAC/Event Horizon Telescope

19 January 2024 Update: Results of the second M87* black hole EHT observation campaign

The original image of the M87* black hole released in April 2019 was derived from data collected during the April 2017 EHT observation campaign.  In January 2024, the EHT Collaboration published the results of a second M87* black hole observation campaign, which took place in April 2018 with an improved global EHT array, wider frequency coverage, and increased bandwidth. This paper shows that the M87* black hole has maintained a similar size in the two images and that the brightest part of the ring surrounding the black hole has rotated about 30 degrees.

Original M87* black hole image (left) & an image from data collected one year later (right). Source: EHT Collaboration via Astronomy & Astrophysics (Jan 2024)

The EHT Collaboration concluded, “The perennial persistence of the ring and its diameter robustly support the interpretation that the ring is formed by lensed emission surrounding a Kerr black hole with a mass ∼6.5 × 109M (mass of the Sun). The significant change in the ring brightness asymmetry implies a spin axis that is more consistent with the position angle of the large-scale jet.”

For more information:

See the following sources for more information on the EHT and imaging the M87* black hole:

Standby for a New Round of Gravitational Wave Detection

Peter Lobner

Since late August 2017, the US LIGO 0bservatories in Washington and Louisiana and the European Gravitational Observatory (EGO), Virgo, in Italy, have been off-line for updating and testing.  These gravitational wave observatories were set to start Observing Run 3 (O3) on 1 April 2019 and conduct continuous observations for one year.  All three of these gravitational wave observatories have improved sensitivities and are capable of “seeing” a larger volume of the universe than in Observing Run 2 (O2).

Later in 2019, the Japanese gravitational wave observatory, KAGRA, is expected to come online for the first time and join O3.  By 2024, a new gravitational wave observatory in India is expected to join the worldwide network.

On the advent of this next gravitational wave detection cycle, here’s is a brief summary of the status of worldwide gravitational wave observatories.

Advanced LIGO 

The following upgrades were implemented at the two LIGO observatories since Observing Run 2 (O2) concluded in 2017:

  • Laser power has been doubled, increasing the detectors’ sensitivity to gravitational waves.
  • Upgrades were made to LIGO’s mirrors at both locations, with five of eight mirrors being swapped out for better-performing versions.
  • Upgrades have been implemented to reduce levels of quantum noise. Quantum noise occurs due to random fluctuations of photons, which can lead to uncertainty in the measurements and can mask faint gravitational wave signals. By employing a technique called quantum “squeezing” (vacuum squeezing), researchers can shift the uncertainty in the laser light photons around, making their amplitudes less certain and their phases, or timing, more certain. The timing of photons is what is crucial for LIGO’s ability to detect gravitational waves.  This technique initially was developed for gravitational wave detectors at the Australian National University, and matured and routinely used since 2010 at the GEO600 gravitational wave detector in Hannover, Germany,

In comparison to its capabilities in 2017 during O2, the twin LIGO detectors have a combined increase in sensitivity of about 40%, more than doubling the volume of the observable universe.

You’ll find more news and information on the LIGO website at the following link:

https://www.ligo.caltech.edu/news

GEO600 

GEO600 is a modest-size laser interferometric gravitational wave detector (600 meter / 1,969 foot arms) located near Hannover, Germany. It was designed and is operated by the Max Planck Institute for Gravitational Physics, along with partners in the United Kingdom.

In mid-2010, GEO600 became the first gravitational wave detector to employ quantum “squeezing” (vacuum squeezing) and has since been testing it under operating conditions using two lasers: its standard laser, and a “squeezed-light” laser that just adds a few entangled photons per second but significantly improves the sensitivity of GEO600.  In a May 2013 paper entitled, “First Long-Term Application of Squeezed States of Light in a Gravitational Wave Observatory,” researchers reported the following results of operational tests in 2011 and 2012.

“During this time, squeezed vacuum was applied for 90.2% (205.2 days total) of the time that science-quality data were acquired with GEO600. A sensitivity increase from squeezed vacuum application was observed broadband above 400 Hz. The time average of gain in sensitivity was 26% (2.0 dB), determined in the frequency band from 3.7 to 4.0 kHz. This corresponds to a factor of 2 increase in the observed volume of the Universe for sources in the kHz region (e.g., supernovae, magnetars).”

The installed GEO600 squeezer (in the foreground) inside the GEO600 clean room together with the vacuum tanks (in the background).  
Source: http://www.geo600.org/15581/1-High-Tech

While GEO600 has conducted observations in coordination with LIGO and Virgo, GEO600 has not reported detecting gravitational waves. At high frequencies GEO600 sensitivity is limited by the available laser power. At the low frequency end, the sensitivity is limited by seismic ground motion.

You’ll find more information on GEO600 at the following link:

http://www.geo600.org/3020/About-GEO600

Advanced Virgo, the European Gravitational Observatory (EGO)

At Virgo, the following upgrades were implemented since Observing Run 2 (O2) concluded in 2017:

  • The steel wires used during O2 observation campaign to suspend the four main mirrors of the interferometer have been replaced.  The 42 kg (92.6 pound) mirrors now are suspended with thin fused-silica (glass) fibers, which are expected to increase the sensitivity in the low-medium frequency region.  The mirrors in Advanced LIGO have been suspended by similar fused-silica fibers since those two observatories went online in 2015.
  • A more powerful laser source has been installed, which should improve sensitivity at high frequencies. 
  • Quantum “squeezing” has been implemented in collaboration with the Albert Einstein Institute in Hannover, Germany.  This should improve the sensitivity at high frequencies.
Virgo mirror suspension with fused-silica fibers.  
Source: EGO/Virgo Collaboration/Perciballi

In comparison to its capabilities in 2017 during O2, Virgo sensitivity has been improved by a factor of about 2, increasing the volume of the observable universe by a factor of about 8.

You’ll find more information on Virgo at the following link:

http://www.virgo-gw.eu

Japan’s KAGRA 

KAGRA is a cryogenically-cooled laser interferometer gravitational wave detector that is sited in a deep underground cavern in Kamioka, Japan.  This gravitational wave observatory is being developed by the Institute for Cosmic Ray Research (ICRR) of the University of Tokyo.  The project website is at the following link:

https://gwcenter.icrr.u-tokyo.ac.jp/en/

One leg of the KAGRA interferometer.  
Source: ICRR, University of Tokyo

The cryogenic mirror cooling system is intended to cool the mirror surfaces to about 20° Kelvin (–253° Celsius) to minimize the motion of molecules (jitter) on the mirror surface and improve measurement sensitivity.   KAGRA’s deep underground site is expected to be “quieter” than the LIGO and VIRGO sites, which are on the surface and have experienced effects from nearby vehicles, weather and some animals.

The focus of work in 2018 was on pre-operational testing and commissioning of various systems and equipment at the KAGRA observatory. In December 2018, the KAGRA Scientific Congress reported that, “If our schedule is kept, we expect to join (LIGO and VIRGO in) the latter half of O3…”   You can follow the latest news from the KAGRA team here:

https://gwcenter.icrr.u-tokyo.ac.jp/en/category/latestnews

LIGO-India

IndIGO, the Indian Initiative in Gravitational-wave Observations, describes itself as an initiative to set up advanced experimental facilities, with appropriate theoretical and computational support, for a multi-institutional Indian national project in gravitational wave astronomy.  The IndIGO website provides a good overview of the status of efforts to deploy a gravitational wave detector in India.  Here’s the link:

http://www.gw-indigo.org/tiki-index.php?page=Welcome

On 22 January 2019, T. V. Padma reported on the Naturewebsite that India’s government had given “in-principle” approval for a LIGO gravitational wave observatory to be built in the western India state of Maharashtra. 

“India’s Department of Atomic Energy and its Department of Science and Technology signed a memorandum of understanding with the US National Science Foundation for the LIGO project in March 2016. Under the agreement, the LIGO Laboratory — which is operated by the California Institute of Technology (Caltech) in Pasadena and the Massachusetts Institute of Technology (MIT) in Cambridge — will provide the hardware for a complete LIGO interferometer in India, technical data on its design, as well as training and assistance with installation and commissioning for the supporting infrastructure. India will provide the site, the vacuum system and other infrastructure required to house and operate the interferometer — as well as all labor, materials and supplies for installation.”

India’s LIGO observatory is expected to cost about US$177 million.  Full funding is expected in 2020 and the observatory currently is planned for completion in 2024.  India’s Inter-University Centre for Astronomy and Astrophysics (IUCAA), also in Maharashtra  state, will lead the project’s gravitational-wave science and the new detector’s data analysis.

For T. V. Padma’s complete article, refer to: 

https://www.nature.com/articles/d41586-019-00184-z.

Spatial resolution of gravitational wave events

Using only the two US LIGO detectors, it is not possible to localize the source of gravitational waves beyond a broad sweep through the sky.  On 1 August 2017, Virgo joined LIGO during the second Observation Run, O2. While the LIGO-Virgo three-detector network was operational for only three-and-a-half weeks, five gravitational wave events were observed.  As shown in the following figure, the spatial resolution of the source was greatly improved when a triple detection was made by the two LIGO observatories and Virgo. These events are labeled with the suffix “HLV”.  

Source:  http://www.virgo-gw.eu, 3 December 2018

The greatly reduced areas of the triple event localizations demonstrate the capabilities of the current global gravitational wave observatory network to resolve the source of a gravitational-wave detection.  The LIGO and Virgo Collaboration reports that it can send Open Public Alerts within five minutes of a gravitational wave detection.

With timely notification and more precise source location information, other land-based and space observatories can collaborate more rapidly and develop a comprehensive, multi-spectral (“multi-messenger”) view of the source of the gravitational waves.

When KAGRA and LIGO-India join the worldwide gravitational wave detection network, it is expected that source localizations will become 5 to 10 times more accurate than can be accomplished with just the LIGO and Virgo detectors.

For more background information on gravitational-wave detection, see the following Lyncean posts: