Category Archives: Information Technology

Free Virtual Tours, Online Collections, and Other Free Resources to Explore on the Internet

Peter Lobner, Updated 9 March 2021

This post contains links to many free virtual tours and other online resources that may be of interest to you.  Also check out the long list of recommended external links on the introductory webpage for Pete’s Lynx, here:

https://lynceans.org/petes-lynx/

This is a great time to explore. Happy surfing!

1. Google Arts & Culture portal:

Here you’ll find virtual tours and online collections from many partner museums and other organizations.  So many, that I suggest that you try finding something of interest in the “A-Z” view.  There are 145 “A’s” and 8 “Z’s,” with more than 2,500 other museums and collections in between.  Start at the following link: https://artsandculture.google.com/partner

Also check out the Streetview tours of famous sites & landmarks here: https://artsandculture.google.com/project/street-view

2. MCN’s Ultimate Guide to Virtual Museum Resources, E-Learning, and Online Collections

On 14 March 2020, MCN (formerly the Museum Computer Network) posted “The Ultimate Guide to Virtual Museum Resources, E-Learning, and Online Collections,” at the following link:  http://mcn.edu/a-guide-to-virtual-museum-resources/

This is a very extensive list of free online resources and their links. MCN notes, “This list will be continually updated with examples of museum and museum-adjacent virtual awesomeness. It is by no means exhaustive….. Every resource is free to access and enjoy.”

3. Library of Congress (LOC)

The LOC has a wide range of digital collections that are easy to access here:  https://www.loc.gov/collections/

4.  Other museums & historic places:

Here are some additional virtual tours to supplement what you’ll find on the Google Arts & Culture portal and MCN’s extensive list of links.

5. Drone video collection:

6. Video and photographic tours:

While you’re browsing these, you’ll find many similar YouTube videos and photos from other sources on the sidebar of your screen.

7. TED Talks:

More than 3,300 talks to stir your curiosity:  https://www.ted.com/talks

8. Internet Archive:

Check out the Internet Archive, which is a non-profit library of millions of free books, movies, software, music, websites, and more.  The main website is here:  https://archive.org.  Direct links to some of the specific parts of the Internet Archive are here:

9. Open Culture: 

The best free cultural & educational media on the web, with more than 1,500 free online courses from top universities, 1,150 free movies, 700 free audio books, 800 free eBooks, 300 free language lessons, 15,000+ free Golden Age comics from the Digital Comic Museum, and more:  http://www.openculture.com/freeonlinecourses

Also visit these related websites:

10. Libraries: 

11. Maps & Globes:

12. Additional resources:

Other authors have provided similar information in the recent articles listed below.  Many of the museums listed in the following articles are accessible via the Google Arts & Culture portal.

Celebrate the 50th Anniversary of the Birth of What Would Become the Modern Internet

Peter Lobner

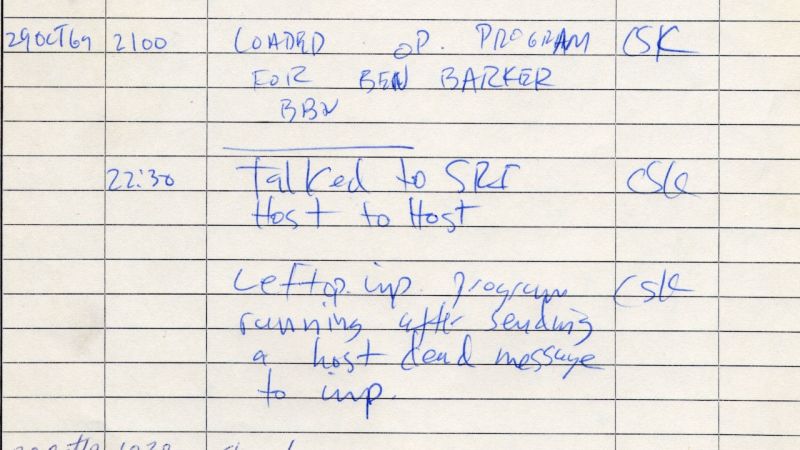
On 29 October 1969, the first host-to-host connection (remote login) between two computers, one at UCLA in Los Angeles and the other at Stanford Research Institute (SRI) in the San Francisco Bay Area, was made over the first deployed general-purpose computer network.  This milestone, which occurred on a project funded by the Advanced Projects Research Agency (ARPA), was the first step toward the ARPANET, and later, what we all know today as the Internet. Remarkably, a UCLA logbook recording this event has been preserved.

One of the logbook pages that documented the first “internet” connection
made on the ARPANET on 29 October 1969 between UCLA and SRI.  
Source: UCLA Special Collections

For a detailed description of this event, see the article by Matt Novak, “Here’s the Internet’s ‘Birth Certificate’ from 50 Years Ago Today,” on the Gizmodo website at the following link:

https://paleofuture.gizmodo.com/heres-the-internets-birth-certificate-from-50-years-ago-1839436583

Verizon became the first wireless carrier to deliver 5G service in the U.S.

Peter Lobner

On 3 April 2019, Verizon reported that it turned on its 5G networks in parts of Chicago and Minneapolis, becoming the first wireless carrier to deliver 5G service to U.S. customers with compatible wireless devices in selected urban areas.  In its initial 5G service, Verizon is offering an average data rate of 450 Mbps (Megabits per second), with plans to achieve higher speeds as the network rollout continues and service matures.  Much of the 5G hype has been on delivering data rates at or above 1 Gbps (Gigabits per second = 1,000 Megabits per second). 

In comparison, Verizon reports that it currently delivers 4G LTE service in 500 markets.  This service is “able to handle download speeds between 5 and 12 Mbps …. and upload speeds between 2 and 5 Mbps, with peak download speeds approaching 50 Mbps.”  Clearly, even Verizon’s initial 5G data rate is a big improvement over 4G LTE. 

At the present time, only one mobile phone works with Verizon’s initial 5G service: the Moto Z3 with an attachment called the 5G Moto Mod.  It is anticipated that the Samsung’s S10 5G smartphone will be the first all-new 5G mobile phone to hit the market, likely later this spring.  You’ll find details on this phone here:

https://www.samsung.com/us/mobile/galaxy-s10/

Other U.S. wireless carriers, including AT&T, Sprint and T-Mobile US, have announced that they plan to start delivering 5G service later in 2019.

5G technology standards

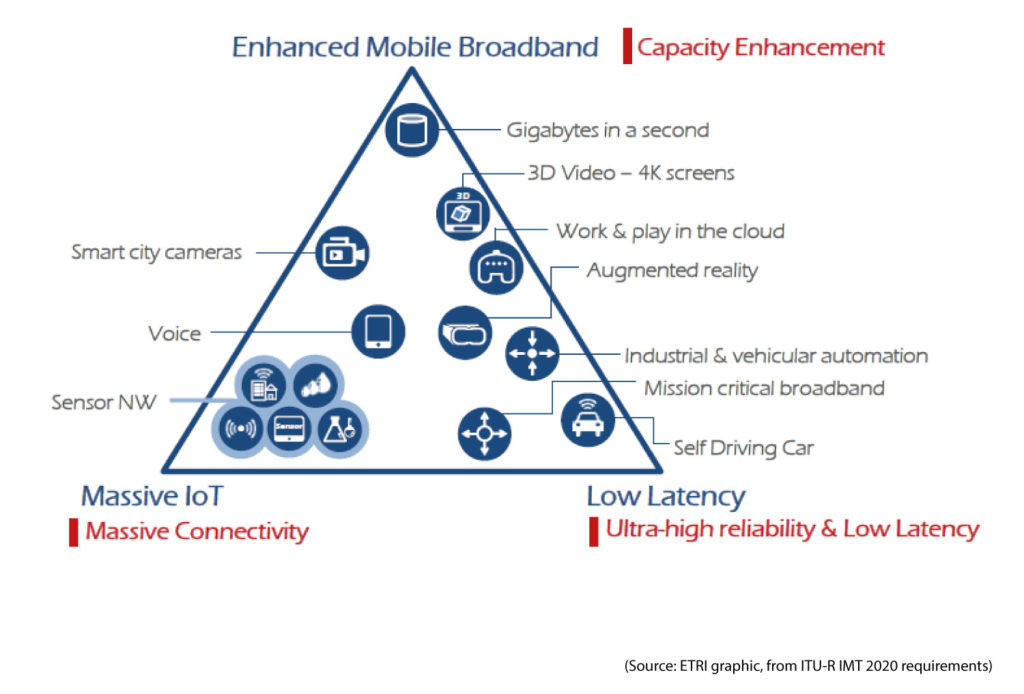
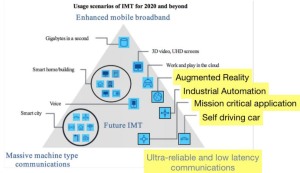
Wireless carriers and suppliers with a stake in 5G are engaged in the processes for developing international standards. However, with no firm 5G technology standard truly in place at this time, the market is still figuring out what 5G features and functionalities will be offered, how they will be delivered, and when they will be ready for commercial introduction.  The range of 5G functionalities being developed are shown in the following ITU diagram.

Range of 5G applications

Verizon’s initial 5G mobile phone promotion is focusing on data speed and low latency.

The primary 5G standards bodies involved in developing the international standards are the 3rd Generation Partnership Project (3GPP), the Internet Engineering Task Force (IETF), and the International Telecommunication Union (ITU).  A key international standard, 5G/IMT-2020, is expected to be issued in (as you might expect) 2020.  

You’ll find a good description of 5G technology by ITU in a February 2018 presentation, “Key features and requirements of 5G/IMT-2020 networks,” which you will find at the following link:

https://www.itu.int/en/ITU-D/Regional-Presence/ArabStates/Documents/events/2018/RDF/Workshop%20Presentations/Session1/5G-%20IMT2020-presentation-Marco-Carugi-final-reduced.pdf

DARPA Spectrum Collaboration Challenge 2 (SC2)

In my 6 June 2016 post, I reported on SC2, which eventually could benefit 5G service by:

 “…developing a new wireless paradigm of collaborative, local, real-time decision-making where radio networks will autonomously collaborate and reason about how to share the RF (radio frequency) spectrum.”

SC2 is continuing into 2019.  Fourteen teams have qualified for Phase 3 of the competition, which will culminate in the Spectrum Collaboration Challenge Championship Event, which will be held on 23 October 2019 in conjunction with the 2019 Mobile World Congress in Los Angeles, CA.  You can follow SC2 news here:

https://www.spectrumcollaborationchallenge.com/media/

If SC2 is successful and can be implemented commercially, it would enable more efficient use of the RF bandwidth assigned for use by 5G systems.

For more background information on 5G, see the following Lyncean posts:

Worldwide Gross Domestic Product (GDP) Trends, 1960 – 2017, and Projections, 2018 – 2100

Peter Lobner

Ian Fraser is an award-winning journalist, commentator and broadcaster who writes about business, finance, politics and economics.  In 2018, under the banner of WawamuStats, he started posting a series of short videos that help visualize trends that are hard to see in voluminous numerical data, but become apparent (even a bit stunning) in a dynamic graphical format.  On its Facebook page, WawamuStats explains:

“Historical data are fun, but reading them is tedious. This page makes these tedious data into a dynamic timeline, which shows historical data.”

Regarding the GDP data used for the dynamic visualizations, WawamuStats states:

“Gross Domestic Product (GDP) is a monetary measure of the market value of all the final goods and services produced in a period of time, often annually or quarterly. Nominal GDP estimates are commonly used to determine the economic performance of a whole country or region, and to make international comparisons.”

Here are the three WawamuStats GDP videos I think you will enjoy.

Top 10 Country GDP Ranking History (1960-2017)

This dynamic visualization shows the top 10 countries with the highest GDP from 1960 to 2017.  At the start, most of the top 10 countries are from Europe and North America. You’ll see the rapid rise of Japan’s economy followed decades later by the rapid rise of China’s economy.

Top 10 Country GDP Per Capita Ranking History (1962-2017)

This dynamic visualization shows the top 10 countries with the highest GDP per capita from 1962 to 2017.  As you will see, most of the top 10 countries are from developed regions in Europe, North America, and Asia. Since 2017, Luxembourg has been regarded as the richest country in terms of GDP per capita.

Future Top 10 Country Projected GDP Ranking (2018-2100)

This dynamic visualization shows how Asian economies are expected to grow and eventually dominate the world economy, with China’s economy, and later India’s economy, exceeding the US economy in terms of GDP, and several European economies dropping out of the top 10 ranking. While the specific national GDP values are only projections, the macro trends, with a strong shift toward Asian economies, probably is correct.

You can find additional dynamic video timelines on the WawamuStats Facebook page here:

https://www.facebook.com/WawamuStats/?ref=py_c

You’ll also can find more information on Ian Fraser on his personal website here:

http://www.ianfraser.org/biography/

Thanks to Lyncean member Mike Spaeth for bringing the WawamuStats dynamic visualizations to my attention.

5G Wireless Defined

Peter Lobner

In my 20 April 2016 post, “5G is Coming, Slowly,” I discussed the evolution of mobile communications technology and the prospects for the deployment of the next generation: 5G. The complexity of 5G service relative to current generation 4G (LTE) service is daunting because of rapidly increasing technical demands that greatly exceed LTE core capabilities. Examples of technical drivers for 5G include the population explosion in the Internet of Things (IoT), the near-term deployment of operational self-driving cars, and the rise of virtual and augmented reality mobile applications.

Progress toward 5G is steadily being made. Here’s a status update.

1. International Telecommunications Union (ITU) technical performance requirements

The ITU is responsible for international standardization of mobile communications technologies. On 23 February 2017, the ITU released a draft report containing their current consensus definition of the minimum technical performance requirements for 5G wireless (IMT-2020) radio service.

The ITU authors note:

“….the capabilities of IMT-2020 are identified, which aim to make IMT-2020 more flexible, reliable and secure than previous IMT when providing diverse services in the intended three usage scenarios, including enhanced mobile broadband (eMBB), ultra-reliable and low-latency communications (URLLC), and massive machine type communications (mMTC).”

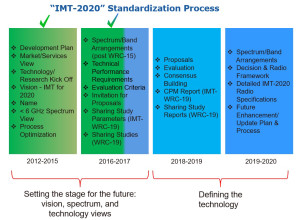
This ITU’s draft technical performance requirements report is a preliminary document that is a product of the second stage of the ITU’s standardization process for 5G wireless deployment, which is illustrated below:

ITU-IMT2020 roadmap crop

Source: ITU

The draft technical performance requirements report provides technical definitions and performance specifications in each of the following categories:

  • Peak data rate
  • Peak spectral efficiency (bits per hertz of spectrum)
  • User experience data rate
  • 5th percentile user spectral efficiency
  • Average spectral efficiency
  • Area traffic capacity
  • Latency
  • Connection density
  • Energy efficiency
  • Reliability
  • Mobility
  • Mobility interruption time
  • Bandwidth

You’ll find a good overview of the ITU’s draft performance requirements in an article by Sebastian Anthony entitled, “5G Specs Announced: “20 Gbps download, 1 ms latency, 1M device per square km,” at the following link:

https://arstechnica.com/information-technology/2017/02/5g-imt-2020-specs/?utm_source=howtogeek&utm_medium=email&utm_campaign=newsletter

You can download the ITU’s draft report, entitled “DRAFT NEW REPORT ITU-R [IMT-2020 TECH PERF REQ] – Minimum requirements related to technical performance for IMT-2020 radio interface(s),” at the following link:

https://www.itu.int/md/R15-SG05-C-0040/en

In the ITU standardization process diagram, above, you can see that their final standardization documents will not be available until 2019 – 2020.

2. Industry 5G activities

Meanwhile, the wireless telecommunications industry isn’t waiting for the ITU to finalize IMT-2020 before developing and testing 5G technologies and making initial 5G deployments.

3rd Generation Partnership Project (3GPP)

In February 2017, the organization 5G Americas summarized the work by 3GPP as follows:

“As the name implies the IMT-2020 process is targeted to define requirements, accept technology proposals, evaluate the proposals and certify those that meet the IMT-2020 requirements, all by the 2020 timeframe. This however, requires that 3GPP start now on discussing technologies and system architectures that will be needed to meet the IMT-2020 requirements. 3GPP has done just that by defining a two phased 5G work program starting with study items in Rel-14 followed by two releases of normative specs spanning Rel-15 and Rel-16 with the goal being that Rel-16 includes everything needed to meet IMT-2020 requirements and that it will be completed in time for submission to the IMT-2020 process for certification.”

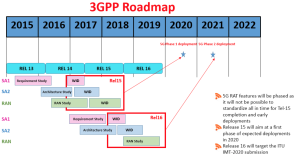
The 2016 3GPP timeline for development of technologies and system architectures for 5G is shown below.

3GGP roadmap 2016

Source: 3GPP / 5G Americas White Paper

Details are presented in the 3GPP / 5G Americas white paper, “Wireless Technology Evolution Towards 5G: 3GPP Releases 13 to Release 15 and Beyond,” which you can download at the following link:

http://www.5gamericas.org/files/6814/8718/2308/3GPP_Rel_13_15_Final_to_Upload_2.14.17_AB.pdf

Additional details are in a February 2017 3GPP presentation, “Status and Progress on Mobile Critical Communications Standards,” which you can download here:

http://www.3gpp.org/ftp/Information/presentations/Presentations_2017/CCE-2017-3GPP-06.pdf

In this presentation, you’ll find the following diagram that illustrates the many functional components that will be part of 5G service. The “Future IMT” in the pyramid below is the ITU’s IMT-2020.

ITU 5G functions

Source: 3GPP presentation

AT&T and Verizon plan initial deployments of 5G technology

In November 2016, AT&T and Verizon indicated that their initial deployment of 5G technologies would be in fixed wireless broadband services. In this deployment concept, a 5G wireless cell would replace IEEE 802.11 wireless or wired routers in a small coverage area (i.e., a home or office) and connect to a wired / fiber terrestrial broadband system. Verizon CEO Lowell McAdam referred to this deployment concept as “wireless fiber.” You’ll find more information on these initial 5G deployment plans in the article, “Verizon and AT&T Prepare to Bring 5G to Market,” on the IEEE Spectrum website at the following link:

http://spectrum.ieee.org/telecom/wireless/verizon-and-att-prepare-to-bring-5g-to-market

Under Verizon’s current wireless network densification efforts, additional 4G nodes are being added to better support high-traffic areas. These nodes are closely spaced (likely 500 – 1,000 meters apart) and also may be able to support early demonstrations of a commercial 5G system.

Verizon officials previously has talked about an initial launch of 5G service in 2017, but also have cautioned investors that this may not occur until 2018.

DARPA Spectrum Collaboration Challenge 2 (SC2)

In my 6 June 2016 post, I reported on SC2, which eventually could benefit 5G service by:

“…developing a new wireless paradigm of collaborative, local, real-time decision-making where radio networks will autonomously collaborate and reason about how to share the RF (radio frequency) spectrum.”

SC2 is continuing into 2019.  Fourteen teams have qualified for Phase 3 of the competition, which will culminate in the Spectrum Collaboration Challenge Championship Event, which will be held on 23 October 2019 in conjunction with the 2019 Mobile World Congress in Los Angeles, CA.  You can follow SC2 news here:

https://www.spectrumcollaborationchallenge.com/media/

If SC2 is successful and can be implemented commercially, it would enable more efficient use of the RF bandwidth assigned for use by 5G systems.

3. Conclusion

Verizon’s and AT&T’s plans for early deployment of a subset of 5G capabilities are symptomatic of an industry in which the individual players are trying hard to position themselves for a future commercial advantage as 5G moves into the mainstream of wireless communications. This commercial momentum is outpacing ITU’s schedule for completing IMT-2020. The recently released draft technical performance requirements provide a more concrete (interim) definition of 5G that should remove some uncertainty for the industry.

3 April 2019 Update:  Verizon became the first wireless carrier to deliver 5G service in the U.S.

Verizon reported that it turned on its 5G networks in parts of Chicago and Minneapolis today, becoming the first wireless carrier to deliver 5G service to customers with compatible wireless devices in selected urban areas.  Other U.S. wireless carriers, including AT&T, Sprint and T-Mobile US, have announced that they plan to start delivering 5G service later in 2019.

New DARPA Grand Challenge: Spectrum Collaboration Challenge (SC2)

Peter Lobner

On 23 March 2016, the Defense Advanced Projects Research Agency (DARPA) announced the SC2 Grand Challenge in Las Vegas at the International Wireless Communications Expo (IWCE). DARPA described this new Grand Challenge as follows:

“The primary goal of SC2 is to imbue radios with advanced machine-learning capabilities so they can collectively develop strategies that optimize use of the wireless spectrum in ways not possible with today’s intrinsically inefficient approach of pre-allocating exclusive access to designated frequencies. The challenge is expected to both take advantage of recent significant progress in the fields of artificial intelligence and machine learning and also spur new developments in those research domains, with potential applications in other fields where collaborative decision-making is critical.”

You can read the DARPA press release on the SC2 Grand Challenge at the following link:

http://www.darpa.mil/news-events/2016-03-23

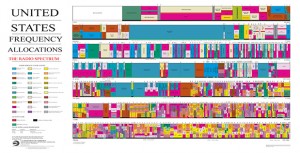
SC2 is a response to the rapid growth in demand for wireless spectrum by both U.S. military and civilian users.  A DARPA representative stated, “The current practice of assigning fixed frequencies for various uses irrespective of actual, moment-to-moment demand is simply too inefficient to keep up with actual demand and threatens to undermine wireless reliability.”  The complexity of the current radio frequency allocation in the U.S. can be seen in the following chart.

image

Chart Source: U.S. Department of Commerce, National Telecommunications and Infrastructure Administration

You can download a high-resolution PDF copy of the above U.S. frequency spectrum chart at the following link:

https://www.ntia.doc.gov/files/ntia/publications/2003-allochrt.pdf

15 July 2016 Update: FCC allocates frequency spectrum to facilitate deploying 5G wireless technologies in the U.S.

On 14 July 2016, the Federal Communications Commission (FCC) announced:

“Today, the FCC adopted rules to identify and open up the high frequency airwaves known as millimeter wave spectrum. Building on a tried-and-true approach to spectrum policy that enabled the explosion of 4G (LTE), the rules set in motion the United States’ rapid advancement to next-generation 5G networks and technologies.

The new rules open up almost 11 GHz of spectrum for flexible use wireless broadband – 3.85 GHz of licensed spectrum and 7 GHz of unlicensed spectrum. With the adoption of these rules, the U.S. is the first country in the world to open high-band spectrum for 5G networks and technologies, creating a runway for U.S. companies to launch the technologies that will harness 5G’s fiber-fast capabilities.”

You can download an FCC fact sheet on this decision at the following link:

https://www.fcc.gov/document/rules-facilitate-next-generation-wireless-technologies

These new rules change the above frequency allocation chart by introducing terrestrial 5G systems into high frequency bands that historically have been used primarily by satellite communication systems.

5G is Coming, Slowly

Peter Lobner

The 5th generation of mobile telephony and data services, or 5G, soon will be arriving at a cellular service provider near each of us, but probably not this year. To put 5G in perspective, let’s start with a bit of telecommunications history.

1. Short History of Mobile Telephony and Data Services

0G non-cellular radio-telephone service:

  • 1946 – Mobile Telephone Service (MTS): This pre-cellular, operator assisted, mobile radio-telephone service required a full duplex VHF radio transceiver in the mobile user’s vehicle to link the mobile user’s phone to the carrier’s base station that connected the call to the public switched telephone network (PSTN) and gave access to the land line network. Each call was allocated to a specific frequency in the radio spectrum allocated for radio-telephone use. This type of access is called frequency division multiple access (FDMA). When the Bell System introduced MTS in 1946 in St. Louis, only three channels were available, later increasing to 32 channels.
  • 1964 – Improved Mobile Telephone Service (IMTS): This service provided full duplex UHF/VHF communications between a radio transceiver (typically rated at 25 watts) in the mobile user’s vehicle and a base station that covered an area 40 – 60 miles (64.3 – 96.6 km) in diameter. Each call was allocated to a specific frequency. The base station connected the call to the PSTN, which gave access to the land line network.

1G analog cellular phone service:

  • 1983 – Advanced Mobile Phone System (AMPS): This was the original U.S. fully automated, wireless, portable, cellular standard developed by Bell Labs. AMPS operated in the 800 MHz band and supported phone calls, but not data. The control link between the cellular phone and the cell site was a digital signal. The voice signal was analog. Motorola’s first cellular phone, DynaTAC, operated on the AMPS network.
    •  AMPS used FDMA, so each user call was assigned to a discrete frequency for the duration of the call. FDMA resulted in inefficient use of the carrier’s allocated frequency spectrum.
    • In Europe the comparable 1G standards were TACS (Total Access Communications System, based on AMPS) and NMT (Nordic Mobile Telephone).
    • The designation “1G” was retroactively assigned to analog cellular services after 2G digital cellular service was introduced. As of 18 February 2008, U.S. carriers were no longer required to support AMPS.

2G digital cellular phone and data services:

  • 1991 – GSM (Global System for Mobile), launched in Finland, was the first digital wireless standard. 2G supports digital phone calls, SMS (Short Message Service) text messaging, and MMS (Multi-Media Message). 2G networks typically provide data speeds ranging from 9.6 kbits/s to 28.8 kbits/s. This relatively slow data speed is too slow to provide useful Internet access in most cases. Phone, messages and the control link between the cellular phone and the cell site all are digital signals.
    •  GSM operates on the 900 and 1,800 MHz bands using TDMA (time division multiple access) to manage up to 8 users per frequency channel. Each user’s digital signal is parsed into discrete time slots on the assigned frequency and then reassembled for delivery.
    • Today GSM is used in about 80% of all 2G devices
  • 1995 – Another important 2G standard is Interim Standard 95 (IS-95), which was the first code division multiple access (CDMA) standard for digital cellular technology. IS-95 was developed by Qualcomm and adopted by the U.S. Telecommunications Industry Association in 1995. In a CDMA network, each user’s digital signal is parsed into discrete coded packets that are transmitted and then reassembled for delivery. For a similar frequency bandwidth, a CDMA cellular network can handle more users than a TDMA network.
  • 2003 – EDGE (Enhanced Data Rates for GSM Evolution) is a backwards compatible evolutionary development of the basic 2G GSM system. EDGE generally is considered to be a pre-3G cellular technology. It uses existing GSM spectra and TDMA access and is capable of improving network capacity by a factor of about three.
  •  In the U.S., some cellular service providers plan to terminate 2G service by the end of 2016.

3G digital cellular phone and data services:

  • 1998 – There are two main 3G standards for cellular data: IMT-2000 and CDMA2000. All 3G networks deliver higher data speeds of at least 200 kbits/s and lower latency (the amount of time it takes for the network to respond to a user command) than 2G. High Speed Packet Access (HSPA) technology enables even higher 3G data speeds, up to 3.6 Mbits/s. This enables a very usable mobile Internet experience with applications such as global positioning system (GPS) navigation, location-based services, video conferencing, and streaming mobile TV and on-demand video.
    •  IMT (International Mobile Telecommunications) -2000 accommodates three different access technologies: FDMA, TDMA and CDMA. Its principal implementations in Europe, Japan, Australia and New Zealand use wideband CDMA (W-CDMA) and is commonly known as the Universal Mobile Telecommunications System (UMTS). Service providers must install almost all new equipment to deliver UMTS 3G service. W-CDMA requires a larger available frequency spectrum than CDMA.
    • CDMA2000 is an evolutionary development of the 2G CDMA standard IS-95. It is backwards compatible with IS-95 and uses the same frequency allocation. CDMA2000 cellular networks are deployed primarily in the U.S. and South Korea.
  • 3.5G enhances performance further, bringing cellular Internet performance to the level of low-end broadband Internet. With peak data speeds of about 7.2 Mbits/sec.

4G digital cellular phone and data services:

  • 2008 – IMT Advanced: This standard, adopted by the International Telecommunications Union (ITU), defines basic features of 4G networks, including all-IP (internet protocol) based mobile broadband, interoperability with existing wireless standards, and a nominal data rate of 100 Mbit/s while the user is moving at high speed relative to the station (i.e., in a vehicle).
  • 2009 – LTE (Long Term Evolution): The primary standard in use today is known as 4G LTE, which first went operational in Oslo and Stockholm in December 2009. Today, all four of the major U.S. cellular carriers offer LTE service.
    • In general, 4G LTE offers full IP services, with a faster broadband connection with lower latency compared to previous generations. The peak data speed typically is 1Gbps, which translates to between 1Mbps and 10Mbps for the end user.
    • There are different ways to implement LTE. Most 4G networks operate in the 700 to 800 MHz range of the spectrum, with some 4G LTE networks operating at 3.5 GHz.

2. The Hype About 5G

The goal of 5G is to deliver a superior wireless experience with speeds of 10Mbps to 100Mbps and higher, with lower latency, and lower power consumption than 4G. Some claim that 5G has the potential to offer speeds up to 40 times faster than today’s 4G LTE networks. In addition, 5G is expected to reduce latency to under a millisecond, which is comparable to the latency performance of today’s high-end broadband service.

With this improved performance, 5G will enable more powerful services on mobile devices, including:

  • Rapid downloads / uploads of large files; fast enough to stream “8K” video in 3-D. This would allow a person with a 5G smartphone to download a movie in about 6 seconds that would take 6 minutes on a 4G network.
  • Enable deployment of a wider range of IoT (Internet of Things) devices on networks where everything is connected to everything else and IoT devices are communicating in real-time. These devices include “smart home” devices and longer-lasting wearable devices, both of which benefit from 5G’s lower power consumption and low latency.
  • Provide better support for self-driving cars, each of which is a complex IoT node that needs to communicate in real time with external resources for many functions, including navigation, regional (beyond the range of the car’s own sensors) situation awareness, and requests for emergency assistance.
  • Provide better support for augmented reality / virtual reality and mobile real-time gaming, both of which benefit from 5G’s speed and low latency

3. So what’s the holdup?

5G standards have not yet been yet and published. The ITU’s international standard is expected to be known as IMT-2020. Currently, the term “5G” doesn’t signify any particular technology.

5G development is focusing on use of super-high frequencies, as high as 73 GHz. Higher frequencies enable faster data rates and lower latency. However, at the higher frequencies, the 5G signals are usable over much shorter distances than 4G, and the 5G signals are more strongly attenuated by walls and other structures. This means that 5G service will require deployment of a new network architecture and physical infrastructure with cell sizes that are much smaller than 4G. Cellular base stations will be needed at intervals of perhaps every 100 – 200 meters (328 to 656 feet). In addition, “mini-cells” will be needed inside buildings and maybe even individual rooms.

Fortunately, higher frequencies allow use of smaller antennae, so we should have more compact cellular hardware for deploying the “small cell” architecture. Get ready for new cellular nomenclature, including “microcells”, “femtocells” and “picocells”.

Because of these infrastructure requirements, deployment of 5G will require a significant investment and most likely will be introduced first in densely populated cities.

Initial introduction date is unlikely to be before 2017.

More details on 5G are available in a December 2014 white paper by GMSA Intelligence entitled, “Understanding 5G: Perspectives on Future Technological Advances in Mobile,” which you can download at the following link:

https://gsmaintelligence.com/research/?file=141208-5g.pdf&download

Note that 5G’s limitations inside buildings and the need for “mini-cells” to provide interior network coverage sound very similar to the limitations for deploying Li-Fi, which uses light instead of radio frequencies for network communications. See my 12 December 2015 post for information of Li-Fi technology.

15 July 2016 Update: FCC allocates frequency spectrum to facilitate deploying 5G wireless technologies in the U.S.

On 14 July 2016, the Federal Communications Commission (FCC) announced:

“Today, the FCC adopted rules to identify and open up the high frequency airwaves known as millimeter wave spectrum. Building on a tried-and-true approach to spectrum policy that enabled the explosion of 4G (LTE), the rules set in motion the United States’ rapid advancement to next-generation 5G networks and technologies.

The new rules open up almost 11 GHz of spectrum for flexible use wireless broadband – 3.85 GHz of licensed spectrum and 7 GHz of unlicensed spectrum. With the adoption of these rules, the U.S. is the first country in the world to open high-band spectrum for 5G networks and technologies, creating a runway for U.S. companies to launch the technologies that will harness 5G’s fiber-fast capabilities.”

You can download an FCC fact sheet on this decision at the following link:

https://www.fcc.gov/document/rules-facilitate-next-generation-wireless-technologies

These new rules should hasten the capital investments needed for timely 5G deployments in the U.S.

Synthetic Aperture Radar (SAR) and Inverse SAR (ISAR) Enable an Amazing Range of Remote Sensing Applications

Peter Lobner

SAR Basics

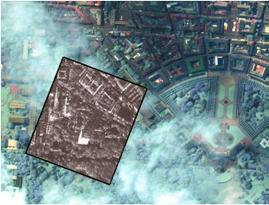
Synthetic Aperture Radar (SAR) is an imaging radar that operates at microwave frequencies and can “see” through clouds, smoke and foliage to reveal detailed images of the surface below in all weather conditions. Below is a SAR image superimposed on an optical image with clouds, showing how a SAR image can reveal surface details that cannot be seen in the optical image.

Example SAR imageSource: Cassidian radar, Eurimage optical

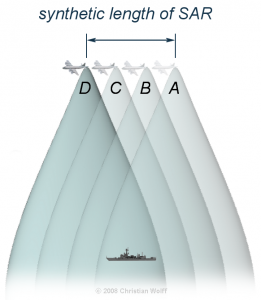
SAR systems usually are carried on airborne or space-based platforms, including manned aircraft, drones, and military and civilian satellites. Doppler shifts from the motion of the radar relative to the ground are used to electronically synthesize a longer antenna, where the synthetic length (L) of the aperture is equal to: L = v x t, where “v” is the relative velocity of the platform and “t” is the time period of observation. Depending on the altitude of the platform, “L” can be quite long. The time-multiplexed return signals from the radar antenna are electronically recombined to produce the desired images in real-time or post-processed later.

SAR principle

Source: Christian Wolff, http://www.radartutorial.eu/20.airborne/pic/sar_principle.print.png

This principle of SAR operation was first identified in 1951 by Carl Wiley and patented in 1954 as “Simultaneous Buildup Doppler.”

SAR Applications

There are many SAR applications, so I’ll just highlight a few.

Boeing E-8 JSTARS: The Joint Surveillance Target Attack Radar System is an airborne battle management, command and control, intelligence, surveillance and reconnaissance platform, the prototypes of which were first deployed by the U.S. Air Force during the 1991 Gulf War (Operation Desert Storm). The E-8 platform is a modified Boeing 707 with a 27 foot (8 meter) long, canoe-shaped radome under the forward fuselage that houses a 24 foot (7.3 meters) long, side-looking, multi-mode, phased array antenna that includes a SAR mode of operation. The USAF reports that this radar has a field of view of up to 120-degrees, covering nearly 19,305 square miles (50,000 square kilometers).

E-8 JSTARSSource: USAF

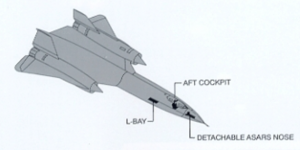
Lockheed SR-71: This Mach 3 high-altitude reconnaissance jet carried the Advanced Synthetic Aperture Radar System (ASARS-1) in its nose. ASARS-1 had a claimed 1 inch resolution in spot mode at a range of 25 to 85 nautical miles either side of the flight path.  This SAR also could map 20 to 100 nautical mile swaths on either side of the aircraft with lesser resolution.

SR-71Source: http://www.wvi.com/~sr71webmaster/sr_sensors_pg2.htm

Northrop RQ-4 Global Hawk: This is a large, multi-purpose, unmanned aerial vehicle (UAV) that can simultaneously carry out electro-optical, infrared, and synthetic aperture radar surveillance as well as high and low band signal intelligence gathering.

Global HawkSource: USAF

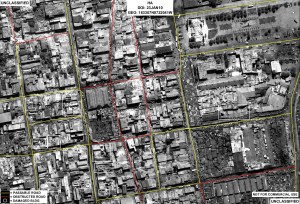
Below is a representative RQ-4 2-D SAR image that has been highlighted to show passable and impassable roads after severe hurricane damage in Haiti. This is an example of how SAR data can be used to support emergency management.

Global Hawk Haiti post-hurricane image123-F-0000X-103Source: USAF

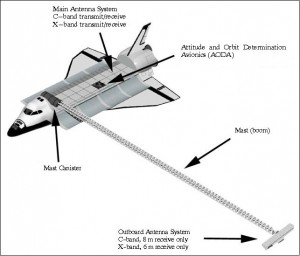
NASA Space Shuttle: The Shuttle Radar Topography Mission (SRTM) used the Space-borne Imaging Radar (SIR-C) and X-Band Synthetic Aperture Radar (X-SAR) to map 140 mile (225 kilometer) wide swaths, imaging most of Earth’s land surface between 60 degrees north and 56 degrees south latitude. Radar antennae were mounted in the Space Shuttle’s cargo bay, and at the end of a deployable 60 meter mast that formed a long-baseline interferometer. The interferometric SAR data was used to generate very accurate 3-D surface profile maps of the terrain.

Shuttle STRMSource: NASA / Jet Propulsion Laboratory

An example of SRTM image quality is shown in the following X-SAR false-color digital elevation map of Mt. Cotopaxi in Ecuador.

Shuttle STRM imageSource: NASA / Jet Propulsion Laboratory

You can find more information on SRTM at the following link:

https://directory.eoportal.org/web/eoportal/satellite-missions/s/srtm

ESA’s Sentinel satellites: Refer to my 4 May 2015 post, “What Satellite Data Tell Us About the Earthquake in Nepal,” for information on how the European Space Agency (ESA) assisted earthquake response by rapidly generating a post-earthquake 3-D ground displacement map of Nepal using SAR data from multiple orbits (i.e., pre- and post-earthquake) of the Sentinel-1A satellite.  You can find more information on the ESA Sentinel SAR platform at the following link:

http://www.esa.int/Our_Activities/Observing_the_Earth/Copernicus/Sentinel-1/Introducing_Sentinel-1

You will find more general information on space-based SAR remote sensing applications, including many high-resolution images, in a 2013 European Space Agency (ESA) presentation, “Synthetic Aperture Radar (SAR): Principles and Applications”, by Alberto Moreira, at the following link:

https://earth.esa.int/documents/10174/642943/6-LTC2013-SAR-Moreira.pdf

ISAR Basics

ISAR technology uses the relative movement of the target rather than the emitter to create the synthetic aperture. The ISAR antenna can be mounted in a airborne platform. Alternatively, ISAR also can be used by one or more ground-based antennae to generate a 2-D or 3-D radar image of an object moving within the field of view.

ISAR Applications

Maritime surveillance: Maritime surveillance aircraft commonly use ISAR systems to detect, image and classify surface ships and other objects in all weather conditions. Because of different radar reflection characteristics of the sea, the hull, superstructure, and masts as the vessel moves on the surface of the sea, vessels usually stand out in ISAR images. There can be enough radar information derived from ship motion, including pitching and rolling, to allow the ISAR operator to manually or automatically determine the type of vessel being observed. The U.S. Navy’s new P-8 Poseidon patrol aircraft carry the AN/APY-10 multi-mode radar system that includes both SAR and ISAR modes of operation.

The principles behind ship classification is described in detail in the 1993 MIT paper, “An Automatic Ship Classification System for ISAR Imagery,” by M. Menon, E. Boudreau and P. Kolodzy, which you can download at the following link:

https://www.ll.mit.edu/publications/journal/pdf/vol06_no2/6.2.4.shipclassification.pdf

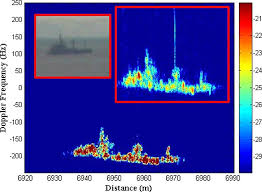
You can see in the following example ISAR image of a vessel at sea that vessel classification may not be obvious to the casual observer. I can see that an automated vessel classification system is very useful.

Ship ISAR image

Source: Blanco-del-Campo, A. et al., http://ieeexplore.ieee.org/xpl/login.jsp?tp=&arnumber=5595482&url=http%3A%2F%2Fieeexplore.ieee.org%2Fiel5%2F7361%2F5638351%2F05595482.pdf%3Farnumber%3D5595482

Imaging Objects in Space: Another ISAR (also called “delayed Doppler”) application is the use of one or more large radio telescopes to generate radar images of objects in space at very long ranges. The process for accomplishing this was described in a 1960 MIT Lincoln Laboratory paper, “Signal Processing for Radar Astronomy,” by R. Price and P.E. Green.

Currently, there are two powerful ground-based radars in the world capable of investigating solar system objects: the National Aeronautics and Space Administration (NASA) Goldstone Solar System Radar (GSSR) in California and the National Science Foundation (NSF) Arecibo Observatory in Puerto Rico. News releases on China’s new FAST radio telescope have not revealed if it also will be able to operate as a planetary radar (see my 18 February 2016 post).

The 230 foot (70 meter) GSSR has an 8.6 GHz (X-band) radar transmitter powered by two 250 kW klystrons. You can find details on GSSR and the techniques used for imaging space objects in the article, “Goldstone Solar System Radar Observatory: Earth-Based Planetary Mission Support and Unique Science Results,” which you can download at the following link:

http://echo.jpl.nasa.gov/asteroids/Slade_Benner_Silva_IEEE_Proceedings.pdf

The 1,000 foot (305 meter) Arecibo Observatory has a 2.38 GHz (S-band) radar transmitter, originally rated at 420 kW when it was installed in 1974, and upgraded in 1997 to 1 MW along with other significant upgrades to improve radio telescope and planetary radar performance. You will find details on the design and upgrades of Arecibo at the following link:

http://www.astro.wisc.edu/~sstanimi/Students/daltschuler_2.pdf

The following examples demonstrate the capabilities of Arecibo Observatory to image small bodies in the solar system.

  • In 1999, this radar imaged the Near-Earth Asteroid 1999 JM 8 at a distance of about 5.6 million miles (9 million km) from Earth. The ISAR images of this 1.9 mile 3-km) sized object had a resolution of about 49 feet (15 meters).
  • In November 1999, Arecibo Observatory imaged the tumbling Main-Belt Asteroid 216 Kleopatra. The resulting ISAR images, which made the cover of Science magazine, showed a dumbbell-shaped object with an approximate length of 134.8 miles (217 kilometers) and varying diameters up to 58.4 miles (94 kilometers).

Asteroid image  Source: Science

More details on the use of Arecibo Observatory to image planets and other bodies in the solar system can be found at the following link:

http://www.naic.edu/general/index.php?option=com_content&view=article&id=139&Itemid=474

The NASA / Jet Propulsion Laboratory Asteroid Radar Research website also contains information on the use of radar to map asteroids and includes many examples of asteroid radar images. Access this website at the following link:

http://echo.jpl.nasa.gov

Miniaturization

In recent years, SAR units have become smaller and more capable as hardware is miniaturized and better integrated. For example, Utah-based Barnard Microsystems offers a miniature SAR for use in lightweight UAVs such as the Boeing ScanEagle. The firm claimed that their two-pound “NanoSAR” radar, shown below, weighed one-tenth as much as the smallest standard SAR (typically 30 – 200 pounds; 13.6 – 90.7 kg) at the time it was announced in March 2008. Because of power limits dictated by the radar circuit boards and power supply limitations on small UAVs, the NanoSAR has a relatively short range and is intended for tactical use on UAVs flying at a typical ScanEagle UAV operational altitude of about 16,000 feet.

Barnard NanoSARSource: Barnard Microsystems

ScanEagle_UAVScanEagle UAV. Source: U.S. Marine Corps.

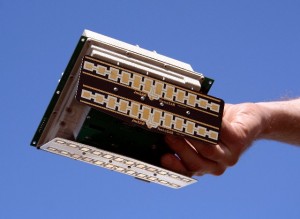
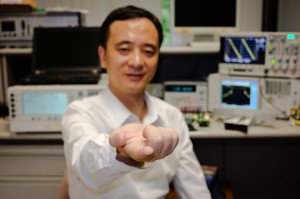
Nanyang Technological University, Singapore (NTU Singapore) recently announced that its scientists had developed a miniaturized SAR on a chip, which will allow SAR systems to be made a hundred times smaller than current ones.

?????????????????????????????????????????????????????????Source: NTU

NTU reports:

“The single-chip SAR transmitter/receiver is less than 10 sq. mm (0.015 sq. in.) in size, uses less than 200 milliwatts of electrical power and has a resolution of 20 cm (8 in.) or better. When packaged into a 3 X 4 X 5-cm (0.9 X 1.2 X 1.5 in.) module, the system weighs less than 100 grams (3.5 oz.), making it suitable for use in micro-UAVs and small satellites.”

NTU estimates that it will be 3 to 6 years before the chip is ready for commercial use. You can read the 29 February 2016 press release from NTU at the following link:

http://media.ntu.edu.sg/NewsReleases/Pages/newsdetail.aspx?news=c7aa67e7-c5ab-43ae-bbb3-b9105a0cd880

With such a small and hopefully low cost SAR that can be integrated with low-cost UAVs, I’m sure we’ll soon see many new and useful radar imaging applications.

Using Light Instead of Radio Frequencies, Li-Fi has the Potential to Replace Wi-Fi for High-speed Local Network Communications

Peter Lobner

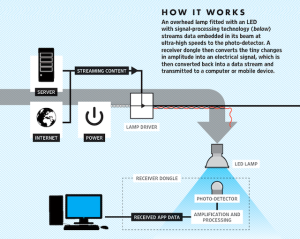
Professor Harald Haas (University of Edinburgh) invented Li-Fi wireless technology, which is functionally similar to radio-frequency Wi-Fi but uses visible light to communicate at high speed among devices in a network. Professor Hass is the founder of the company PureLiFi (http://purelifi.com), which is working to commercialize this technology. The following diagram from PureLiFi explains how Li-Fi technology works.

Li-Fi-How_VLC_works

A special (smart) LED (light-emitting diode) light bulb capable of modulating the output light, and a photoreceptor connected to the end-user’s device are required.

You can see Professor Hass’ presentation on Li-Fi technology on the TED website at the following link:

http://www.ted.com/talks/harald_haas_wireless_data_from_every_light_bulb?language=en#t-233169

Key differences between Li-Fi and Wi-Fi include:

  • Li-Fi is implemented via a smart LED light bulb that includes a microchip for handling the local data communications function. Many LED light bulbs can be integrated into a broader network with many devices.
    • Light bulbs are everywhere, opening the possibility for large Li-Fi networks integrated with modernized lighting systems.
  • Li-Fi offers significantly higher data transfer rates than Wi-Fi.
    • In an industrial environment, Estonian startup firm Velmenni has demonstrated 1 GBps (gigabits per second). Under laboratory conditions, rates up to 224 gigabits/sec have been achieved.
  • Li-Fi requires line-of-sight communications between the smart LED light bulb and the device using Li-Fi network services.
    • While this imposes limitations on the application of Li-Fi technology, it greatly reduces the potential for network interference among devices.
  • Li-Fi may be usable in environments where Wi-Fi is not an acceptable alternative.
    • Some hazardous gas and explosive handling environments
    • Commercial passenger aircraft when current wireless devices must be in “airplane mode” with Wi-Fi OFF.
    • Some classified / high-security facilities
  • Li-Fi cannot be used in some environments where Wi-Fi can be successfully employed.
    • Bright sunlight areas or other areas with bright ambient lighting

You can see a video with a simple Li-Fi demonstration using a Velmenni Jugnu smart LED light bulb and a smartphone at the following link:

http://velmenni.com

Velmenni smart LED

The radio frequency spectrum for Wi-Fi is crowded and will only get worse in the future. A big benefit of Li-Fi technology is that it does not compete for any part of the spectrum used by Wi-Fi.

Searching the Internet of Things

Peter Lobner

The company Shodan (https://www.shodan.io) makes a search engine for Internet connected devices, which commonly is referred to as the “Internet of things”. The Shodan website explains that the intent of this search engine is to provide the following services:

Explore the Internet of Things

  • Use Shodan to discover which of your devices are connected to the Internet, where they are located, and who is using them.

Monitor Network Security

  • Keep track of all the computers on your network that are directly accessible from the Internet. Shodan lets you understand your digital footprint.

Get a Competitive Advantage

  • Who is using your product? Where are they located? Use Shodan to develop empirical market intelligence.

See the Big Picture

  • Websites are just one part of the Internet. There are power plants, smart TVs, smart appliances, and much more that can be found with Shodan.

From a security point-of-view, the last point, above, should seem a bit unsettling to the owners / operators of the power plants, smart TVs and smart appliances.

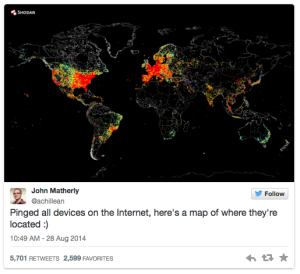
Shodan founder, John Matherly, claims to have “pinged” all devices on the internet.  Not surprisingly, the results, which are reproduced below, show that internet-connected devices are concentrated in developed nations and metropolitan areas. These results were reported on Twitter at the following link:

https://twitter.com/achillean/status/505049645245288448/photo/1

Shodan 2014 ping of Internet of Things