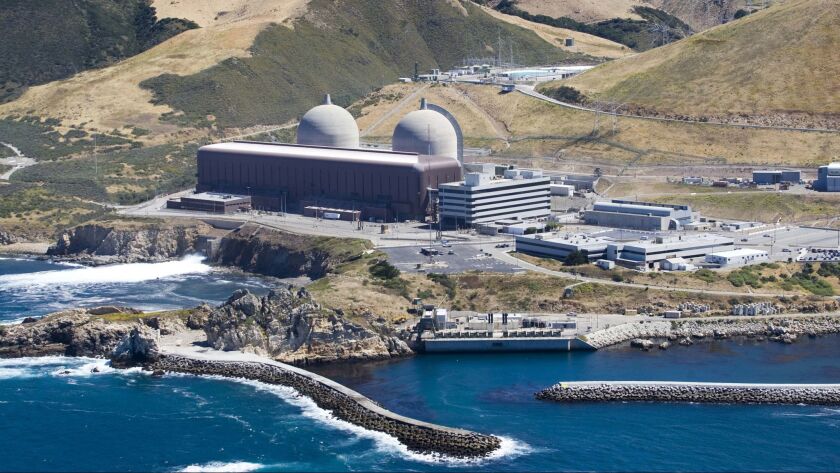
The two-unit Diablo Canyon nuclear power plant, which is owned and operated by Pacific Gas & Electric (PG&E), is the last operating nuclear power station in California. In the five year period from 2016 – 2020, the average annual load factor performance of these power plants was as follows:
Diablo Canyon 1: 1,138 MWe net @ 91.56% = 1.042 Gigawatt-years (GW-years) generated per year
Diablo Canyon 2: 1,118 MWe net @ 85.64% = 0.957 GW-years generated per year
Over that five year period, the average annual amount of electricity delivered to the California electrical grid by the two-unit Diablo Canyon nuclear power plant was about 2.0 GW-years (2,000 Megawatt-years or 17,520,000 Megawatt-hours). On a daily basis, that’s an average of about 48,000 MW-hours. This electricity was generated reliably, 24/7 (except during planned outages), with zero carbon emissions.
The Diablo Canyon nuclear plant in Avila Beach, CA. Source: Joe Johnston / San Luis Obispo Tribune via LA Times (2018)
“On 21 June 2016, PG&E issued a press release announcing that they will withdraw their application to the NRC for a 20-year license extension for the Diablo Canyon 1 & 2 nuclear power plants and will close these plants by 2025 when their current operating licenses expire. PGE will walk away from about 41 GW-years of carbon-free electric power generation.”
The shutdown plan was approved by the California Public Utilities Commission in January 2018.
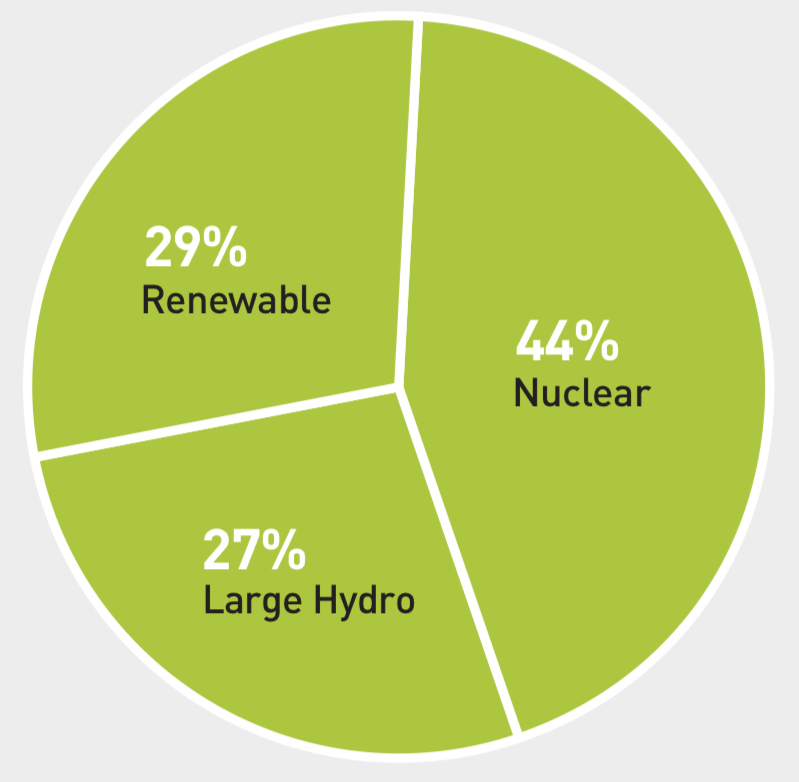
In 2019, PG&E reported that their mix of generation sources (owned and purchased from a third-party) looked like this:
Source: PG&E (2019)
A few interesting points about this PG&E generation source chart:
Nuclear power generation is the biggest piece of the pie chart. Shutdown of Diablo Canyon by 2025 will eliminate this piece.
Renewables include wind, solar, small hydro, geothermal and biomass / waste. Batteries are not included because they are energy storage devices, not energy generation sources. The energy stored in a grid-scale battery comes from a generator, or simply, from the grid.
Large hydro depends on the associated reservoirs having enough water in them. The Edward Hyatt hydroelectric power plant at Lake Oroville (California’s second-largest reservoir) was shut down in August 2021 for the first time since it opened in 1967 because of low water levels during the persistent drought affecting the US West. Power production at Oroville resumed in January 2022 with only a single hydroelectric generator, after heavy winter precipitation increased lake water level. If the drought continues, the large hydro piece of the pie chart will shrink.
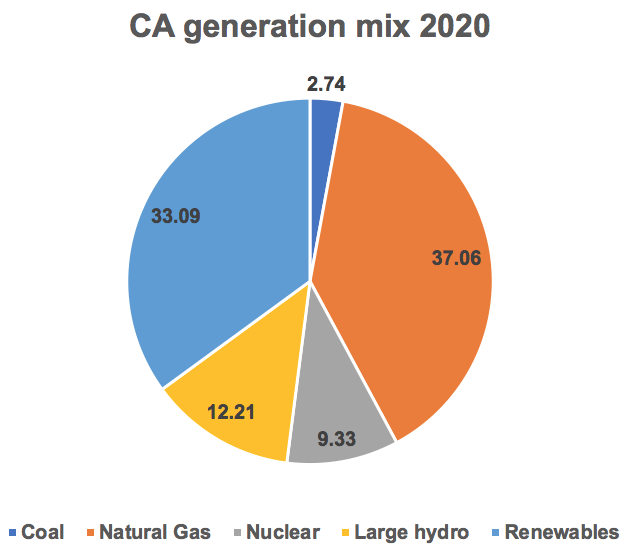
Another point is that the PG&E generation source mix is quite different from the California state-wide generation source mix reported by the California Energy Commission in 2020 and shown in the following pie chart. Not all of the generation sources represented in this chart are physically located in California (more on that later).
Source: Data from California Energy Commission (2020)
Diablo Canyon has a disproportionate impact on the PG&E generation mix because they own the nuclear power plant and they take credit for its entire net generation. State-wide, nuclear power makes up only 9.33% of the state generation mix in a much larger electric power market.
When Diablo Canyon is shut down in 2025, I would think that the PG&E energy generation mix will look a lot more like the California state-wide generation mix, with most of the nuclear power generation share being replaced, at least in the short term, by fossil fuel-powered generators.
In January 2022, PG&E announced that they have a plan: “PG&E Corp. said it has reached agreements to install nine new battery energy storage projects as part of a push to replace a retiring nuclear power plant and help decarbonize California’s power grid.”
So, let me see if I’ve got this right. PG&E is going to use grid-scale storage batteries that produces zero carbon emissions during their operation to partially replace a nuclear power generating station that produces zero carbon emissions during 24/7 operation. Where will the power come from to charge those batteries? It’ll come from the California Independent System Operator (CAISO) grid, which has the California state-wide generation source mix shown above, with almost 40% coming from fossil fuel-powered generators in 2020, and likely to increase after Diablo Canyon’s retirement. So, one charge-discharge cycle of a grid-scale battery isn’t carbon-free.
PG&E further announced, “The proposed projects would have a total capacity of about 1,600 megawatts, which would bring its total battery energy storage capacity to more than 3,300 gigawatts by 2024…”
On the surface, that sounds like an impressive amount of battery capacity, but let’s put it in perspective.
The former Moss Landing fossil power station on Monterey Bay was decommissioned and transformed into a grid-scale energy storage facility. In August 2021, after completing Phase II of the transformation, the facility was operating with a capacity of 400 MW / 1,600 MW-hours, making it the world’s largest grid-storage project. The facility’s owner, Vistra Energy, said the Moss Landing facility could be expanded to a capacity of up to 1,600 MW / 6,000 MWh.
At its current discharge capacity of 400 MW, the Moss Landing batteries could discharge their full energy storage capacity of 1,600 MW-hours in about four hours. Then the battery is “empty” and needs to be recharged from the CAISO grid (as we discussed, that’s about 40% from fossil-powered generation sources in 2020). Of course, a grid-storage facility wouldn’t be operated regularly on such a stressful cycle. But my point is that the world’s largest grid-storage project is be capable of delivering no more than 3.3% of the 48,000 MW-hours of electricity delivered daily, 24/7, with zero carbon emissions, by the Diablo Canyon nuclear power plant.
California has a huge, and growing, energy problem of its own making. With Diablo Canyon and several fossil-powered generators scheduled for retirement in the next few years, the state needs new generating capacity. However, the development time scale for a new large generating facility in California, especially considering the state’s challenging regulatory environment, might have to be measured in decades.
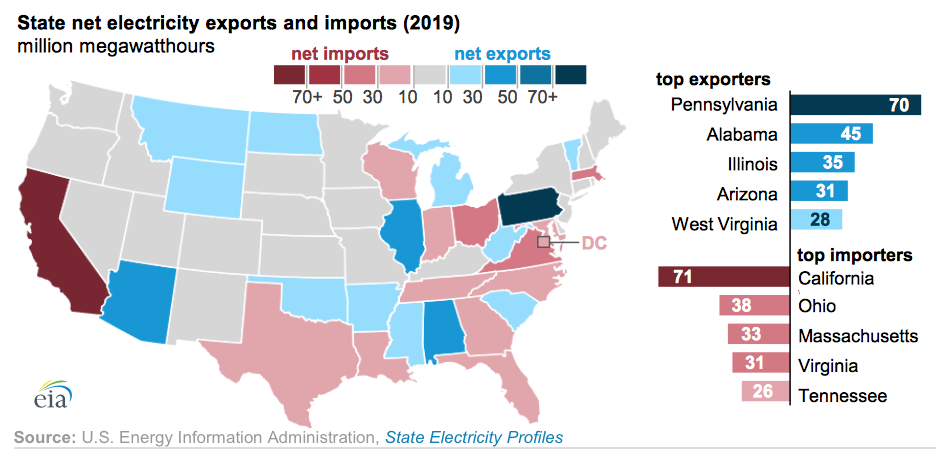
One of California’s solutions to its shortfall of electrical generating capacity is to import electric power from other states and nations. The U.S. Energy Information Administration (EIA) reported that California was the largest net electricity importer, by a wide margin, of any state in 2019. Its net electricity imports were 70.8 million MW-hours, or 25% of the state’s total electricity usage. California utilities partly own and import power from several power plants in Arizona and Utah. In addition, California’s electricity imports include hydroelectric power from the Pacific Northwest and power from fossil and wind generators in Mexico.
Source: EIA
Grid-scale battery storage is not going to solve the state’s shortfall of electrical generating capacity. Rather, the batteries are a means to mitigate short-term demand peaks and help stabilize the grid as generators attempt to match energy supply with demand.
Another mitigating measure used by CAISO is a “flex alert,” which asks consumers to cut back on electricity usage and move their electricity usage to off-peak hours, typically after 9 pm. CAISO issued five flex alerts in 2020 and eight in 2021. When a grid-scale battery is discharged during a flex alert, recharging it would add a large load on an already strained grid; probably not a good idea.
California is throwing away valuable 24/7 generating capacity and replacing it with intermittent renewable generators, with grid-scale energy storage facilities to provide short-term mitigation that doesn’t address the real underlying problem. There is no substitute for adequate generating capacity, sized to meet the current and future demands of businesses and individuals as we try to move together into a more electrified future.
Failing that, I can see increasing electric power rates, more flex alerts, and in California, I wouldn’t be surprised to see some form of legislated energy rationing coupled with higher energy use taxation. So much for that vision of a more electrified future.
Don’t sell you gasoline or diesel-powered car yet. You may need it during the next flex alert.
20 February 2022 update: Moss Landing battery fires
Since becoming operational, Vistra Energy’s Moss Landing battery storage facility on Monterey Bay experienced two damaging fire events in lithium-ion battery packs. A fire on 4 September 2021 set off fire suppression system sprinklers that damaged about 7,000 batteries. Vistra Energy reported corrective actions following this fire on 21 January 2022. Another fire on 13 February 2022 resulted in 10 melted lithium-ion battery packs. The latest fire event was contained by the facility’s fire suppression system. Vistra reported that it was looking further into the latest incident, while the Moss Landing facility remains offline during the investigation.
Under the Manhattan Project and through the Cold War, the U.S. developed and operated a dedicated nuclear weapons complex that performed all of the functions needed to transform raw materials into complete nuclear weapons. After the end of the Cold War (circa 1991), U.S. and Russian nuclear weapons stockpiles were greatly reduced. In the U.S., the nuclear weapons complex contracted and atrophied, with some functions being discontinued as the associated facilities were retired without replacement, while other functions continued at a reduced level, many in aging facilities.
In its current state, the U.S. nuclear weapons complex is struggling to deliver an adequate supply of tritium to meet the needs specified by the National Nuclear Security Administration (NNSA) for “stockpile stewardship and maintenance,” or in other words, for keeping the nuclear weapons in the current, smaller stockpile safe and operational. Key issues include:
There have been no dedicated tritium production reactors operating since 1988. Natural radioactive decay has been steadily reducing the existing inventory of tritium.
Commercial light water reactors (CLWRs) have been put into dual-use service since 2003 to produce tritium for NNSA while generating electric power that is sold commercially. The current tritium production rate needs to increase significantly to meet needs.
There has been a continuing decline in the national inventory of “unobligated” (i.e., free from peaceful use obligations) low-enriched uranium (LEU) and high-enriched uranium (HEU). This unobligated uranium can be used for military purposes, such as fueling the dual-use tritium production reactors.
There has been no “unobligated” U.S. uranium enrichment capability since 2013. The technology for a replacement enrichment facility has not yet been selected.
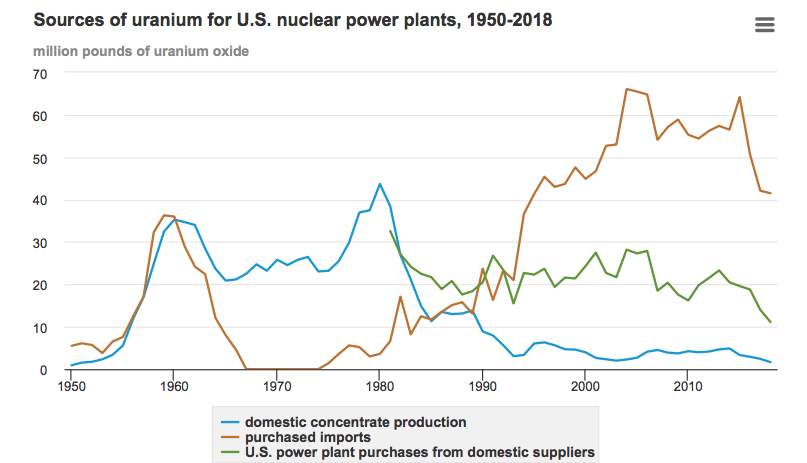
The U.S. domestic uranium production industry has declined to a small fraction of the capacity that existed from the mid-1950s to the mid-1980s. About 10% of uranium purchases in 2018 were from U.S. suppliers, and 90% came from other countries. NNSA’s new enrichment facility will need a domestic source of natural uranium.
There has been no operational lithium-6 production facility since the late 1980s.
There has been a continuing decline in the national inventory of enriched lithium-6, which is irradiated in “targets” to produce tritium.
Only one tritium extraction facility exists.
The U.S. nuclear weapons complex for tritium production is relatively fragile, with several milestone dates within the next decade that must be met in order to reach and sustain the desired tritium production capacity. There is little redundancy within this part of the nuclear weapons complex. Hence, tritium production is potentially vulnerable to the loss of a single key facility.
This complex story is organized in this post as follows.
Two key materials – Tritium and Lithium
Cold War tritium production
Hanford Project P-10 (later renamed P-10-X) for tritium production (1949 to 1954)
Hanford N-Reactor Coproduct Program for tritium production (1963 to 1967)
Savannah River Plant tritium production (1954 to 1988)
Synopsis of U.S. Cold War tritium production
The Interregnum of U.S Tritium Production (1988 to 2003)
New Production Reactor (NPR) Program
Accelerator Tritium Production (ATP)
Tritium recycling
The U.S. commercial light water reactor (CLWR) tritium production program (2003 to present)
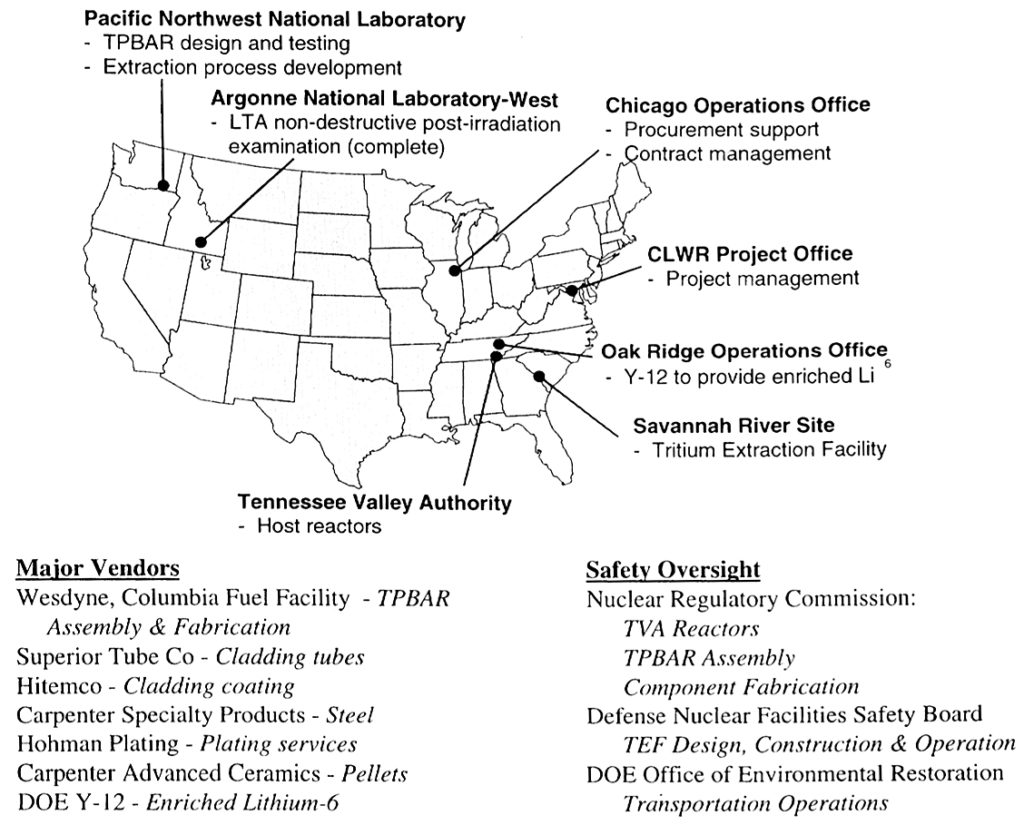
Structure of the CLWR program
What is a TPBAR?
Operational use of TPBARs in TVA reactors
Where will the uranium fuel for the TVA reactors come from?
Tritium, or hydrogen-3, is naturally occurring in extremely small quantities (10-18 percent of naturally occurring hydrogen) or it can be artificially produced at great cost. The current tritium price is reported to be about $30,000 per gram, making it the most expensive substance by weight in the world today.
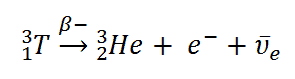
Tritium is a radioactive isotope of hydrogen with a half-life of 12.32 years. Tritium decays into helium-3 by means of negative beta decay, which also produces an electron (e–) and an electron antineutrino, as shown below.
Source: nuclear-power.net
Tritium is an important component of thermonuclear weapons. The tritium is stored in a small, sealed reservoir in each warhead.
With its relatively short half-life, the tritium content of the reservoir is depleted at a rate of 5.5% per year and must be replenished periodically. In 1999, DOE reported in DOE/EIS-0271 that none of the weapons in the U.S. nuclear arsenal would be capable of functioning as designed without tritium.
During the Cold War-era, the Atomic Energy Commission (AEC, and its successor in 1977, the Department of Energy, DOE) produced tritium for nuclear weapons in water-cooled, graphite-moderated production reactors in Hanford, Washington and in heavy water cooled and moderated production reactors at the Savannah River Plant (SRP, now Savannah River Site, SRS) in South Carolina. These reactors also produced plutonium, polonium and other nuclear materials. All of these production reactors were dedicated defense reactors except the dual-use Hanford-N reactor, which also could produce electricity for sale to the commercial power grid.
Tritium is produced by neutron absorption in a lithium-6 atom, which splits to form an atom of tritium (T) and an atom of helium-4. This process is shown below.
Natural lithium is composed of two stable isotopes; about 7.5% lithium-6 and 92.5% lithium-7. To improve tritium production, lithium-6 and lithium-7 are separated and the enriched lithium-6 is used to make “targets” that will be irradiated in nuclear reactors to produce tritium. The separated, enriched lithium-7 is a valuable material for other nuclear applications because of its very low neutron cross-section. Oak Ridge Materials Chemistry Division initiated work in 1949 to find a method to separate the lithium isotopes, with the primary goal of producing high purity lithium-7 for use in Aircraft Nuclear Propulsion (ANP) reactors.
Lithium-6 enrichment process development with a focus on tritium production began in 1950 at the Y-12 Plant in Oak Ridge, Tennessee. Three different enrichment processes would be developed with the goal of producing highly-enriched (30 to 95%) lithium-6: electric exchange (ELEX), organic exchange (OREX) and column exchange (COLEX). Pilot process lines (pilot plants) for all three processes were built and operated between 1951 and 1955.
Production-scale lithium-6 enrichment using the ELEX process was conducted at Y-12 from 1953 to 1956. The more efficient COLEX process operated at Y-12 from 1955 to 1963. By that time, a stockpile of enriched lithium-6 had been established at Oak Ridge, along with a stockpile of unprocessed natural lithium feed material.
The enriched lithium-6 material produced at Y-12 was shipped to manufacturing facilities at Hanford and Savannah River and incorporated into control rods and target elements that were inserted into a production reactor core and irradiated for a period of time.
After irradiation, these control rods and target elements were removed from the reactor and processed to recover the tritium that was produced. The recovered tritium was purified and then mixed with a specified amount of deuterium (hydrogen-2, 2H or D) before being loaded and sealed in reservoirs for nuclear weapons.
Tritium production at Hanford ended in 1967 and at Savannah River in 1988. The U.S. had no source of new tritium production for its nuclear weapons program between 1988 and 2003. During that period, tritium recycling from retired weapons was the primary source of tritium for the weapons remaining in the active stockpile. Finally, in 2003, the nation’s new replacement source of tritium for nuclear weapons started coming on line.
3. Cold War Tritium Production
3.1 Hanford Project P-10 (later renamed P-10-X) for tritium production (1949 to 1954)
The industrial process for producing plutonium for WW II nuclear weapons was conceived and built as part of the Manhattan Project. On 21 December 1942, the U.S. Army issued a contract to E. I. Du Pont de Nemours and Company (DuPont), stipulating that DuPont was in charge of designing, building and operating the future plutonium plant at a site still to be selected. The Hanford, Washington, site was selected in mid-January 1943.
Starting in 1949, the earliest work involving tritium production by irradiation of lithium targets in nuclear reactors was performed at Hanford under Project P-10 (later renamed P-10-X). By this time, DuPont had built and was operating four water-cooled, graphite-moderated production reactors at Hanford: B and D Reactors (1944), F Reactor (1945) and H Reactor (1949). Project P-10-X involved only the B and H Reactors, which were modified for tritium production.
Tritium was recovered from the targets in Building 108-B, which housed the first operational tritium extraction process line in the AEC’s nuclear weapons complex. The thermal extraction process employed started with melting the target material in a vacuum furnace and then collecting and purifying the tritium drawn off in the vacuum line. This tritium product was sent to Los Alamos for further processing and use.
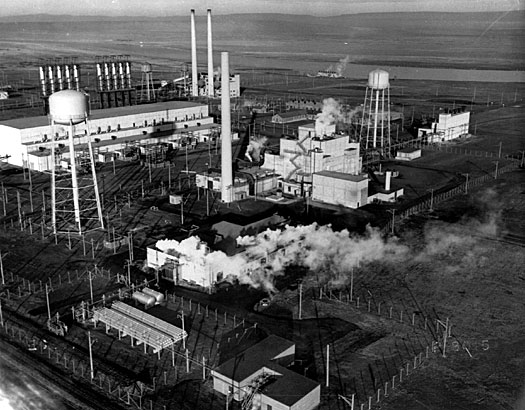
Hanford site 100-B area. B Reactor is the tiered building near the center of the photo. The much smaller 108-B tritium extraction process line building is sitting alone on the right. Source: atomicarchive.com
Project P-10-X provided the initial U.S. tritium production capability from 1949 to 1954 and supplied the tritium for the first U.S. test of a thermonuclear device, Ivy Mike, in November 1952. Thereafter, most tritium production and all tritium extractions were accomplished at the Savannah River Plant.
DOE reported: “During its five years of operation, Project P-10-X extracted more than 11 million Curies (Ci) of tritium representing a delivered amount of product of about 1.2 kg.” For more details, see the report PNNL-15829, Appendix D: “Tritium Inventories Associated with Tritium Production,” which is available here:
3.2. Hanford N-Reactor Coproduct Program for tritium production (1963 to 1967)
This was a tritium production technology development program conducted in the mid-1960s. Its primary aim was not to produce tritium for the U.S. nuclear weapons program, but rather to develop technologies and materials that could be applied in tritium breeding blankets in fusion reactors. After an extensive review of candidate lithium-bearing target materials, the high melting point ceramic lithium aluminate (LiAlO2) was chosen.
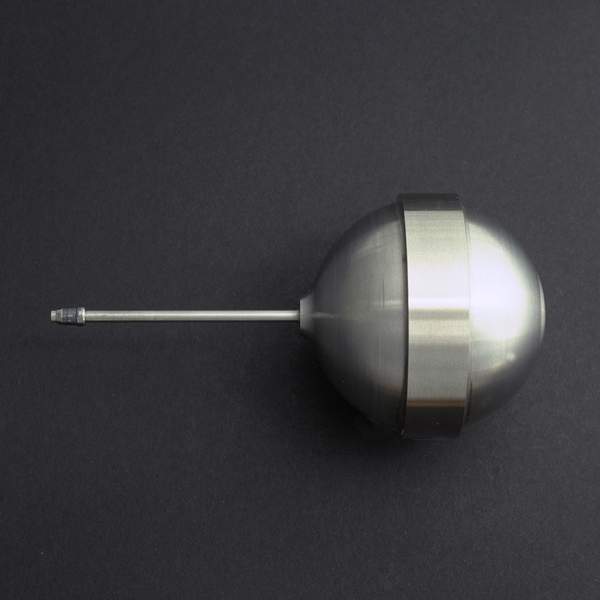
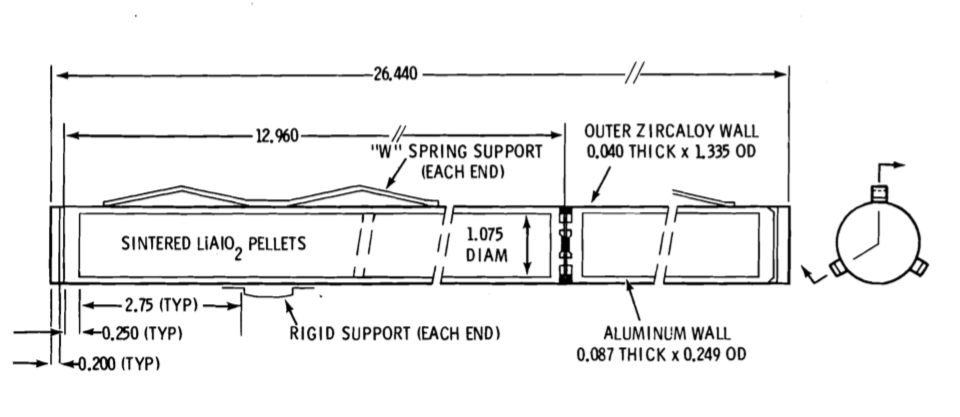
Several fuel-target element designs were tested in-reactor, culminating in October 1965 with the selection of the “Mark II” design for use in the full-reactor demonstration. Targets were double-clad cylindrical elements with a lithium aluminate core. The first cladding layer was 8001 aluminum; the second (outer) cladding layer was Zircaloy-2.
Hanford N Coproduct Target Element. Source: BNWL-2097
During the N Reactor coproduct demonstration, four distinct production tests were run, the first two with small numbers of fuel and target columns being irradiated, and the last two runs with over 1,500 fuel and target columns containing about 17 tons LiAlO2. The last production test, PT-NR-87, recorded the highest N Reactor power level by operating at 4,800 MWt for 31 hours.
The irradiated target elements were shipped to SRP for tritium extraction using a thermal extraction process defined jointly by Pacific Northwest Laboratory (PNL, now Pacific Northwest National Laboratory, PNNL) and Savannah River Laboratories (SRL). The existing tritium extraction vacuum furnaces at SRP were used.
This completed the Hanford N Reactor Coproduct Program.
More details are available in PNNL report BNWL-2097, “Tritium Production from Ceramic Targets: A Summary of the Hanford Coproduct Program,” which is available at the following link:
This program provided important experience related to lithium aluminate ceramic targets for tritium production.
3.3. Savannah River Plant tritium production (1954 to 1988)
The Savannah River Plant (SRP) was designed in 1950 primarily for a military mission to produce tritium, and secondarily to produce plutonium and other special nuclear materials, including Pu-238. DuPont built five dedicated production reactors at the SRP and became operational between 1953 and 1955: the R reactor (prototype) and the later P, L, K and C reactors.
In 1955, the original maximum power of C Reactor was 378 MWt. With ongoing reactor and system improvements, C Reactor was operating at 2,575 MWt in 1960, and eventually was rated for a peak power of 2,915 MWt in 1967. The other SRP production reactors received similar reactor and system improvements. The increased reactor power levels greatly increased the tritium production capacity at SRP. You’ll find SRP reactor operating power history charts in Chapter 2 of “The Savannah River Site Dose Reconstruction Project -Phase II,” report at the following link:
Enriched lithium-6 product was sent from the Oak Ridge Y-12 Plant to SRP Building 320-M, where it was alloyed with aluminum, cast into billets, extruded to the proper diameter, cut to the required length, canned in aluminum and assembled into control rods or “driver” fuel elements.From 1953 to 1955, tritium was produced only in control rods. Lithium-aluminum alloy target rods (“producer rods”) were installed in the septifoil (7-chambered) aluminum control rods in combination with cadmium neutron poison rods to get the desired reactivity control characteristics.
Cross-section of a septifoil control rod. Source: The Savannah River Site at Fifty (1950 – 2000), Chapter 13
Starting in 1955, enriched uranium “driver” fuel cylinders and lithium target “slugs” were assembled in a quatrefoil (4-chambered) configuration, which provided much more target mass in the core for tritium production.
Cross-section of a quatrefoil driver fuel / target element. Source: The Savannah River Site at Fifty (1950 – 2000), Chapter 13
Enriched uranium drivers were extruded in Building 320-M until 1957, after which they were produced in the newly constructed Building 321-M. Production rate varied with the needs of the reactors, peaking in 1983, when the operations in Building 321-M went to 24 hours a day. Manufacturing ceased in 1989 after the last production reactors, K, L and P, were shut down.
K Reactor was operated briefly, and for the last time, in 1992 when it was connected to a new cooling tower that was built in anticipation of continued reactor operation. K Reactor was placed in cold-standby in 1993, but with no planned provision for restart as the nation’s last remaining source of new tritium production. In 1996, K Reactor was permanently shut down.
3.4. Synopsis of U.S. Cold War tritium production
The Federation of American Scientists (FAS) estimated that the total U.S. tritium production (uncorrected for radioactive decay) through 1984 was about 179 kg (about 396 pounds).
DOE reported a total of 10.6 kg (23.4 pounds) of tritium was produced at Hanford:
About 1.2 kg (2.7 pounds) was produced at the B and H Reactors during Project P-10-X.
The balance of Hanford production (9.4 kg, 20.7 pounds) is attributed to N Reactor operation during the Coproduct Program.
The majority of U.S. tritium production through 1984 occurred at the Savannah River Plant: about 168.4 kg (371.3 pounds).
4. The Interregnum of U.S Tritium Production (1988 – 2003)
DOE had shut down all of its Cold War-era production reactors. Tritium production at Hanford ended in 1967 and at Savannah River in 1988, leaving the U.S. temporarily with no source of new tritium for its nuclear weapons program. At the time, nobody thought that “temporary” meant 15 years (a period I call the “Interregnum”).
DOE’s search for new production capacity focused on four different reactor technologies and one particle accelerator technology. During the Interregnum, the primary source of tritium was from recycling tritium reservoirs from nuclear weapons that had been retired from the stockpile. This worked well at first, but tritium decays.
4.1 New Production Reactor (NPR) Program
From 1988 to 1992, DOE conducted the New Production Reactor (NPR) Program to evaluate four candidate technologies for a new generation of production reactors that were optimized for tritium production, but with the option to produce plutonium:
Heavy water cooled and moderated reactor (HWR)
High-temperature gas-cooled reactor (HTGR)
Light water cooled and moderated reactor (LWR)
Liquid metal reactor (LMR)
Three candidate NPR sites were considered:
Savannah River Site
Idaho National Engineering Laboratory (INEL, now INL)
Hanford Site
The NPR schedule goal was to have the new reactors start tritium production within 10 years after the start of conceptual design. Details on this program are available in DOE/NP-0007P, “New Production Reactors – Program Plan,” dated December 1990, which is available here: https://www.osti.gov/servlets/purl/6320732
The NPR program was cancelled in September 1992 (some say “deferred”) after DOE failed to select a preferred technology and failed to gain Congressional budgetary support for the program, at least in part due to the end of the Cold War.
DOE continued evaluating other options for tritium production, including commercial light water reactors (CLWRs) and accelerator tritium production (ATP).
4.2 Accelerator Tritium Production (ATP)
A candidate ATP design developed by Los Alamos National Laboratory (LANL) was based on a 1,700 MeV (million electron volt) linear accelerator that produced a 170 MW / 100 mA continuous proton beam. The ATP total electric power requirement was 486 MWe. The general arrangement of the ATP is shown in the following diagrams.
General arrangement of the ATP. Source: LANL
In this diagram, beam energy is indicated along the linear accelerator, increasing to the right and reaching a maximum of 1,700 MeV just before entering a magnetic switch that diverts the beam to the target/blanket or allows to beam to continue straight ahead to a tuning backstop.
Details of the Target / Blanket System. Source: LANL
The Target / Blanket System operates as follows:
The continuous proton beam is directed onto a tungsten target surrounded by a lead blanket, generating a huge flux of spallation neutrons.
Tubes filled with Helium-3 gas are located adjacent to the tungsten and within the lead blanket.
The spallation neutrons created by the energetic protons are moderated by the lead and cooling water and are absorbed by Helium-3 to create about 40 tritium atoms per incident proton.
The tritium is continuously removed from the Helium-3 gas in a nearby Tritium Separation Facility.
The unique feature of on-line, continuous tritium collection eliminates the time and processing required to extract tritium from the target elements used in production reactors.
ATP ultimately was rejected by DOE in December 1998 in favor of producing tritium in a commercial light water reactor (CLWR).
After the end of the Cold War, both the U.S. and Russia greatly reduced their respective stockpiles of nuclear weapons, as shown in the following chart.
Source: Wikipedia
The decommissioning of many nuclear weapons created an opportunity for the U.S. to temporarily maintain an adequate supply of tritium by recycling the tritium from the reservoirs no longer needed in warheads being retired from service. However, by 2020, after 32 years of exponential decay at a rate of 5.5% per year, the 1988 U.S. tritium inventory had decayed to only about 17% of the inventory in 1988, when the DOE stopped producing tritium. You can check my math using the following exponential decay formula:
y = a (1-b)x
where:
y = the fractional amount remaining after x periods
a = initial amount = 1
b = the decay rate per period (per year) = 0.055
x = number of periods (years) = 32
Recycling tritium from retired and aged reservoirs and precisely reloading reservoirs for installation in existing nuclear weapons are among the important functions performed today at DOE’s Savannah River Site (SRS). But, clearly, there is a point in time where simply recycling tritium reservoirs is no longer an adequate strategy for maintaining the current U.S. stockpile of nuclear weapons. A source of new tritium for military use was required.
5. The U.S. commercial light water reactor (CLWR) tritium production program (2003 to present)
In December 1998, Secretary of Energy Bill Richardson announced the decision to select commercial light water reactors (CLWRs) as the primary tritium supply technology, using government-owned Tennessee Valley Authority (TVA) reactors for irradiation services. A key commitment made by DOE was that the reactors would be required to use U.S.-origin low-enriched uranium (LEU) fuel. In their September 2018 report R45406, the Congressional Research Service noted: “Long-standing U.S. policy has sought to separate domestic nuclear power plants from the U.S. nuclear weapons program – this is not only an element of U.S. nuclear nonproliferation policy but also a result of foreign ‘peaceful-use obligations’ that constrain the use of foreign-origin nuclear materials.”
5.1 Structure of the CLWR program
The current U.S. CLWR tritium production capability was deployed in about 12 years, between 1995 and 2007, as shown in the following high-level program plan.
CLWR tritium production program plan. Source: adapted from NNSA 2001
Since early 2007, NNSA has been getting its new tritium supply for nuclear stockpile maintenance from tritium-producing burnable absorber rods (TPBARs) that have been irradiated in the slightly-modified core of TVA’s Watts Bar Unit 1 (WBN 1) nuclear power plant, which is a Westinghouse commercial pressurized water reactor (PWR) licensed by the U.S. Nuclear Regulatory Commission (NRC).
TVA’s Watts Bar nuclear power plant. Source: Oak Ridge Today, 13 Feb 2019
The NRC’s June 2005 “Backgrounder” entitled, “Tritium Production,” provides a good synopsis of the development and nuclear licensing work that led to the approval of TVA nuclear power plants Watts Bar Unit 1 and Sequoyah Units 1 and 2 for use as irradiation sources for tritium production for NNSA. You find the NRC Backgrounder here:
The CLWR tritium production cycle is shown in the following NNSA diagram. Not included in this diagram are the following:
Supply of U.S.-origin LEU for the fuel elements.
Production of fuel elements using this LEU
Management of irradiated fuel elements at the TVA reactor sites
The current U.S. tritium production cycle. Source: NNSA and Art Explosion via GAO-11-100
PNNL is the TPBAR design authority (agent) and is responsible for coordinating irradiation testing of TPBAR components in the Advanced Test Reactor (ATR) at the Idaho National Laboratory (INL). Production TPBAR components are manufactured by several contractors in accordance with specifications from PNNL, with WesDyne International responsible for assembling the complete TPBARs in Columbia, South Carolina. When needed, new TPBARs are shipped to TVA for installation in a designated reactor during a scheduled refueling outage and then irradiated for 18 months, until the next refueling outage. After being removed from the reactor, the irradiated TPBARs are allowed to cool at the TVA nuclear power plant for a period of time and then are shipped to the Savannah River Site.
SRS is the only facility in the nuclear security complex that has the capability to extract, recycle, purify, and reload tritium. Today, the Savannah River Tritium Enterprise (SRTE) is the collective term for the facilities, people, expertise, and activities at the SRS related to tritium production. SRTE is responsible for extracting new tritium from irradiated TPBARs at the Tritium Extraction Facility (TEF) that became operational in January 2007. They also are responsible for recycling tritium from reservoirs of existing warheads. The existing Tritium Loading Facility at SRS packages the tritium in sealed reservoirs for delivery to DoD. You’ll find the SRTE fact sheet at the following link:
Program participants and their respective roles are identified in the following diagram.
The current U.S. tritium production program participants. Source: NNSA 2001
5.2 What is a TPBAR?
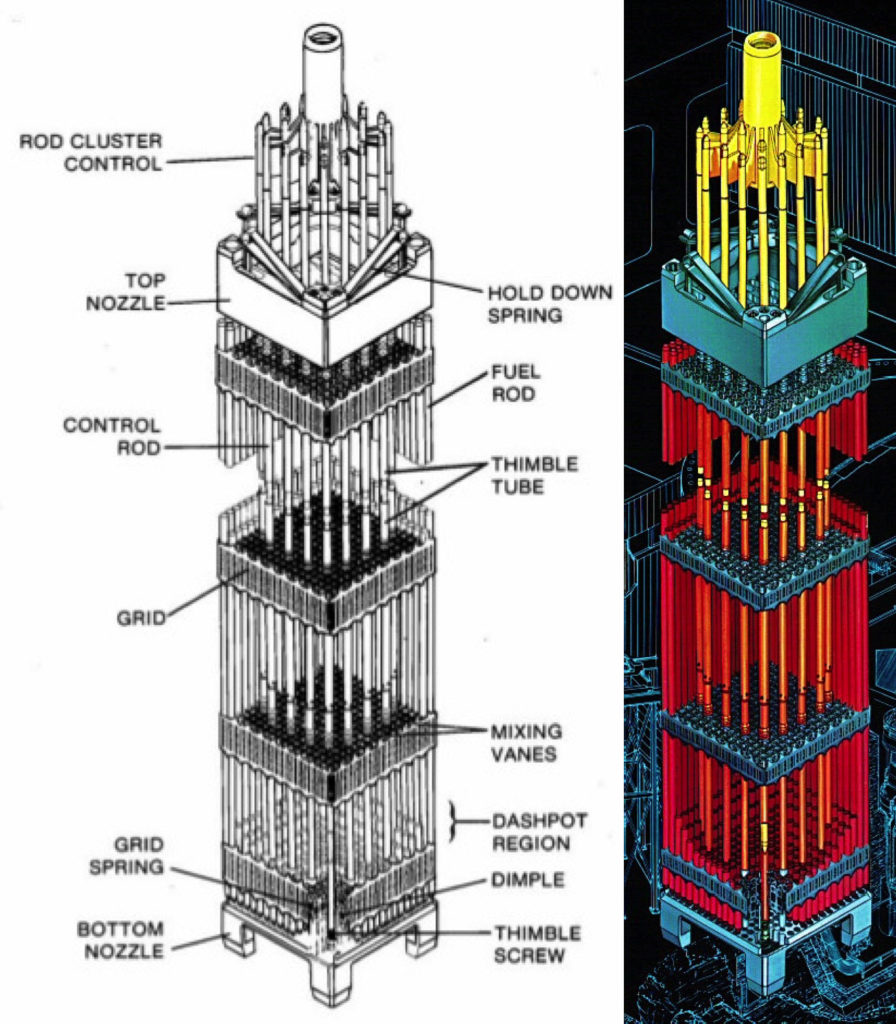
The reactor core in a Westinghouse commercial four-loop PWR like Watts Bar Unit 1 approximates a right circular cylinder with an active core measuring about 14 feet (4.3 meters) tall and 11.1 feet (3.4 meters) in diameter. The reactor core has 193 fuel elements, each of which is comprised of a 17 x 17 square array of 264 small-diameter, fixed fuel rods and 25 small-diameter empty thimbles, 24 of which serve as guide thimbles for control rods and one is an instrumentation thimble.
Rod cluster control assemblies (RCCAs) are used to control the reactor by moving arrays of small-diameter neutron-absorbing control rods into or out of selected fuel elements in the reactor core. Watts Bar has 57 RCCAs, each comprised of 24 Ag-In-Cd (silver-indium-cadmium) neutron-absorbing rods that fit into the control rod guide thimbles in selected fuel elements. Each RCCA is controlled by a separate control rod drive mechanism. The geometries of a Westinghouse 17 x 17 fuel element and the RCCA are shown in the following diagrams.
Cross-sectional view of a single Westinghouse 17 x 17 fuel element showing the lattice positions assigned to fuel rods (red) andthe thimbles available for instrumentation and control rods (blue).Source: Syeilendra Pramuditya Isometric view of a Westinghouse 17 x 17 fuel element showing the fixed fuel rods (red) and a rod cluster control assembly (yellow) that can be inserted or withdrawn for reactivity control. Sources: (L) Framatom ANP report BAW-10237, May 2001; (R) Westinghouse via NuclearTourist
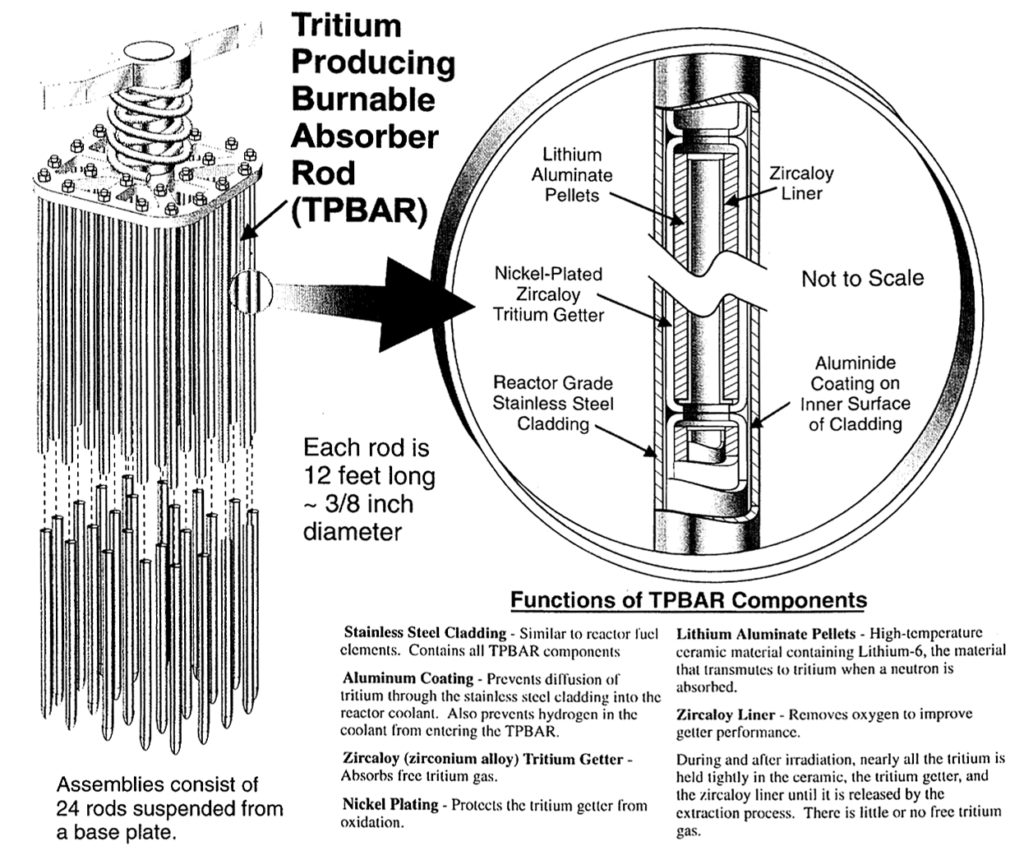
To produce tritium in a Westinghouse PWR core, lithium-6 targets, in the form of lithium aluminate (LiAlO2) ceramic pellets, are inserted into the core and irradiated. This is accomplished with the tritium-producing burnable absorber rods (TPBARs), each of which is a small-diameter rod (a “rodlet”) that externally looks quite similar to a single control rod in an RCCA. During one typical 18-month refueling cycle (actually, up to 550 equivalent full power days), the tritium production per rod is expected to be in a range from 0.15 to 1.2 grams. The ceramic lithium aluminate target is similar to the targets developed in the mid-1960s and used during the Hanford N-Reactor Coproduct Program for tritium production.
A TPBAR “feed batch” assembly generally resembles the shape of an RCCA, but with 12 or 24 TPBAR rodlets in place of the control rods. The feed batch assembly is a hanging structure supported by the top nozzle adapter plate of the fuel assembly and the TPBAR rodlets are hanging in the guide thimble tubes of the fuel assembly. The feed batch assembly does not move after it has been installed in the reactor core.
Since lithium-6 is a strong neutron absorber, the TPBAR functions in the reactor core in a manner similar to fixed burnable absorber rods, which use boron-10 as their neutron absorber. The reactivity worth of the TPBARs is slightly greater than the burnable absorber rods.
In 2001, Framatome ANP issued Report BAW-10237, “Implementation and Utilization of Tritium Producing Burnable Absorber Rods (TPBARS) in Sequoyah Units 1 and 2.” This report provides a good description of the modified core and TPBARs as they would be applied for tritium production at the Sequoyah nuclear plant. Watts Bar should be similar. The report is here:
The feed batch assembly and TPBAR rodlet configurations are shown in the following diagram.
TPBAR feed batch assembly (left); details of an individual TPBAR and target pellet (right). Source: NNSA 2001
TPBARs were designed for a low rate of tritium permeation from the target pellets, through the cladding and into the primary coolant water. Tritium permeation performance was expected to be less than 1.0 Curie/one TPBAR rod/year. With an assumed maximum of 2,304 TPBARs in the reactor core, the NRC initially licensed Watts Bar Unit 1 for a maximum annual tritium permeation of 2,304 Curies / year.
5.3. Operational use of TPBARs in TVA reactors
NRC issued WBN 1 License Amendment 40 in September 2002, approving the irradiation of up to 2,304 TPBARs per operating cycle.
For the first irradiation cycle (Cycle 6) starting in the autumn of 2003, TVA received NRC approval to operate with only 240 TPBARs because of issues related to Reactor Coolant System (RCS) boron concentration. Actual TPBAR performance during Cycle 6 demonstrated a significantly higher rate of tritium permeation than expected; reported to be about 4.0 Curies/one TPBAR/cycle.
TVA’s short-term response was to limit the number of TPBARs per core load to 240 in Cycles 7 and 8 to ensure compliance with its NRC license limits on tritium release. In their 30 January 2015 letter to TVA, NRC stated, “….the primary constraint on the number of TPBARs in the core is the TPBAR tritium release per year of 2,304 Curies per year.” This guidance gave TVA some flexibility on the actual number of TPBARs that could be irradiated per cycle. This NRC letter is available here: https://www.nrc.gov/docs/ML1503/ML15030A508.pdf
PNNL’s examinations of TPBARs revealed no design or production flaws. Nonetheless, PNNL developed design modifications intended to improve tritium permeation performance. These changes were implemented by the manufacturing contractors, resulting in the Mark 9.2 TPBAR, which was first used in 2008 in WBN 1 Cycle 9. PNNL also is conducting an ongoing irradiation testing programs in the Advanced Test Reactor (ATR) at INL, with the goal of finding a technical solution for the high permeation rate. You’ll find details on this program in a 2013 PNNL presentation at the following link: https://www.energy.gov/sites/prod/files/2015/08/f26/Senor%20-%20TMIST-3%20Irradiation%20Experiment.pdf
In October 2010, the General Accounting Office (GAO) reported: “no discernable improvement in TPBAR performance was made and tritium is still permeating from the TPBARs at higher-than-expected rates.” This GAO report is available here: https://www.gao.gov/products/GAO-11-100
In response to the high tritium permeation rate, the irradiation management strategy was revised based on an assumed permeation rate of 5.0 Curies per TPBAR per year (five times the original expected rate). Even at this higher permeation rate, WBN 1 can meet the NRC requirements in 10 CFR Part 20 and 10 CFR Part 50 Appendix I related to controlling radioactive materials in gaseous and liquid effluents produced during normal conditions, including expected occurrences.
The many NRC license amendments associated with WBN 1 tritium production are summarized below:
In License Amendment 40 (Sep 2002), the NRC originally approved WBN 1 to operate with up to 2,304 TPBARs.
Cycle 6: TVA limited the maximum number of TPBARs to be irradiated to 240 based on issues related to Reactor Coolant System (RCS) boron concentration. Approved by NRC in WBN 1 License Amendment 48 (Oct 2003).
Cycles 7 & 8: WBN 1 continued operating with 240 TPBARs.
Cycle 9: First use of TPBARs Mark 9.2 supported TVAs request to increase the maximum number of TPBARs to 400. Approved by NRC in WBN 1 License Amendment 67 (Jan 2008)
Cycle 10: TVA reduced the number of TPBARs irradiated to 240 after discovering that the Mark 9.2 TPBAR design changes deployed in Cycle 9 did not significantly reduce tritium permeation.
Cycles 11 to 14: NRC License Amendment 77 9May 2009) allowed a maximum of 704 TPBARs at WBN 1. TVA chose to irradiate only 544 TPBARs in Cycles 11 and 12, increasing to 704 TPBARs for Cycles 13 & 14.
Cycles 15 & beyond: NRC License Amendment 107 (Aug 2016) allows a maximum of 1,792 TPBARs at WBN 1.
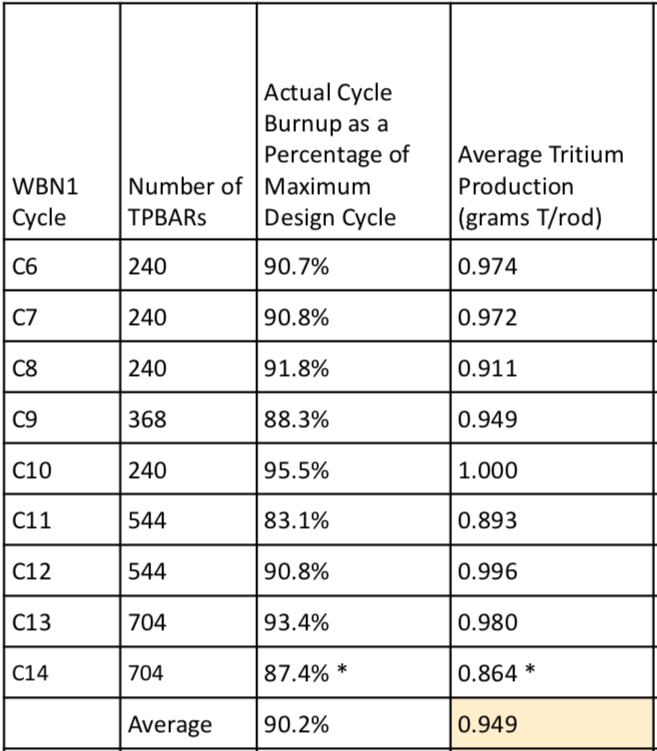
The actual number of TPBARs and the average tritium production per TPBAR during WBN 1 Cycles 6 to 14 are summarized in the 2017 PNNL presentation, “Tritium Production Assurance,” and are reproduced in the following table.
Tritium production, WBN 1 Cycles 6 to 14 (Cycle 14, completed in 2011, is an estimate). Source: PNNL, Tritium Production Assurance, 11 May 2017
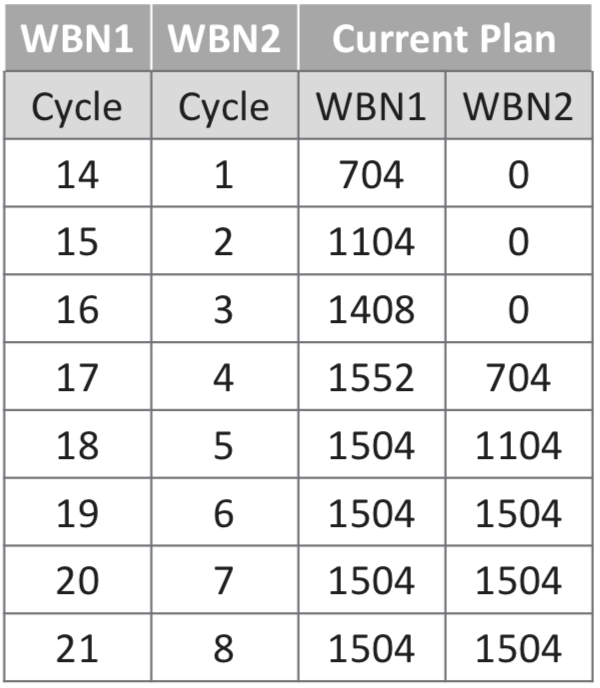
The current tritium production plan continues irradiation in WBN 1 and starts irradiation in Watts Bar Unit 2 (WBN 2) in Cycle 4, which will start after the spring 2022 refueling. Tritium is assumed to be delivered six months after the end of each cycle.
WBN 1 and WBN 2 TPBAR loading plans. Source: “Tritium Production Assurance”, report of the PNNL Tritium Focus Group, Richland, WA, May 11, 2017
As of early 2020, TVA and DOE are not delivering the quantity of tritium expected by NNSA. In July 2019, DOE and NNSA delivered their “Fiscal Year 2020 – Stockpile Stewardship and Management Plan” to Congress. In this plan, the top-level goal was to “recapitalize existing infrastructure to implement a plan to produce no less than 80 ppy (plutonium pits per year) by 2030.” To meet this goal, NNSA set a target for increasing tritium production to 2,800 grams per two 18-month reactor cycles of production at TVA by 2027. This means two TVA reactors will be producing tritium, and each will have a target of about 1,400 grams per cycle. This will be quite a challenge for TVA and DOE.
5.4 Where will the uranium fuel for the TVA reactors come from?
The tritium-producing TVA reactors are committed to using unobligated LEU fuel. That means that the uranium is not encumbered by international obligations that restrict its use for peaceful purposes only. Unobligated uranium has a very special pedigree. The uranium originated from U.S. mines, was processed in U.S. facilities, and was enriched in an unobligated U.S. enrichment facility.
Today, that front-end of the U.S. nuclear fuel cycle has withered against international competition, as shown in the following chart from the Energy Information Administration (EIA).
Since the U.S. has not had an unobligated uranium enrichment facility since 2013, when the Paducah enrichment plant was closed by the Obama administration, there currently is no source of new unobligated LEU for the tritium-producing TVA reactors.
The impending shortage of unobligated enriched uranium eventually could affect tritium production, Navy nuclear reactor operation and other users. This matter has been addressed by the GAO in their 2018 report GAO-18-126, “NNSA Should Clarify Long-Term Uranium Enrichment Mission Needs and Improve Technology Cost Estimates,” which is available here:
The solution could be a mixture of measures, some of which are discussed briefly below.
Downblend unobligated HEU to buy time
Currently, the LEU for the TVA reactors is supplied from the U.S. inventory of unobligated LEU, which is supplemented by downblending unobligated HEU. In September 2018, NNSA awarded Nuclear Fuel Services (NFS) a $505 million contract to downblend 20.2 metric tons of HEU to produce LEU, which can serve as a short-term source of fuel for the tritium-producing TVA reactors. This contract runs from 2019 to 2025. Beyond 2025, additional HEU downblending may be needed to sustain tritium production until a longer-term solution is in place.
Build a new unobligated uranium enrichment facility and re-build the associated domestic uranium mining, milling and conversion infrastructure
NNSA is in the process of selecting the preferred technology for a new unobligated enrichment plant. There are two competing enrichment technologies: the Centrus AC-100 large advanced gas centrifuge and the Oak Ridge National Laboratory small advanced gas centrifuge, both of which are designed to enrich gaseous uranium hexafluoride (UF6).
NNSA failed to meet its goal of making the selection by the end of 2019. Regardless of the choice, it will take more than a decade to deploy such a facility. Perhaps a mid-2030’s date would be a possible target for initial operation of a new DOE uranium enrichment facility.
In the meantime, the atrophied / shutdown US uranium mining, milling and conversion industries need to be rebuilt to once again establish a reliable, domestic source of feed material for DOE’s uranium enrichment operations. This will be a daunting task given the current sad state of the US uranium production industry.
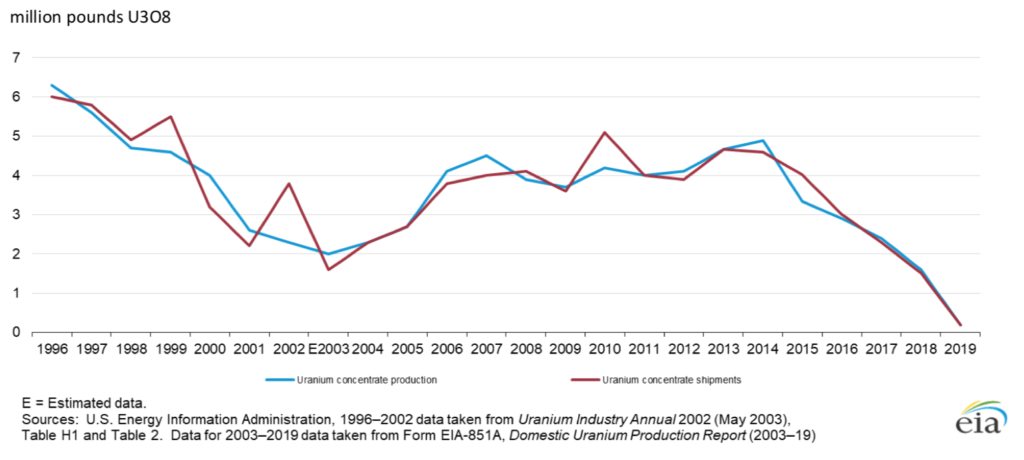
In May 2020, the US Energy Information Administration (EIA) released its 2019 Domestic Uranium Production Report. Mining uranium ore or in-situ leaching from underground uranium ore bodies, followed by the production of uranium (U3O8) concentrate (”yellowcake”), are the first steps at the front-end of the nuclear fuel cycle. The following EIA summary graphic shows the decline of US uranium production, which has been especially dramatic since 2013.
US uranium (U3O8) concentrate production and shipments, 1996–2019. Source: EIA
A key point reported by the EIA was that total US production of uranium concentrate from all domestic sources in 2019 was only 170,000 pounds (77,111 kg) of U3O8, 89% less than in 2018, from six facilities. In the graphic, you can see that US annual production in 1996 was about 35 times greater, approximately 6,000,000 pounds (2,721,554 kg). This EIA report is available at the following link: https://www.eia.gov/uranium/production/annual/
Conversion of U3O8 to UF6 is the next step in the front-end of the nuclear fuel cycle. Honeywell’s Metropolis Works was built in 1958 to produce UF6 for US government programs, including the nuclear weapons complex. Therefore, the Metropolis Works should be an unobligated conversion plant and, as such, is an important facility in the nuclear fuel cycle for the US tritium production reactors operated by TVA. In 2020, the Metropolis Works is the only US facility that can receives uranium ore concentrate and convert it to UF6.
In 1968, Metropolis Works began selling UF6 on the commercial nuclear market. However, since 2017, operations at the Metropolis Works have been curtailed due to weak market conditions for its conversion services and Honeywell has maintained the facility in a “ready-idle” status. In March 2020, the NRC granted the Metropolis Works a 40-year license renewal, permitting operations until March 24, 2060. When demand resumes, the Metropolis Works should be ready to resume operation.
Recognizing the US national interest in having a viable industrial base for the front-end of the nuclear fuel cycle, President Trump established a Nuclear Fuel Working Group in July 2019. On 13 April, 2020, the DOE released the “Strategy to Restore American Nuclear Energy Leadership,” which, among other things, includes recommendations to strengthen the US uranium mining and conversion industries and restore the viability of the entire front-end of the nuclear fuel cycle. You’ll find this DOE announcement and a link to the full report to the President here: https://www.energy.gov/articles/secretary-brouillette-announces-nuclear-fuel-working-groups-strategy-restore-american
Reprocess enriched DOE and naval fuel spent fuel
A large inventory of aluminum clad irradiated fuel exists at SRS, with a smaller quantity at INL. The only operating chemical separations (reprocessing) facility in the U.S. is the H-Canyon facility at SRS, which can only process aluminum clad fuel. However, the cost to operate H-Canyon to process the aluminum-clad fuel would be high.
There is a large inventory of irradiated, zirconium-clad naval fuel at INL. This fuel started life with a uranium enrichment level of 93% or higher. In 2017, INL completed a study examining the feasibility of processing zirconium-clad spent fuel through a new process called ZIRCEX. This process could enable reprocessing the spent naval fuel stored at INL as well as other types of zirconium-clad fuel.
In 2018, the U.S. Senate approved $15 million in funding for a pilot program at the INL to “recycle” irradiated (used) naval nuclear fuel and produce high-assay, low-enriched uranium (HALEU) fuel with an enrichment between 5% to 20% for use in “advanced reactors.” It seems that a logical extension would be to also produce LEU fuel to a specification that could be used in the TVA reactors.
In 2018, Idaho Senator Mike Crapo made the following report to the Senate: “HEU repurposing, from materials like spent naval fuel, can be done using hybrid processes that use advanced dry head-end technologies followed by material recovery, which creates the fuel for our new advanced reactors. Repurposing this spent fuel has the potential of reducing waste that would otherwise be disposed of at taxpayer expense, and approximately 1 metric ton of HEU can create 4 useable tons (of HALEU) for our new reactors.”
Perhaps there is a future for closing the back-end of the naval fuel cycle and recovering some of the investment that went into producing the very highly enriched uranium used in naval reactors. Because of the high burnup in long-life naval reactors, the resulting HALEU or LEU will have different uranium isotopic proportions than LEU produced in the front-end of the fuel cycle. This may introduce issues that would have to be reviewed and approved by the NRC before such LEU fuel could be used in the TVA reactors.
Other options
More information on options for obtaining enriched uranium without acquiring a new uranium enrichment facility is provided in Appendix II of GAO-18-126.
5.5 Where will the enriched lithium-6 target material come from?
A reliable source of lithium-6 target material is needed to produce the TPBARs for TVA’s tritium-producing reactors.
The U.S. has not had an operational lithium-6 production facility since 1963 when the last COLEX (column exchange) enrichment line was shutdown. COLEX was one of three lithium enrichment technologies employed at the Y-12 Plant in Oak Ridge, TN between 1950 and 1963. The others technologies were ELEX (electrical exchange) and OREX (organic exchange). All of these processes used large quantities of mercury. At the time lithium-6 enrichment operations ceased at Y-12, a stockpile of enriched lithium-6 and lithium-7 had been established along with a stockpile of unprocessed natural lithium feed material.
There has been a continuing decline in the national inventory of enriched lithium-6. To extend the existing supply, NNSA has instituted a program to recover and recycle lithium components from nuclear weapons that are being retired from the stockpile.
In May 2017, Y-12 lithium activities were adversely affected by the poor physical condition (and partial roof collapse) of the WW II-vintage Building 9204-2 (Beta 2).
Shortly thereafter, NNSA announced the approval of plans for a new Lithium Production Facility at Y-12 to replace Building 9204-2. The NNSA’s Fiscal Year 2020 – Stockpile Stewardship and Management Plan set an operational date of 2030 for the new facility.
5.6 Where is the tritium recovered?
Tritium is extracted from the irradiated TPBARs, purified and loaded into reservoirs at the Savannah River Site (SRS). These functions are performed by “Savannah River Tritium Enterprise” (SRTE), which is the collective term for the tritium facilities, people, expertise, and activities at the SRS.
The first load of irradiated TPBARs were consolidated at Watts Bar and delivered to SRS in August 2005 for storage pending completion of the new Tritium Extraction Facility (TEF). The TEF became fully operational and started extracting tritium from TPBARs in January 2007. The tritium extracted at TEF is transferred to the H Area New Manufacturing (HANM) Facility for purification. In February 2007, the first newly-produced tritium was delivered to the SRS Tritium Loading Facility for loading into reservoirs for nuclear weapons.
From 2007 until 2017, the TEF conducted only a single extraction each year because of the limited quantities of TPBARs being irradiated in the TVA reactors. During this period, the TEF sat idle for nine months each year between extraction cycles.
In 2017, for the first time, the TEF performed three extractions in a single year using the original vacuum furnace. Each extraction typically involved 300 TPBARs.
In November 2019, SRTE’s capacity for processing TPBARs and recovering tritium was increased by the addition of a second vacuum furnace.
6. Conclusions
In their “Fiscal Year 2020 – Stockpile Stewardship and Management Plan,” the NNSA’s top-level goal is to “recapitalize existing infrastructure to implement a plan to produce no less than 80 ppy (plutonium pits per year) by 2030.” This goal will drive tritium production demand, which in turn will drive demands for unobligated LEU to fuel TVA’s tritium-producing reactors and enriched lithium-6 for TPBARs.
The U.S. nuclear fuel cycle for the production of tritium currently is incomplete. It is able to produce tritium by using temporary measures that are not sustainable:
Downblending HEU to produce LEU
Recycling tritium as the primary means for meeting current demand
Recycling lithium components
The next 15 years will be quite a challenge for the NNSA, DOE and TVA as they work to reestablish a complete, modern nuclear fuel cycle for tritium production. There are several milestones on the critical path that would adversely impact tritium production if they are not met on schedule:
Higher tritium production goals for the TVA reactors: deliver 2,800 grams of tritium per two 18-month reactor cycles of production in TVA reactors by 2027
New Lithium Facility at Y-12 operational by 2030
New uranium enrichment facility operational, perhaps by the mid-2030s
There is a general lack of redundancy in the existing and planned future nuclear fuel cycle for tritium production. This makes tritium production vulnerable to a major outage at a single non-redundant facility.
“National Nuclear Security Administration Needs to Ensure Continued Availability of Tritium for the Weapons Stockpile,” Report GAO-11-100, General Accounting Office, October 2010: https://www.gao.gov/assets/320/311092.pdf
Sean Johnson, “Making the invisible engineer visible: DuPont and the recognition of nuclear expertise,” Technology and Culture, Volume 52, Number 3, July 2011, pp. 548-573: https://muse.jhu.edu/article/447781/pdf
For more information on Cold War-era Hanford tritium production:
Johnson AB, Jr., TJ Kabele, and WE Gurwell, “Tritium Production from Ceramic Targets: A Summary of the Hanford Coproduct Program,” BNWL-2097, Pacific Northwest National Laboratory, 1976: https://www.osti.gov/servlets/purl/7125831
Johnson AB, Jr., TJ Kabele, and WE Gurwell, “Tritium Production from Ceramic Targets: A Summary of the Hanford Coproduct Program,” BNWL-2097, Pacific Northwest National Laboratory, 1976: https://www.osti.gov/servlets/purl/7125831
US coal production was strong from the 1990s until 2014, with coal production each year being near or above 1 billion short tons (a “short ton” is 2,000 pounds). The highest annual level of production was achieved in 2008: 1.17 billion short tons. Since then, the coal industry has seen a steady decline in production, and trends indicate that the decline will continue.
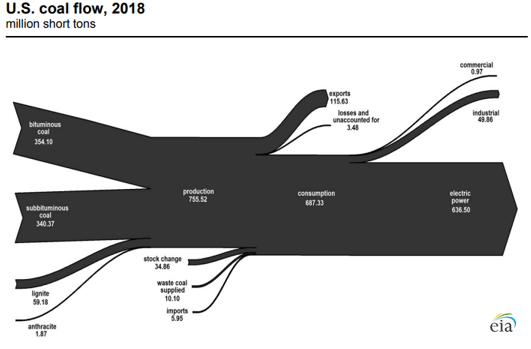
In their 10 July 2019 report, “Almost all US coal production is consumed by electric power,” the US Energy Information Administration (EIA) reported that coal is still one of the main sources of energy in the US, accounting for 16% of the nation’s primary energy production in 2018. Nearly all of the coal consumed in the US is produced domestically, and most is consumed by the electric power sector to generate electricity, while some is exported. The following EIA “coal flow” diagram shows where the coal comes from and (approximately) how it was consumed in 2018. Total production was about 755 million short tons. The electric power sector consumed about 84% of production, with only modest amounts being consumed by the industrial sector or exported.
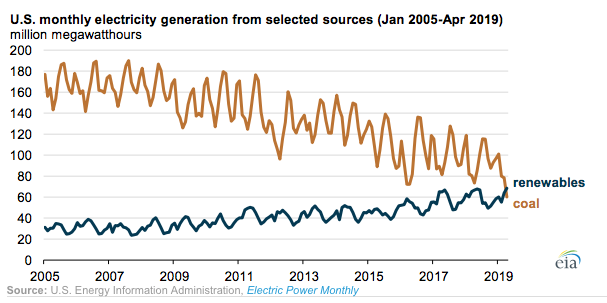
Electricity generation from coal has been on the decline in the US for almost two decades. On 26 June 2019, EIA reported that US electricity generation from renewables surpasses coal in April 2019. In the following EIA chart, you can see the long-term increase in generation from renewables, which contrasts sharply with the long-term decline of generation from coal due to the decommissioning of many coal-fired power plan and the commissioning of no plants since about 2014.
Between 2010 and the first quarter of 2019, US power companies announced the retirement of more than 546 coal-fired power units, totaling about 102 gigawatts (GW) of generating capacity. Plant owners intend to retire another 17 GW of coal-fired capacity by 2025. You’ll find the EIA’s 26 July 2019 report on decommissioning US coal-fired power plants here: https://www.eia.gov/todayinenergy/detail.php?id=40212
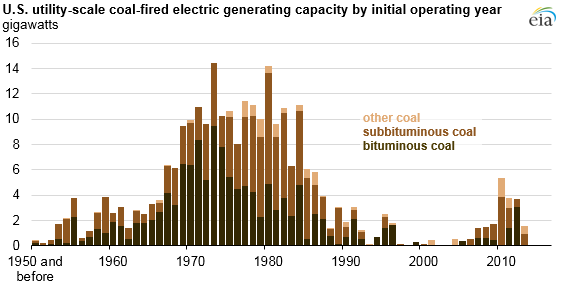
In April 2017, EIA reported that on the age of the US coal-fired generating plant fleet. The following chart shows the distribution of coal-fired plants based on their initial operating year. EIA reported a fleet average age of 39 years in 2017.
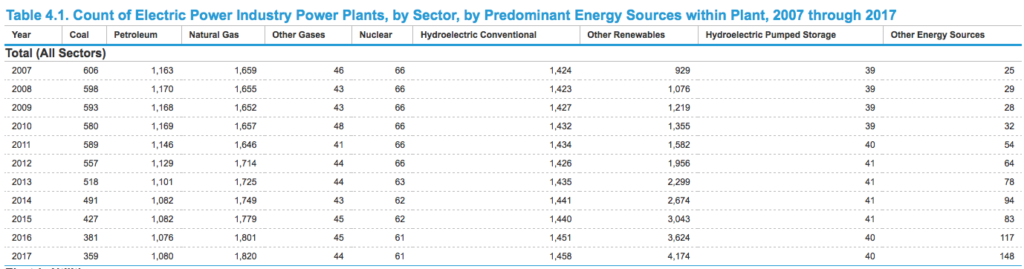
The following table lists EIA data on the numbers of different types of generating plants in the US between 2007 and 2017. In 2007, the US had 606 coal-fired generating plants. By the end of 2017, that number had dropped to 359.
In another decade, coal-fired generation will be only a small part of the US electric power generation portfolio and the average fleet age will be about 50 years old.
Each year, the EIA issues an Annual Energy Outlook that provides energy industry recent year data and projections for future years. The 2016 AEO includes actual data of 2014 and 2015, and projections to 2040. These data include:
Total energy supply and disposition demand
Energy consumption by sector and source
Energy prices by sector and source
Key indicators and consumption by sector (Residential, Commercial, Industrial, Transportation)
Electricity supply, disposition, prices and emissions
Electricity generating capacity
Electricity trade
On 17 May, EIA released a PowerPoint summary of AEO2016 along with the data tables used in this Outlook. The full version of AEO2016 is scheduled for release on 7 July 2016.
You can download EIA’s Early Release PowerPoint summary and any of the data tables at the following link:
EIA explains that this Summary features two cases: the Reference case and a case excluding implementation of the Clean Power Plan (CPP).
Reference case: A business-as-usual trend estimate, given known technology and technological and demographic trends. The Reference case assumes Clean Power Plan (CPP) compliance through mass-based standards (emissions reduction in metric tones of carbon dioxide) modeled using allowances with cooperation across states at the regional level, with all allowance revenues rebated to ratepayers.
No CPP case: A business-as-usual trend estimate, but assumes that CPP is not implemented.
You can find a good industry assessment of the AEO2016 Summary on the Global Energy World website at the following link:
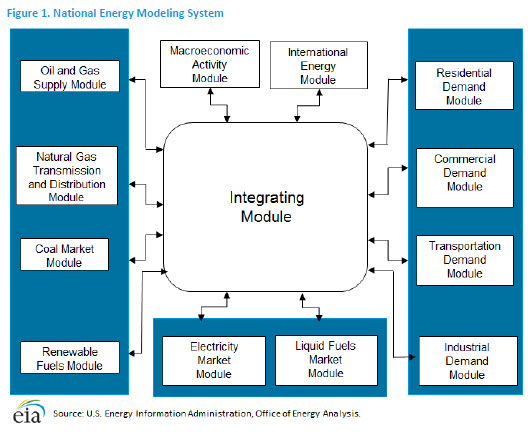
This report presents the major assumptions of the National Energy Modeling System (NEMS) used to generate the projections in AE02015. A 2016 edition of Assumptions is not yet available. The functional organization of NEMS is shown below.
The renewable fuels module in NEMS addresses solar (thermal and photovoltaic), wind (on-shore and off-shore), geothermal, biomass, landfill gas, and conventional hydroelectric.
The predominant renewable sources are solar and wind, both of which are intermittent sources of electric power generation. Except for the following statements, the EIA assumptions are silent on the matter of energy storage systems that will be needed to manage electric power quality and grid stability as the projected use of intermittent renewable generators grows.
All technologies except for storage, intermittents and distributed generation can be used to meet spinning reserves
The representative solar thermal technology assumed for cost estimation is a 100-megawatt central-receiver tower without integrated energy storage
Pumped storage hydroelectric, considered a nonrenewable storage medium for fossil and nuclear power, is not included in the supply
In my 4 March 2016 post, “Dispatchable Power from Energy Storage Systems Help Maintain Grid Stability,” I addressed the growing importance of such storage systems as intermittent power generators are added to the grid. In the context of the AEO, the EIA fails to address the need for these costly energy storage systems and they fail to allocate the cost of energy storage systems to the intermittent generators that are the source of the growing demand for the energy storage systems. As a result, the projected price of energy from intermittent renewable generators is unrealistically low in the AEO.
Oddly, NEMS does not include a “Nuclear Fuel Module.” Nuclear power is represented in the Electric Market Module, but receives no credit as a non-carbon producing source of electric power. As I reported in my posts on the Clean Power Plan, the CPP gives utilities no incentives to continue operating nuclear power plants or to build new nuclear power plants (see my 27 November 2015 post, “Is EPA Fudging the Numbers for its Carbon Regulation,” and my 2 July 2015 post, “EPA Clean Power Plan Proposed Rule Does Not Adequately Recognize the Role of Nuclear Power in Greenhouse Gas Reduction.”). With the current and expected future low price of natural gas, nuclear power operators are at a financial disadvantage relative to operators of large central station fossil power plants. This is the driving factor in the industry trend of early retirement of existing nuclear power plants.
The following 6 May 2016 announcement by Exelon highlights the current predicament of a high-performing nuclear power operator:
“Exelon deferred decisions on the future of its Clinton and Quad Cities plants last fall to give policymakers more time to consider energy market and legislative reforms. Since then, energy prices have continued to decline. Despite being two of Exelon’s highest-performing plants, Clinton and Quad Cities have been experiencing significant losses. In the past six years, Clinton and Quad Cities have lost more than $800 million, combined.“
“Exelon announced today that it will need to move forward with the early retirements of its Clinton and Quad Cities nuclear facilities if adequate legislation is not passed during the spring Illinois legislative session, scheduled to end on May 31 and if, for Quad Cities, adequate legislation is not passed and the plant does not clear the upcoming PJM capacity auction later this month.”
“Without these results, Exelon would plan to retire Clinton Power Station in Clinton, Ill., on June 1, 2017, and Quad Cities Generating Station in Cordova, Ill., on June 1, 2018.”
You can read Exelon’s entire announcement at the following link:
Together the Clinton and Quad Cities nuclear power plants have a combined Design Electrical Rating of 2,983 MWe from a non-carbon producing source. For the period 2013 – 2015, the U.S. nuclear power industry as a whole had a net capacity factor of 90.41. That means that the nuclear power industry delivered 90.41% of the DER of the aggregate of all U.S. nuclear power plants. The three Exelon plants being considered for early retirement exceeded this industry average performance with the following net capacity factors: Quad Cities 1 @ 101.27; Quad Cities 2 @ 92.68, and Clinton @ 91.26.
For the same 2013 – 2015 period, EIA reported the following net capacity factors for wind (32.96), solar photovoltaic (27.25), and solar thermal (21.25). Using the EIA capacity factor for wind generators, the largest Siemens D7 wind turbine, which is rated at 7.0 MWe, delivers an average output of about 2.3 MWe. We would need more than 1,200 of these large wind turbines just to make up for the electric power delivered by the Clinton and Quad Cities nuclear power plants. Imagine the stability of that regional grid.
CPP continues subsidies to renewable power generators. In time, the intermittent generators will reduce power quality and destabilize the electric power grid unless industrial-scale energy storage systems are deployed to enable the grid operators to match electricity supply and demand with reliable, dispatchable power.
As a nation, I believe we’re trending toward more costly electricity with lower power quality and reliability.