Category Archives: Global Climate

Cow Farts Could be Subject to Regulation Under a New California Law

Peter Lobner

On 19 September 2016, California Governor Jerry Brown signed into law Senate Bill No. 1383 that requires the state to cut methane (CH4) emissions by 40% from 2013 levels by 2030. Now before I say anything about this bill and the associated technology for bovine methane control, you have an opportunity to read the full text of SB 1383 at the following link:

https://leginfo.legislature.ca.gov/faces/billNavClient.xhtml?bill_id=201520160SB1383

You’ll also find a May 2016 overview and analysis here:

https://www.ceres.org/files/water/sb-1383-slcp-summary/at_download/file

The problem statement from the cow’s perspective:

Cows are ruminants with a digestive system that includes a few digestive organs not found in the simpler monogastric digestive systems of humans and many other animals. Other ruminant species include sheep, goat, elk, deer, moose, buffalo, bison, giraffes and camels. Other monogastric species include apes, chimpanzees, horses, pigs, chickens and rhinos.

As explained by the BC Agriculture in the Classroom Foundation:

“Instead of one compartment to the stomach they (ruminants) have four. Of the four compartments the rumen is the largest section and the main digestive center. The rumen is filled with billions of tiny microorganisms that are able to break down (through a process called enteric fermentation) grass and other coarse vegetation that animals with one stomach (including humans, chickens and pigs) cannot digest.

 Ruminant animals do not completely chew the grass or vegetation they eat. The partially chewed grass goes into the large rumen where it is stored and broken down into balls of “cud”. When the animal has eaten its fill it will rest and “chew its cud”. The cud is then swallowed once again where it will pass into the next three compartments—the reticulum, the omasum and the true stomach, the abomasum.”

Cow digestive system

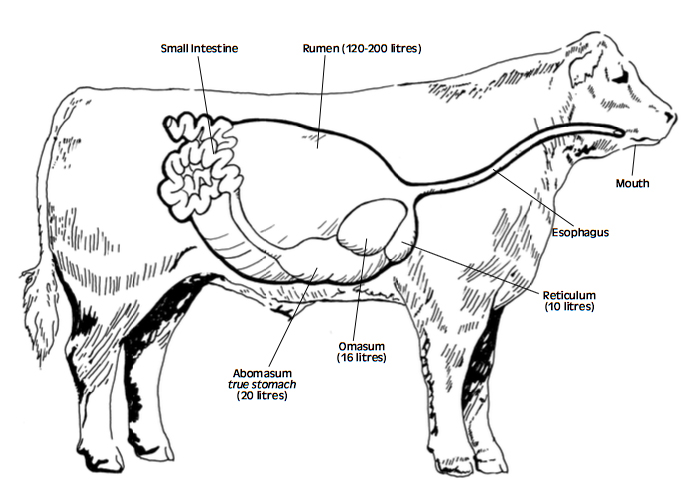
Source: BC Agriculture in the Classroom Foundation

Generation of methane and carbon dioxide in ruminants results from their digestion of carbohydrates in the rumen (their largest digestive organ) as shown in the following process diagram. Cows don’t generate methane from metabolizing proteins or fats.

Cow digestion of carbs

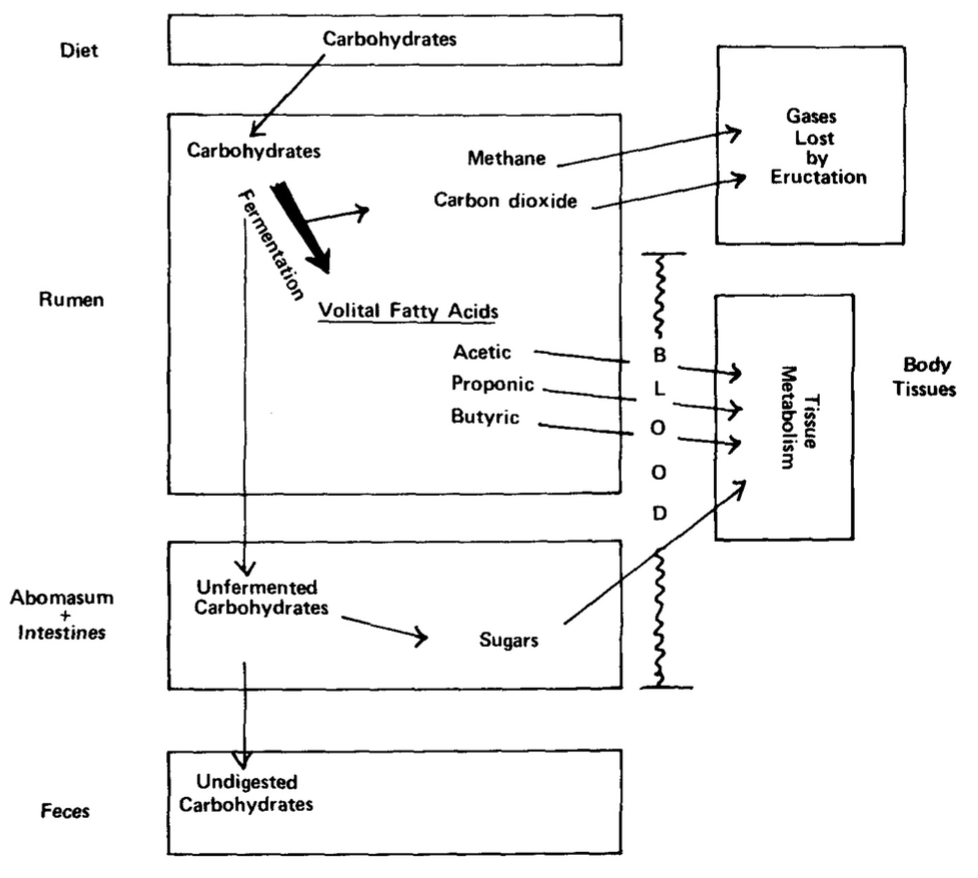
Source: Texas Agricultural Extension Service

You’ll find the similar process diagrams for protein and fat digestion at the following link:

http://animalscience.tamu.edu/wp-content/uploads/sites/14/2012/04/nutrition-cows-digestive-system.pdf

Argentina’s National Institute for Agricultural Technology (INTA) has conducted research into methane emissions from cows and determined that a cow produces about 300 liters of gas per day. At standard temperature and pressure (STP) conditions, that exceeds the volume of a typical cow’s rumen (120 – 200 liters), so frequent bovine farting probably is necessary for the comfort and safety of the cow.

The problem statement from the greenhouse gas perspective:

The U.S. Environmental Protection Agency (EPA) reported U.S. greenhouse gas emissions for the period from 1990 to 2014 in document EPA 430-R-16-002, which you can download at the following link:

https://www3.epa.gov/climatechange/Downloads/ghgemissions/US-GHG-Inventory-2016-Main-Text.pdf

Greenhouse gas emissions by economic sector are shown in the following EPA chart.

us-greenhouse-gas-emissions-economic-1990-2014

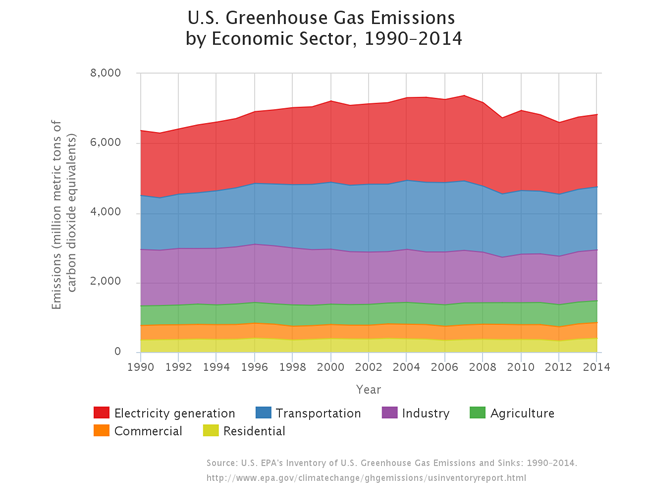
For the period from 1990 to 2014, total emissions from the agricultural sector, in terms of CO2 equivalents, have been relatively constant.

Regarding methane contributions to greenhouse gas, the EPA stated:

“Methane is emitted during the production and transport of coal, natural gas, and oil. Methane emissions also result from livestock and other agricultural practices and by the decay of organic waste in municipal solid waste landfills.

Also, when animals’ manure is stored or managed in lagoons or holding tanks, CH4 is produced. Because humans raise these animals for food, the emissions are considered human-related. Globally, the Agriculture sector is the primary source of CH4 emissions.”

The components of U.S. 2014 greenhouse gas emissions and a breakdown of methane sources are shown in the following two EPA charts.

Sources of GHG

Sources of Methane

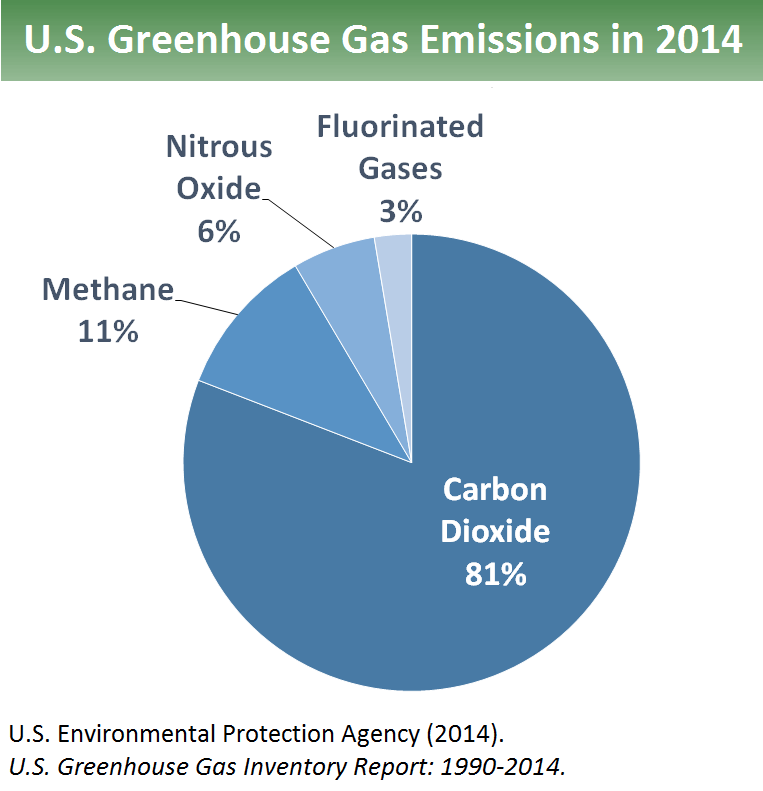
In 2014, methane made up 11% of total U.S. greenhouse gas emissions. Enteric fermentation is the process that generates methane in the rumen of cows and other ruminants, which collectively contribute 2.42% to total U.S. greenhouse gas emissions. Manure management from all sorts of farm animals collectively contributes another 0.88% to total U.S. greenhouse gas emissions.

EPA data from 2007 shows the following distribution of sources of enteric fermentation among farting farm animals.
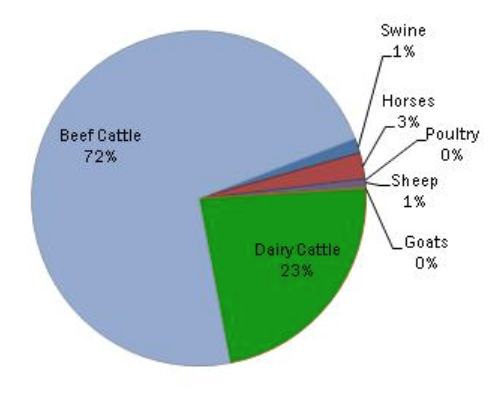
Animal sources of methane

Source: EPA, 2007

So it’s clear that cattle are the culprits. By state, the distribution of methane production from enteric fermentation is shown in the following map.

State sources of methane

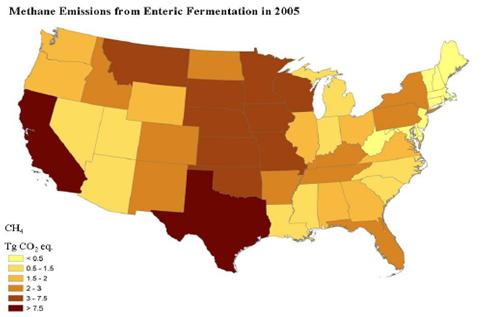
Source: U.S. Department of Agriculture, 2005

On this map, California and Texas appear to be the largest generators of methane from ruminants. More recent data on the cattle population in each state as of 1 January 2015 is available at the following link:

http://www.cattlenetwork.com/advice-and-tips/cowcalf-producer/cattle-inventory-ranking-all-50-states

Here, the top five states based on cattle population are: (1) Texas @ 11.8 million, (2) Nebraska @ 6.3 million, (3) Kansas @ 6.0 million, (4) California @ 5.2 million, and (5) Oklahoma @ 4.6 million.  Total U.S. population of cattle and calves is about 89.5 million.

This brings us back to California’s new law.

The problem statement from the California legislative perspective:

The state has the power to do this, as summarized in the preamble in SB 1383:

“The California Global Warming Solutions Act of 2006 designates the State Air Resources Board as the state agency charged with monitoring and regulating sources of emissions of greenhouse gases. The state board is required to approve a statewide greenhouse gas emissions limit equivalent to the statewide greenhouse gas emissions level in 1990 to be achieved by 2020. The state board is also required to complete a comprehensive strategy to reduce emissions of short-lived climate pollutants, as defined, in the state.”

Particular requirements that apply to the state’s bovine population are the following:

“Work with stakeholders to identify and address technical, market, regulatory, and other challenges and barriers to the development of dairy methane emissions reduction projects.” [39730.7(b)(2)(A)]

“Conduct or consider livestock and dairy operation research on dairy methane emissions reduction projects, including, but not limited to, scrape manure management systems, solids separation systems, and enteric fermentation.” [39730.7(b)(2)(C)(i)]

“Enteric emissions reductions shall be achieved only through incentive-based mechanisms until the state board, in consultation with the department, determines that a cost-effective, considering the impact on animal productivity, and scientifically proven method of reducing enteric emissions is available and that adoption of the enteric emissions reduction method would not damage animal health, public health, or consumer acceptance. Voluntary enteric emissions reductions may be used toward satisfying the goals of this chapter.” [39730.7(f)]

By 1 July 2020, the State Air Resources Board is  required to assess the progress made by the dairy and livestock sector in achieving the goals for methane reduction. If this assessment shows that progress has not been made because of insufficient funding, technical or market barriers, then the state has the leeway to reduce the goals for methane reduction.

Possible technical solution

As shown in a chart above, several different industries contribute to methane production. One way to achieve most of California’s 40% reduction goal in the next 14 years would be to simply move all cattle and dairy cow businesses out of state and clean up the old manure management sites. While this actually may happen for economic reasons, let’s look at some technical alternatives.

  • Breed cows that generate less methane
  • Develop new feed for cows, which could help cows better digest their food and produce less methane.
  • Put a plug in it
  • Collect the methane from the cows

Any type of genetically modified organism (GMO) doesn’t go over well in California, so I think a GMO reduced methane producing cow is simply a non-starter.

A cow’s diet consists primarily of carbohydrates, usually from parts of plants that are not suitable as food for humans and many other animals. The first step in the ruminant digestion process is fermentation in the rumen, and this is the source of methane gas. The only option is to put cows on a low-carb diet. That would be impossible to implement for cows that are allowed to graze in the field.

Based on a cow’s methane production rate, putting a cork in it is a very short-term solution, at best, and you’ll probably irritate the cow.  However, some humorists find this to be an option worthy of further examination.

Source: Taint

That leaves us with the technical option of collecting the methane from the cows. Two basic options exist: collect the methane from the rumen, or from the other end of the cow. I was a bit surprised that several examples of methane collecting “backpacks” have been developed for cows. Unanimously, and much to the relief of the researchers, the international choice for methane collection has been from the rumen.

So, what does a fashionable, environmentally-friendly cow with a methane-collecting backpack look like?

Argentina’s INTA took first place with the sleek blue model shown below.
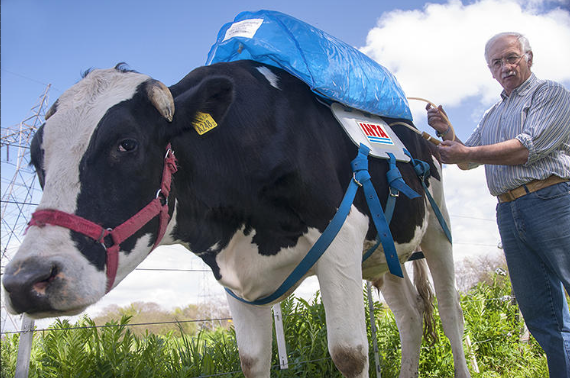
Argentine cowSource: INTA

Another INTA example was larger and more colorful, but considerably less stylish. Even if this INTA experiment fails to yield a practical solution for collecting methane from cows, it clearly demonstrates that cows have absolutely no self-esteem.
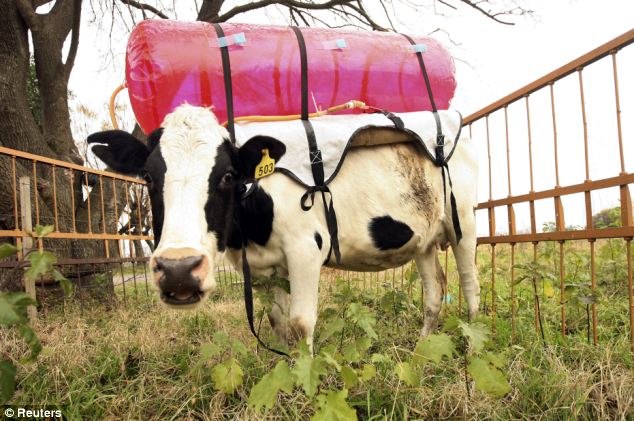
Daily Mail cow methane collectorSource: INTA

In Australia, these cows are wearing smaller backpacks just to measure their emissions.

Australian cow
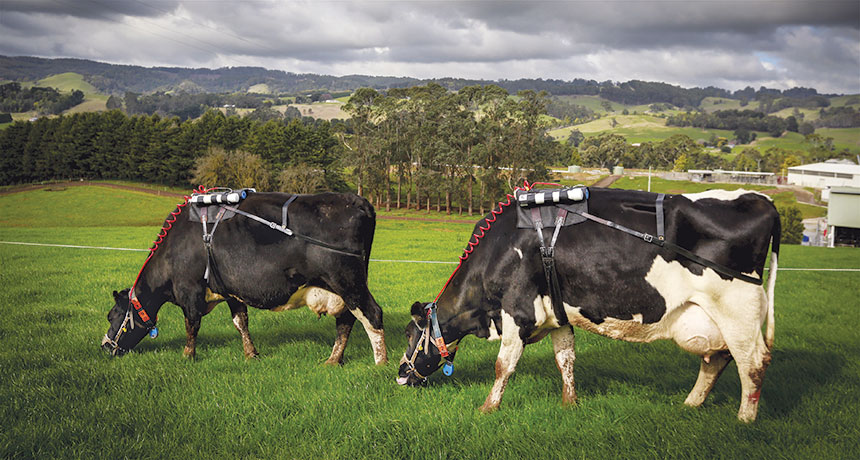
Source: sciencenews.org

Time will tell if methane collection devices become de rigueur for cattle and dairy cows in California or anywhere else in the world. While this could spawn a whole new industry for tending those inflating collection devices and making productive use of the collected methane, I can’t imagine that the California economy could actually support the cost for managing such devices for all of the state’s 5.2 million cattle and dairy cows.

Of all the things we need in California, managing methane from cow farts (oops, I meant to say enteric fermentation) probably is at the very bottom of most people’s lists, unless they’re on the State Air Resources Board.

20 February 2019 Update:  “Negative Emissions Technology” (NET) may be an appropriate solution to methane production from ruminent animals

 In my 19 February 2019 post, “Converting Carbon Dioxide into Useful Products,” I discussed the use of NETs as a means to reduce atmospheric carbon dioxide by deploying carbon dioxide removal “factories” that can be sited independently from the sources of carbon dioxide generation.  An appropriately scaled and sited NET could mitigate the effects of methane released to the atmosphere from all ruminent animals in a selected region, with the added benefit of not interfering directly with the animals.  You can read my post here:

https://lynceans.org/all-posts/converting-carbon-dioxide-into-useful-products/

What to do with Carbon Dioxide

Peter Lobner

In my 17 December 2016 post, “Climate Change and Nuclear Power,” there is a chart that shows the results of a comparative life cycle greenhouse gas (GHG) analysis for 10 electric power-generating technologies. In that chart, it is clear how carbon dioxide capture and storage technologies can greatly reduce the GHG emissions from gas and coal generators.

An overview of carbon dioxide capture and storage technology is presented in a December 2010 briefing paper issued by the London Imperial College. This paper includes the following process flow diagram showing the capture of CO2 from major sources, use or storage of CO2 underground, and use of CO2 as a feedstock in other industrial processes. Click on the graphic to enlarge.

Carbon capture and storage process

You can download the London Imperial College briefing paper at the following link:

https://www.imperial.ac.uk/media/imperial-college/grantham-institute/public/publications/briefing-papers/Carbon-dioxide-storage—-Grantham-BP-4.pdf

Here is a brief look at selected technologies being developed for underground storage (sequestration) and industrial utilization of CO2.

Store in basalt formations by making carbonate rock

Iceland generates about 85% of its electric power from renewable resources, primarily hydro and geothermal. Nonetheless, Reykjavik Energy initiated a project called CarbFix at their 303 MWe Hellisheidi geothermal power plant to control its rather modest CO2 emissions along with hydrogen sulfide and other gases found in geothermal steam.

Hellisheidi geothermal power plantHellisheidi geothermal power plant. Source: Power Technology

The process system collects the CO2 and other gases, dissolves the gas in large volumes of water, and injects the water into porous, basaltic rock 400 – 800 meters (1,312 – 2,624 feet) below the surface. In the deep rock strata, the CO2 undergoes chemical reactions with the naturally occurring calcium, magnesium and iron in the basalt, permanently immobilizing the CO2 as environmentally benign carbonates. There typically are large quantities of calcium, magnesium and iron in basalt, giving a basalt formation a large CO2 storage capacity.

The surprising aspect of this process is that the injected CO2 was turned into hard rock very rapidly. Researchers found that in two years, more that 95% of the CO2 injected into the basaltic formation had been turned into carbonate.

For more information, see the 9 June 2016 Washington Post article by Chris Mooney, “This Iceland plant just turned carbon dioxide into solid rock — and they did it super fast,” at the following link:

https://www.washingtonpost.com/news/energy-environment/wp/2016/06/09/scientists-in-iceland-have-a-solution-to-our-carbon-dioxide-problem-turn-it-into-stone/?utm_term=.886f1ca92c56

The author notes,

“The researchers are enthusiastic about their possible solution, although they caution that they are still in the process of scaling up to be able to handle anything approaching the enormous amounts of carbon dioxide that are being emitted around the globe — and that transporting carbon dioxide to locations featuring basalt, and injecting it in large volumes along with even bigger amounts of water, would be a complex affair.”

Basalt formations are common worldwide, making up about 10% of continental rock and most of the ocean floor. Iceland is about 90% basalt.

Detailed results of this Reykjavik Energy project are reported in a May 2016 paper by J.M. Matter, M. Stute, et al., Rapid carbon mineralization for permanent disposal of anthropogenic carbon dioxide emissions,” which is available on the Research Gate website at the following link:

https://www.researchgate.net/publication/303450549_Rapid_carbon_mineralization_for_permanent_disposal_of_anthropogenic_carbon_dioxide_emissions

Similar findings were made in a separate pilot project in the U.S. conducted by Pacific Northwest National Laboratory and the Big Sky Carbon Sequestration Partnership. In this project, 1,000 tons of pressurized liquid CO2 were injected into a basalt formation in eastern Washington state in 2013. Samples taken two years later confirmed that the CO2 had been converted to carbonate minerals.

These results were published in a November 2016 paper by B. P McGrail, et al., “Field Validation of Supercritical CO2 Reactivity with Basalts.” The abstract and the paper are available at the following link:

http://pubs.acs.org/doi/pdf/10.1021/acs.estlett.6b00387

Store in fractures in deep crystalline rock

Lawrence Berkeley National Laboratory has established an initiative dubbed SubTER (Subsurface Technology and Engineering Research, Development and Demonstration Crosscut) to study how rocks fracture and to develop a predictive understanding of fracture control. A key facility is an observatory set up 1,478 meters (4,850 feet) below the surface in the former Homestake mine near Lead, South Dakota (note: Berkeley shares this mine with the neutrino and dark matter detectors of the Sanford Underground Research Facility). The results of the Berkeley effort are expected to be applicable both to energy production and waste storage strategies, including carbon capture and sequestration.

You can read more about this Berkeley project in the article, “Underground Science: Berkeley Lab Digs Deep For Clean Energy Solutions,” on the Global Energy World website at the following link:

http://www.newswise.com/articles/view/663141/?sc=rssn&utm_source=feedburner&utm_medium=feed&utm_campaign=Feed%3A+NewswiseScinews+%28Newswise%3A+SciNews%29

Make ethanol

Researchers at the Department of Energy’s Oak Ridge National Laboratory (ORNL) have defined an efficient electrochemical process for converting CO2 into ethanol. While direct electrochemical conversion of CO2 to useful products has been studied for several decades, the yields of most reactions have been very low (single-digit percentages) and some required expensive catalysts.

Key points about the new process developed by ORNL are:

  • The electro-reduction process occurs in CO2 saturated water at ambient temperature and pressure with modest electrical requirements
  • The nanotechnology catalyst is made from inexpensive materials: carbon nanospike (CNS) electrode with electro-nucleated copper nanoparticles (Cu/CNS). The Cu/CNS catalyst is unusual because it primarily produces ethanol.
  • Process yield (conversion efficiency from CO2 to ethanol) is high: about 63%
  • The process can be scaled up.
  • A process like this could be used in an energy storage / conversion system that consumes extra electricity when it’s available and produces / stores ethanol for later use.

You can read more on this process in the 19 October 2016 article, “Scientists just accidentally discovered a process that turns CO2 directly into ethanol,” on the Science Alert website at the following link

http://www.sciencealert.com/scientists-just-accidentally-discovered-a-process-that-turns-co2-directly-into-ethanol

The full paper is available on the Chemistry Select website at the following link:

http://onlinelibrary.wiley.com/doi/10.1002/slct.201601169/full

International Energy Agency (IEA) Assesses World Energy Trends

Peter Lobner

The IEA issued two important reports in late 2016, brief overviews of which are provided below.

World Energy Investment 2016 (WEI-2016)

In September 2016, the IEA issued their report, “World Energy Investment 2016,” which, they state, is intended to addresses the following key questions:

  • What was the level of investment in the global energy system in 2015? Which countries attracted the most capital?
  • What fuels and technologies received the most investment and which saw the biggest changes?
  • How is the low fuel price environment affecting spending in upstream oil and gas, renewables and energy efficiency? What does this mean for energy security?
  • Are current investment trends consistent with the transition to a low-carbon energy system?
  • How are technological progress, new business models and key policy drivers such as the Paris Climate Agreement reshaping investment?

The following IEA graphic summarizes key findings in WEI-2016 (click on the graphic to enlarge):

WEI-2016

You can download the Executive Summary of WEI-2016 at the following link:

https://www.iea.org/newsroom/news/2016/september/world-energy-investment-2016.html

At this link, you also can order an individual copy of the complete report for a price (between €80 – €120).

You also can download a slide presentation on WEI 2016 at the following link:

https://csis-prod.s3.amazonaws.com/s3fs-public/event/161025_Laszlo_Varro_Investment_Slides_0.pdf

World Energy Outlook 2016 (WEO-2016)

The IEA issued their report, “World Energy Outlook 2016,” in November 2016. The report addresses the expected transformation of the global energy mix through 2040 as nations attempt to meet national commitments made in the Paris Agreement on climate change, which entered into force on 4 November 2016.

You can download the Executive Summary of WEO-2016 at the following link:

https://www.iea.org/newsroom/news/2016/november/world-energy-outlook-2016.html

At this link, you also can order an individual copy of the complete report for a price (between €120 – €180).

The following IEA graphic summarizes key findings in WEO-2016 (click on the graphic to enlarge):

WEO-2016

Climate Change and Nuclear Power

Peter Lobner

In September 2016, the International Atomic Energy Agency (IAEA) published a report entitled, “Climate Change and Nuclear Power 2016.” As described by the IAEA:

“This publication provides a comprehensive review of the potential role of nuclear power in mitigating global climate change and its contribution to other economic, environmental and social sustainability challenges.”

An important result documented in this report is a comparative analysis of the life cycle greenhouse gas (GHG) emissions for 10 electric power generating technologies. The IAEA authors note that:

“By comparing the GHG emissions of all existing and future energy technologies, this section (of the report) demonstrates that nuclear power provides energy services with very few GHG emissions and is justifiably considered a low carbon technology.

In order to make an adequate comparison, it is crucial to estimate and aggregate GHG emissions from all phases of the life cycle of each energy technology. Properly implemented life cycle assessments include upstream processes (extraction of construction materials, processing, manufacturing and power plant construction), operational processes (power plant operation and maintenance, fuel extraction, processing and transportation, and waste management), and downstream processes (dismantling structures, recycling reusable materials and waste disposal).”

The results of this comparative life cycle GHG analysis appear in Figure 5 of this report, which is reproduced below (click on the graphic to enlarge):

IAEA Climate Change & Nuclear Power

You can see that nuclear power has lower life cycle GHG emissions that all other generating technologies except hydro. It also is interesting to note how effective carbon dioxide capture and storage could be in reducing GHG emissions from fossil power plants.

You can download a pdf copy of this report for free on the IAEA website at the following link:

http://www-pub.iaea.org/books/iaeabooks/11090/Climate-Change-and-Nuclear-Power-2016

For a link to a similar 2015 report by The Brattle Group, see my post dated 8 July 2015, “New Report Quantifies the Value of Nuclear Power Plants to the U.S. Economy and Their Contribution to Limiting Greenhouse Gas (GHG) Emissions.”

It is noteworthy that the U.S. Environmental Protection Agency’s (EPA) Clean Power Plan (CPP), which was issued in 2015, fails to give appropriate credit to nuclear power as a clean power source. For more information on this matter see my post dated 2 July 2015,” EPA Clean Power Plan Proposed Rule Does Not Adequately Recognize the Role of Nuclear Power in Greenhouse Gas Reduction.”

In contrast to the EPA’s CPP, New York state has implemented a rational Clean Energy Standard (CES) that awards zero-emissions credits (ZEC) that favor all technologies that can meet specified emission standards. These credits are instrumental in restoring merchant nuclear power plants in New York to profitable operation and thereby minimizing the likelihood that the operating utilities will retire these nuclear plants early for financial reasons. For more on this subject, see my post dated 28 July 2016, “The Nuclear Renaissance is Over in the U.S.”  In that post, I noted that significant growth in the use of nuclear power will occur in Asia, with use in North America and Europe steady or declining as older nuclear power plants retire and fewer new nuclear plants are built to take their place.

An updated projection of worldwide use of nuclear power is available in the 2016 edition of the IAEA report, “Energy, Electricity and Nuclear Power Estimates for the Period up to 2050.” You can download a pdf copy of this report for free on the IAEA website at the following link:

http://www-pub.iaea.org/books/IAEABooks/11120/Energy-Electricity-and-Nuclear-Power-Estimates-for-the-Period-up-to-2050

Combining the information in the two IAEA reports described above, you can get a sense for what parts of the world will be making greater use of nuclear power as part of their strategies for reducing GHG emissions. It won’t be North America or Europe.

India and Pakistan’s Asymmetrical Nuclear Weapons Doctrines Raise the Risk of a Regional Nuclear War With Global Consequences

Peter Lobner

The nuclear weapons doctrines of India and Pakistan are different. This means that these two countries are not in sync on the matters of how and when they might use nuclear weapons in a regional military conflict. I’d like to think that cooler heads would prevail during a crisis and use of nuclear weapons would be averted. In light of current events, there may not be enough “cooler heads” on both sides in the region to prevail every time there is a crisis.

Case in point: In late September 2016, India announced it had carried out “surgical strikes” (inside Pakistan) on suspected militants preparing to infiltrate from the Pakistan-held part of Kashmir into the Indian-held part of that state. Responding to India’s latest strikes, Pakistan’s Defense Minister, Khawaja Muhammad Asif, has been reported widely to have made the following very provocative statement, which provides unsettling insights into Pakistan’s current nuclear weapons doctrine:

“Tactical weapons, our programs that we have developed, they have been developed for our protection. We haven’t kept the devices that we have just as showpieces. But if our safety is threatened, we will annihilate them (India).”

You can see a short Indian news video on this matter at the following link:

http://shoebat.com/2016/09/29/pakistan-defense-minister-threatens-to-wipe-out-india-with-a-nuclear-attack-stating-we-will-annihilate-india/

 1. Asymmetry in nuclear weapons doctrines

There are two recent papers that discuss in detail the nuclear weapons doctrines of India and Pakistan. Both papers address the issue of asymmetry and its operational implication. However, the papers differ a bit on the details of the nuclear weapons doctrines themselves. I’ll start by briefly summarizing these papers and using them to synthesize a short list of the key points in the respective nuclear weapons doctrines.

The first paper, entitled “India and Pakistan’s Nuclear Doctrines and Posture: A Comparative Analysis,” by Air Commodore (Retired) Khalid Iqbal, former Assistant Chief of Air Staff, Pakistan Air Force was published in Criterion Quarterly (Islamabad), Volume 11, Number 3, Jul-Sept 2016. The author’s key points are:

“Having preponderance in conventional arms, India subscribed to ‘No First Use’ concept but, soon after, started diluting it by attaching conditionalities to it; and having un-matching conventional capability, Pakistan retained the options of ‘First Use.’. Ever since 1998, doctrines of both the countries are going through the pangs of evolution. Doctrines of the two countries are mismatched. India intends to deter nuclear use by Pakistan while Pakistan’s nuclear weapons are meant to compensate for conventional arms asymmetry.”

You will read Khalid Iqbal’s complete paper at the following link:

https://www.academia.edu/28382385/India_and_Pakistans_Nuclear_Doctrines_and_Posture_A_Comparative_Analysis

The second paper, entitled “A Comparative Study of Nuclear Doctrines of India and Pakistan,” by Amir Latif appeared in the June 2014, Vol. 2, No. 1 issue of Journal of Global Peace and Conflict. The author provides the following summary (quoted from a 2005 paper by R. Hussain):

“There are three main attributes of the Pakistan’s undeclared nuclear doctrine. It has three distinct policy objectives: a) deter a first nuclear use by India; b) enable Pakistan to deter Indian conventional attack; c) allow Islamabad to “internationalize the crisis and invite outside intervention in the unfavorable circumstance.”

You can read Amir Latif’s complete paper at the following link

http://jgpcnet.com/journals/jgpc/Vol_2_No_1_June_2014/7.pdf

Synopsis of India’s nuclear weapons doctrine

India published its official nuclear doctrine on 4 January 2003. The main points related to nuclear weapons use are the following.

  1. India’s nuclear deterrent is directed toward Pakistan and China.
  2. India’s will build and maintain a credible minimum deterrent against those nations.
  3. India’s adopted a “No First Use” policy, subject to the following caveats:
    • India may use nuclear weapons in retaliation after a nuclear attack on its territory or on its military forces (wherever they may be).
    • In the event of a major biological or chemical attack, India reserves the option to use nuclear weapons.
  4. Only the civil political leadership (the Nuclear Command Authority) can authorize nuclear retaliatory attacks.
  5. Nuclear weapons will not be used against non-nuclear states (see caveat above regarding chemical or bio weapon attack).

Synopsis of Pakistan’s nuclear weapons doctrine

Pakistan does not have an officially declared nuclear doctrine. Their doctrine appears to be based on the following points:

  1. Pakistan’s nuclear deterrent is directed toward India.
  2. Pakistan will build and maintain a credible minimum deterrent.
    • The sole aim of having these weapons is to deter India from aggression that might threaten Pakistan’s territorial integrity or national independence / sovereignty.
    • Size of the deterrent force is enough inflict unacceptable damage on India with strikes on counter-value targets.
  3. Pakistan has not adopted a “No First Use” policy.
    • Nuclear weapons are essential to counter India’s conventional weapons superiority.
    • Nuclear weapons reestablish an overall Balance of Power, given the unbalanced conventional force ratios between the two sides (favoring India).
  4. National Command Authority (NCA), comprising the Employment Control Committee, Development Control Committee and Strategic Plans Division, is the center point of all decision-making on nuclear issues.
  5. Nuclear assets are considered to be safe, secure and almost free from risks of improper or accidental use.

The nuclear weapons doctrine asymmetry between India and Pakistan really boils down to this:

 India’s No First Use policy (with some caveats) vs. Pakistan’s policy of possible first use to compensate for conventional weapons asymmetry.

2. Nuclear tests and current nuclear arsenals

India

India tested its first nuclear device on 18 May 1974. Twenty-four years later, in mid-1998, tests of three devices were conducted, followed two days later by two more tests. All of these tests were low-yield, but multiple weapons configurations were tested in 1998.

India’s current nuclear arsenal is described in a paper by Hans M. Kristensen and Robert S. Norris entitled, “Indian Nuclear Forces, 2015,” which was published online on 27 November 2015 in the Bulletin of Atomic Scientists, Volume 71 at the following link:

http://www.tandfonline.com/doi/full/10.1177/0096340215599788

In this paper, authors Kristensen and Norris make the following points regarding India’s nuclear arsenal.

  • India is estimated to have produced approximately 540 kg of weapon-grade plutonium, enough for 135 to 180 nuclear warheads, though not all of that material is being used.
  • India has produced between 110 and 120 nuclear warheads.
  • The country’s fighter-bombers are the backbone of its operational nuclear strike force.
  • India also has made considerable progress in developing land-based ballistic missile and cruise missile delivery systems.
  • India is developing a nuclear-powered missile submarine and is developing sea-based ballistic missile (and cruise missile) delivery systems.

Pakistan

Pakistan is reported to have conducted many “cold” (non-fission) tests in March 1983. Shortly after the last Indian nuclear tests, Pakistan conducted six low-yield nuclear tests in rapid succession in late May 1998.

On 1 August 2016, the Congressional Research Service published the report, “Pakistan’s Nuclear Weapons,” which provides an overview of Pakistan’s nuclear weapons program. You can download this report at the following link:

https://www.fas.org/sgp/crs/nuke/RL34248.pdf

An important source for this CRS report was another paper by Hans M. Kristensen and Robert S. Norris entitled, “Pakistani Nuclear Forces, 2015,” which was published online on 27 November 2015 in the Bulletin of Atomic Scientists, Volume 71 at the following link:

http://www.tandfonline.com/doi/full/10.1177/0096340215611090

In this paper, authors Kristensen and Norris make the following points regarding Pakistan’s nuclear arsenal.

  • Pakistan has a nuclear weapons stockpile of 110 to 130 warheads.
  • As of late 2014, the International Panel on Fissile Materials estimated that Pakistan had an inventory of approximately 3,100 kg of highly enriched uranium (HEU) and roughly 170kg of weapon-grade plutonium.
  • The weapons stockpile realistically could grow to 220 – 250 warheads by 2025.
  • Pakistan has several types of operational nuclear-capable ballistic missiles, with at least two more under development.

3. Impact on global climate and famine of a regional nuclear war between India and Pakistan

On their website, the organization NuclearDarkness presents the results of analyses that attempt to quantify the effects on global climate of a nuclear war, based largely on the quantity of smoke lofted into the atmosphere by the nuclear weapons exchange. Results are presented for three cases: 5, 50 and 150 million metric tons (5, 50 and 150 Teragrams, Tg). The lowest case, 5 million tons, represents a regional nuclear war between India and Pakistan, with both sides using low-yield nuclear weapons. A summary of the assessment is as follows:

“Following a war between India and Pakistan, in which 100 Hiroshima-size (15 kiloton) nuclear weapons are detonated in the large cities of these nations, 5 million tons of smoke is lofted high into the stratosphere and is quickly spread around the world. A smoke layer forms around both hemispheres which will remain in place for many years to block sunlight from reaching the surface of the Earth. One year after the smoke injection there would be temperature drops of several degrees C within the grain-growing interiors of Eurasia and North America. There would be a corresponding shortening of growing seasons by up to 30 days and a 10% reduction in average global precipitation.”

You will find more details, including a day-to-day animation of the global distribution of the dust cloud for a two-month period after the start of the war, at the following link:

http://www.nucleardarkness.org/warconsequences/fivemilliontonsofsmoke/

In the following screenshots from the animation at the above link, you can see how rapidly the smoke distributes worldwide in the upper atmosphere after the initial regional nuclear exchange.

Regional war cloud dispersion 1

Regional war cloud dispersion 2

Regional war cloud dispersion 3

This consequence assessment on the nucleardarkness.org website is based largely on the following two papers by Robock, A. et al., which were published in 2007:

The first paper, entitled, “Nuclear winter revisited with a modern climate model and current nuclear arsenals: Still catastrophic consequences,” was published in the Journal of Geophysical Research, Vol. 112. The authors offer the following comments on the climate model they used.

“We use a modern climate model to reexamine the climate response to a range of nuclear wars, producing 50 and 150 Tg of smoke, using moderate and large portions of the current global arsenal, and find that there would be significant climatic responses to all the scenarios. This is the first time that an atmosphere-ocean general circulation model has been used for such a simulation and the first time that 10-year simulations have been conducted.”

You can read this paper at the following link:

http://climate.envsci.rutgers.edu/pdf/RobockNW2006JD008235.pdf

The second paper, entitled, “Climatic consequences of regional nuclear conflicts”, was published in Atmospheric Chemistry and Physics, 7, pp. 2003 – 2012. This paper provides the analysis for the 5 Tg case.

“We use a modern climate model and new estimates of smoke generated by fires in contemporary cities to calculate the response of the climate system to a regional nuclear war between emerging third world nuclear powers using 100 Hiroshima-size bombs.”

You can read this paper at the following link:

http://www.atmos-chem-phys.net/7/2003/2007/acp-7-2003-2007.pdf

Building on the work of Roblock, Ira Helhand authored the paper, “An Assessment of the Extent of Projected Global Famine Resulting From Limited, Regional Nuclear War.” His main points with regard to a post-war famine are:

“The recent study by Robock et al on the climatic consequences of regional nuclear war shows that even a “limited” nuclear conflict, involving as few as 100 Hiroshima-sized bombs, would have global implications with significant cooling of the earth’s surface and decreased precipitation in many parts of the world. A conflict of this magnitude could arise between emerging nuclear powers such as India and Pakistan. Past episodes of abrupt global cooling, due to volcanic activity, caused major crop failures and famine; the predicted climate effects of a regional nuclear war would be expected to cause similar shortfalls in agricultural production. In addition large quantities of food might need to be destroyed and significant areas of cropland might need to be taken out of production because of radioactive contamination. Even a modest, sudden decline in agricultural production could trigger significant increases in the prices for basic foods and hoarding on a global scale, both of which would make food inaccessible to poor people in much of the world. While it is not possible to estimate the precise extent of the global famine that would follow a regional nuclear war, it seems reasonable to postulate a total global death toll in the range of one billion from starvation alone. Famine on this scale would also lead to major epidemics of infectious diseases, and would create immense potential for war and civil conflict.”

You can download this paper at the following link:

http://www.psr.org/assets/pdfs/helfandpaper.pdf

 4. Conclusions

The nuclear weapons doctrines of India and Pakistan are not in sync on the matters of how and when they might use nuclear weapons in a regional military conflict. The highly sensitive region of Kashmir repeatedly has served as a flashpoint for conflicts between India and Pakistan and again is the site of a current conflict. If the very provocative recent statements by Pakistan’s Defense Minister, Khawaja Muhammad Asif, are to be believed, then there are credible scenarios in which Pakistan makes first use of low-yield nuclear weapons against India’s superior conventional forces.

The consequences to global climate from this regional nuclear conflict can be quite significant and lasting, with severe impacts on global food production and distribution. With a bit of imagination, I’m sure you can piece together a disturbing picture of how an India – Pakistan regional nuclear conflict can evolve into a global disaster.

Let’s hope that cooler heads in that region always prevail.

Is it Possible to Attribute Specific Extreme Weather Events to Global Climate Change?

Peter Lobner

On 7 September 2016, the National Oceanic and Atmospheric Administration (NOAA) reported that climate change increased the chance of record rains in Louisiana by at least 40%. This finding was based on a rapid assessment conducted by NOAA and partners after unusually severe and prolonged rains affected a broad area of Louisiana in August 2016. You can read this NOAA news release at the following link:

http://www.noaa.gov/media-release/climate-change-increased-chances-of-record-rains-in-louisiana-by-at-least-40-percent

NOAA reported that models indicated the following:

  • The return period for extreme rain events of the magnitude of the mid-August 2016 downpour in Louisiana has decreased from an average of 50 years to 30 years.
  • A typical 30-year event in 1900 would have had 10% less rain than a similar event today; for example, 23 inches instead of 25 inches.

NOAA notes that “return intervals” are statistical averages over long periods of time, which means that it’s possible to have more than one “30-year event” in a 30-year period.

NOAA Lousiana Aug2016 extreme rain graphSource: NOAA

In their news release NOAA included the following aerial photos of Denham Springs, Louisiana. The photo on the left was at the height of the flooding on August 15, 2016. The photo on the right was taken three days later when floodwaters had receded.

NOAA Lousiana Aug2016 extreme rain photosSource: NOAA / National Geodetic Survey

World Weather Attribution (WWA) is an international effort that is, “designed to sharpen and accelerate the scientific community’s ability to analyze and communicate the possible influence of climate change on extreme-weather events such as storms, floods, heat waves and droughts”. Their website is at the following link:

https://wwa.climatecentral.org

WWA attempts to address the question: “Did climate change have anything to do with this?” but on their website, WWA cautions:

“Scientists are now able to answer this for many types of extremes. But the answer may vary depending on how the question is framed……..it is important for every extreme event attribution study to clearly define the event and state the framing of the attribution question.”

To get a feeling for how they applied this principal, you can read the WWA report, “Louisiana Downpours, August 2016,” at the following link:

https://wwa.climatecentral.org/analyses/louisiana-downpours-august-2016/

I find this report quite helpful in putting the Louisiana extreme precipitation event in perspective. I object to the reference to “human-caused climate change,” in the report because the findings should apply regardless of the source of the observed change in climate between 1900 and 2016.

On the WWA website, you can easily navigate to several other very interesting analyses of extreme weather events, and much more.

The National Academies Press (NAP) recently published the following two reports on extreme weather attribution, both of which are worth your attention.

The first NAP report, “Attribution of Extreme Weather Events in the Context of Climate Change,” applies to the type of rapid assessment performed by NOAA after the August 2016 extreme precipitation event in Louisiana. The basic premise of this report is as follows:

“The media, the public, and decision makers increasingly ask for results from event attribution studies during or directly following an extreme event. To meet this need, some groups are developing rapid and/or operational event attribution systems to provide attribution assessments on faster timescales than the typical research mode timescale, which can often take years.”

NAP Attribution of Severe Weather Events  Source: NAP

If you have established a free NAP account, you can download a pdf copy of this report for free at the following link:

http://www.nap.edu/catalog/21852/attribution-of-extreme-weather-events-in-the-context-of-climate-change

The second NAP report, “Frontiers of Decadal Climate Variability,” addresses a longer-term climate issue. This report documents the results of a September 2015 workshop convened by the National Academies of Sciences, Engineering, and Medicine to examine variability in Earth’s climate on decadal timescales, which they define as 10 to 30 years.

NAP Decadal Climate Variation   Source: NAP

This report puts the importance of understanding decadal climate variability in the following context:

“Many factors contribute to variability in Earth’s climate on a range of timescales, from seasons to decades. Natural climate variability arises from two different sources: (1) internal variability from interactions among components of the climate system, for example, between the ocean and the atmosphere, and (2) natural external forcing (functions), such as variations in the amount of radiation from the Sun. External forcing (functions) on the climate system also arise from some human activities, such as the emission of greenhouse gases (GHGs) and aerosols. The climate that we experience is a combination of all of these factors.

Understanding climate variability on the decadal timescale is important to decision-making. Planners and policy makers want information about decadal variability in order to make decisions in a range of sectors, including for infrastructure, water resources, agriculture, and energy.”

While decadal climate variability is quite different than specific extreme weather events, the decadal variability establishes the underlying climate patterns on which extreme weather events may occur.

You can download a pdf copy of this report for free at the following link:

http://www.nap.edu/catalog/23552/frontiers-in-decadal-climate-variability-proceedings-of-a-workshop

I think it’s fair to say that, in the future, we will be seeing an increasing number of “quick response” attributions of extreme weather events to climate change. Each day in the financial section of the newspaper (Yes, I still get a printed copy of the daily newspaper!), there is an attribution from some source about why the stock market did what it did the previous day. Some days these financial attributions seem to make sense, but other days they’re very much like reading a fortune cookie or horoscope, offering little more than generic platitudes.

Hopefully there will be real science behind attributions of extreme weather events to climate change and the attributors will heed WWA’s caution:

“…it is important for every extreme event attribution study to clearly define the event and state the framing of the attribution question.”

2016 Arctic Sea Ice Minimum Was Second Lowest on Record

Peter Lobner

On 15 September 2016, the National Snow and Ice Data Center (NSIDC) in Boulder, CO reported their preliminary assessment that the Arctic sea ice minimum for this year was reached on 10 September 2016.

Arctic sea ice minimum 10Sep2016Source: NSIDC

The minimum extent of the Arctic sea ice on 10 September 2016 was 4.14 million square kilometers (1.60 million square miles). This is the white area in the map above. The orange line on this map shows the 1981 to 2010 median extent of the Arctic sea ice for that day.

  • There were extensive areas of open water on the Northern Sea Route along the Arctic coast of Russia (the Beaufort and Chukchi seas, and in the Laptev and East Siberian seas).
  • In contrast, there was much less open water on parts of the Northwest Passage along the Arctic coast of Canada (around Banks and Victoria Islands).

The 2016 minimum tied with 2007 for the second lowest Arctic sea ice minimum on record.

The historic Arctic sea ice minimum, which occurred in 2012, was 3.39 million square kilometers (1.31 million square miles); about 18% less than in 2016 [750,000 square kilometers (290,000 square miles) less than in 2016].

You can read the NSIDC preliminary report on the 2016 Arctic sea ice minimum at the following link:

https://nsidc.org/arcticseaicenews/

An historic event in the Arctic occurred in September 2016 when the commercial cruise liner Crystal Serenity, escorted by the RRS Shackleton, made the first transit of the Northwest Passage by a cruise liner. The voyage originated in Vancouver, Canada and arrived in New York City on 16 September 2016. The timing of this Arctic cruise coincided well with this year’s minimum sea ice conditions. See my 30 August 2016 post for more details on the Crystal Serenity’s historic Arctic voyage.

Cruise Liner Crystal Serenity is Navigating the Northwest Passage Now

Peter Lobner

Background:

The Northwest Passage connects the Pacific and Atlantic Oceans via an Arctic sea route along the north coasts of Alaska and Canada. The basic routes are shown in the following map.

The Northwest Passage connects the Pacific and Atlantic Oceans via an Arctic sea route along the north coasts of Alaska and Canada. The basic routes are shown in the following map.

Northwest PassageSource: Encyclopedia Britannica

While it has been common for icebreakers, research vessels and nuclear submarines to operate in these waters, it is quite uncommon for commercial or private vessels to attempt to navigate the Northwest Passage.

The first recorded transit of the Northwest Passage was made in 1903 – 06 by the famous Norwegian polar explorer Roland Amundsen in the ship Gjoa.

Amundsens ship GjoaAmundsen’s ship Gjoa. Source: Underwood Archives/UIG/Everett Collection

Since then, there have been many full transits of the Northwest Passage. You’ll find John MacFarlane’s list of 126 transits for the period from 1903 – 2006 on the Nauticapedia website at the following link:

http://www.nauticapedia.ca/Articles/NWP_Fulltransits.php

Notable Northwest Passage transits by commercial and private vessels

In August 1969, the heavily modified oil tanker SS Manhattan, chartered by Humble Oil & Refining Company, became the first commercial vessel to navigate the Northwest Passage. At the time, the SS Manhattan was the largest U.S. merchant vessel, with a length of 1,005 feet (306 meters), beam of 148 feet (45 meters), draft of 52 feet (16 meters), and a displacement of 115,000 tons. Total installed power was 43,000 shaft horsepower (32,000 kW).

THE MANHATTAN SS Manhattan and CCGS Louis S. St-Laurent. Source: Associated Press

Prior to the Arctic voyage, the SS Manhattan was fitted with an icebreaking bow and heavy steel sheathing along both sides of the hull and in other vulnerable locations to protect against ice. The specific route of the SS Manhattan, from the Atlantic to Prudhoe Bay and then back to the Atlantic, is shown below. Several U.S. and Canadian icebreakers supported the SS Manhattan during its voyage.

Manhattan route 1969Source: NOAA, Susie Harder – Arctic Council – Arctic marine shipping assessment (AMSA)

Oil was discovered at Prudhoe Bay in 1968. A barrel of crude oil was loaded on SS Manhattan in Prudhoe Bay to symbolize that supertankers operating in the Arctic could serve the newly discovered oil field. Further testing that winter off Baffin Island showed that year-round oil tanker operations in the Arctic were not feasible. Instead, the Trans-Alaska Pipeline from Prudhoe Bay to Valdez, Alaska was built.

In 2007, the Northwest Passage became ice-free and navigable along its entire length without the need for an icebreaker for 36 days during August and September. During that period, the sailing vessel Cloud Nine passed through the Northwest Passage during its 6,640 mile, 73 day transit from the Atlantic to the Pacific. You can read David Thoreson’s blog about this Arctic voyage, Sailing the Northwest Passage, at the following link:

http://davidthoreson.blogspot.com/2007/09/completing-northwest-passage-2007.html

This voyage was a remarkable achievement for a small vessel. In his blog, David Thoreson commented:

“I feel strongly that we have witnessed the end of an era and the beginning of a new one. The golden age of exploration, Amundsen’s era, has come to a close, and a new era of exploration involving study and change in the earth’s climate is just beginning. We on Cloud Nine have experienced both eras. Frozen in and stuck in the ice twice over 13 years, and now sailing through unscathed and witnessing an ice-free Northwest Passage. We have bridged the two eras.”

Are we seeing the start of tourism in the Northwest Passage?

On 10 August 2016, Crystal Serenity departed Vancouver for Seward Alaska and the start of what is scheduled to be a 32-day voyage to New York City via the Northwest Passage. The ship is scheduled to arrive in NYC on 16 September 2016. The planned route for this cruise is shown below.

nwp-map-300-dpiSource: Crystal Cruises

The Crystal Serenity is smaller than SS Manhattan, but still is a fairly big ship, with a length of 820 feet (250 meters), beam of 106 feet (32.3 meters), draft of 25 feet (7.6 meters), and a displacement of 68,870 tons. On this voyage, Capt. Birger Vorland and two Canadian pilots will navigate the Northwest Passage with more than 1,600 passengers and crew.

Crystal Serenity will be accompanied by the icebreaking escort vessel RRS (Royal Research Ship) Ernest Shackleton, which was chartered by Crystal Cruises for this support cruise. Along the planned route, there are few ports that can accommodate a vessel the size of Crystal Serenity. Along most of the route emergency response capabilities are quite limited. Therefore, RRS Shackleton is equipped to serve as a first response vessel in the event of an emergency aboard Crystal Serenity. RRS Shackleton also carries two helicopters and additional crew to support special adventures during the cruise.

Crystal Serenity at Seward AlaskaCrystal Serenity in Seward, Alaska. Source: NPR.com, Rachel Waldholz/Alaska Public Radio

You can find a current report on the sea ice extent along the Northwest Passage at the National Snow and Ice Data Center’s website at the following link:

http://nsidc.org/arcticseaicenews/

The ice extent report today is shown in the following chart, which shows that the current ice extent is well below the 1981 – 2010 median. However, there appear to be sections of the Northwest Passage around Banks and Victoria Islands that are still covered by the Arctic ice pack. Crystal Serenity is scheduled to be in these waters soon.

Ice extent 28Aug2016Source: National Snow and Ice Data Center

You can track the current position of the Crystal Serenity as it makes its historic voyage at the following link:

http://www.cruisemapper.com/Crystal-Serenity-location?imo=9243667

As of 5:50 PM PDT, 29 August 2016, the ship is approaching Barrow, Alaska, as shown on the following map.

Location of Crystal Serenity 29Aug16Source: cruisemapper.com

A second cruise already is planned for 2017. You can book your Northwest Passage cruise on the Crystal Cruises website at the following link:

http://www.crystalcruises.com/northwest-passage-cruise

Update 24 September 2016: Mission accomplished!

On 16 September, the Crystal Serenity became the first cruise liner ever to transit the Northwest Passage. The west – east passage from Seward, Alaska to New York City took 32 days and covered 7,297 nautical miles (13,514 km).

Crystal Serenity Arrives in New York after Historic Northwest Passage VoyageCrystal Serenity arrives in NYC. Source: Crystal Cruises

U.S. Global (Climate) Change Research Program Plan Update

Peter Lobner

It used to be called “global warming”, then came “global climate change.” Now it seems that the simpler, but less informative term “global change” has become the politically-correct variant. National Academies Press (NAP) has just published the final document, “Review of the U.S. Global Change Research Program’s Update to the Strategic Plan Document.”

image  Source: NAP

The NAP abstract states:

“The Update to the Strategic Plan (USP) is a supplement to the Ten-Year Strategic Plan of the U.S. Global Change Research Program (USGCRP) completed in 2012. The Strategic Plan sets out a research program guiding thirteen federal agencies in accord with the Global Change Research Act of 1990. This report reviews whether USGCRP’s efforts to achieve its goals and objectives, as documented in the USP, are adequate and responsive to the Nation’s needs, whether the priorities for continued or increased emphasis are appropriate, and if the written document communicates effectively, all within a context of the history and trajectory of the Program.”

You might find this interesting reading. If you have a MyNAP account, you can download a PDFs copy of this report for free at the following link:

http://www.nap.edu/catalog/23396/review-of-the-us-global-change-research-programs-update-to-the-strategic-plan-document

You can download the 2011 report, “Review of the U.S. Global Change Research Program’s Strategic Plan,” at the following link:

http://www.nap.edu/catalog/13330/a-review-of-the-us-global-change-research-programs-strategic-plan

Draw your own conclusions on how this updated plan implements science and politics.

Science is not Driving the Climate Change Debate

Peter Lobner

Thanks to Paul Fleming for sending me a thought provoking, well-documented paper entitled, “Global Warming and the Irrelevance of Science,” which was posted online on 17 February 2016 by Richard S. Lindzen, Alfred P. Sloan Professor of Atmospheric Sciences (Emeritus) Massachusetts Institute of Technology. This paper is the text of a lecture delivered on 20 August 2015 to the 48th Session: Erice International Seminars on Planetary Emergencies.

The basic premise of this paper is that, in many fields such as climate research, governments have a monopoly on the support of scientific research, and, through government-funded research contracts, influence the outcome of the very research being funded.

Lindzen starts his paper by observing that,

“Unfortunately, as anticipated by Eisenhower in his farewell speech from January 17, 1961 (the one that also warned of the military-industrial complex), ‘Partly because of the huge costs involved, a government contract becomes virtually a substitute for intellectual curiosity.’

Rather, the powers that be invent the narrative independently of the views of even cooperating scientists. It is, in this sense, that the science becomes irrelevant.”

Lindzen uses the term “iron triangle” to describe this closed-loop vicious cycle:

  • Vertex 1: Scientists perform research and make meaningless or ambiguous statements about the research (IPCC WG1)
  • Vertex 2: Advocates and media ‘translate’ these statements into alarmist declarations [IPCC WG2 (impacts) & WG3 (mitigation), some politicians]
  • Vertex 3: Politicians respond to alarm by feeding more money to the scientists in the first vertex

The net result is poor environmental decision-making that is not supportable by credible climate science. On this matter, Lindzen notes:

“The situation may have been best summarized by Mike Hulme, director of the Tyndall Centre at the University of East Anglia (a center of concern for global warming): “To state that climate change will be ‘catastrophic’ hides a cascade of value-laden assumptions, which do not emerge from empirical or theoretical science.”

Lindzen characterized the following three different narratives related to the global warming debate:

  • Narrative 1 – IPCC WG1:
    • Broadly supportive of the proposition that increasing greenhouse gas concentrations are a serious concern
    • Relatively open about the uncertainties and even contradictions associated with this position
    • Public pronouncements tend to be vague with ample room for denial, carefully avoiding catastrophist hyperbole while also avoiding outright rejection of such hyperbole
  • Narrative 2 – Skeptics:
    • Regard the fact that virtually all models ‘run hot’ (i.e., their projections for the most part greatly exceed observed warming) as strongly supporting the case for low climate sensitivity
    • Generally believe in testing the physics underlying the positive feedbacks in sensitive models rather than averaging models
    • Much more open to the numerous known causes of climate change (including long period ocean circulations, solar variability, impacts of ice, etc.), and do not regard CO2 as the climate’s ultimate ‘control knob’
    • Openly oppose catastrophism
  • Narrative 3 – Political promoters of climate alarm (including IPCC WG2 & WG3, many environmental NGOs and mass media)
    • Emphasize alleged consequences of the worst case scenarios presented by WG1
    • Claim virtually unanimous support
    • It is this narrative for which the science is largely irrelevant.

Lindzen notes that, “Unfortunately, for most people, the third narrative is all they will see.“

You can read Richard S. Lindzen’s complete paper at the following link:

http://euanmearns.com/global-warming-and-the-irrelevance-of-science/

Thanks also to Mike Spaeth for sending me the following link to an informative document entitled, “A Primer on Carbon Dioxide and Climate,” prepared by a recently formed organization known as the CO2 Coalition.

http://co2coalition.org/primer-carbon-dioxide-climate/

The CO2 Coalition, formed in 2015, represents itself as, “a new and independent, non-profit organization that seeks to engage thought leaders, policy makers, and the public in an informed, dispassionate discussion of how our planet will be affected by CO2 released from the combustion of fossil fuel.” Hopefully, they can help make some headway with the mass media, general public, and politicians that currently are entrenched in Narrative 3. Even cartoonists know that this will be an uphill battle.

Research & critical thinking

Source: http://www.gocomics.com/nonsequitur/2016/02/16