Peter Lobner
The National Oceanic and Atmospheric Administration’s (NOAA’s) National Centers for Environmental Information (NCEI) are responsible for “preserving, monitoring, assessing, and providing public access to the Nation’s treasure of climate and historical weather data and information.” The main NOAA / NCEI website is here:
The “State of the Climate” is a collection of monthly summaries recapping climate-related occurrences on both a global and national scale. Your starting point for accessing this collection is here:
https://www.ncdc.noaa.gov/sotc/
The following monthly summaries are available.
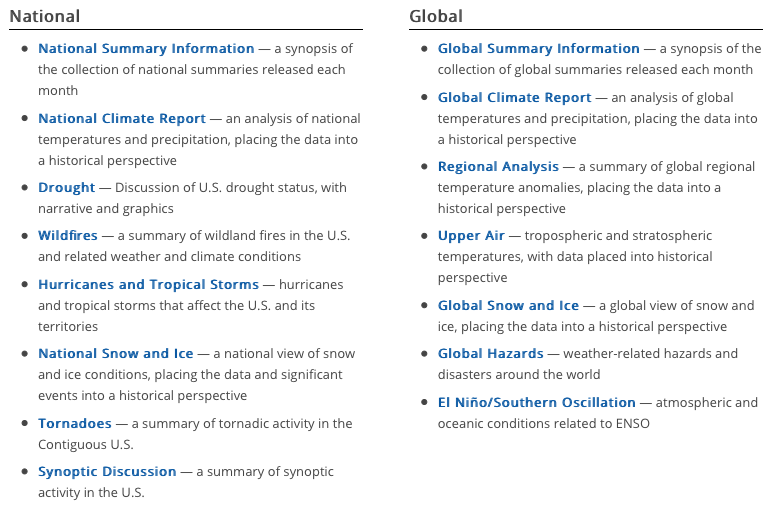
I’d like to direct your attention to two particularly impressive monthly summaries:
- Global Summary Information, which provides a comprehensive top-level view, including the Sea Ice Index
- Global Climate Report, which provides more information on temperature and precipitation, but excludes the Sea Ice Index information
Here are some of the graphics from the Global Climate Report for June 2019.
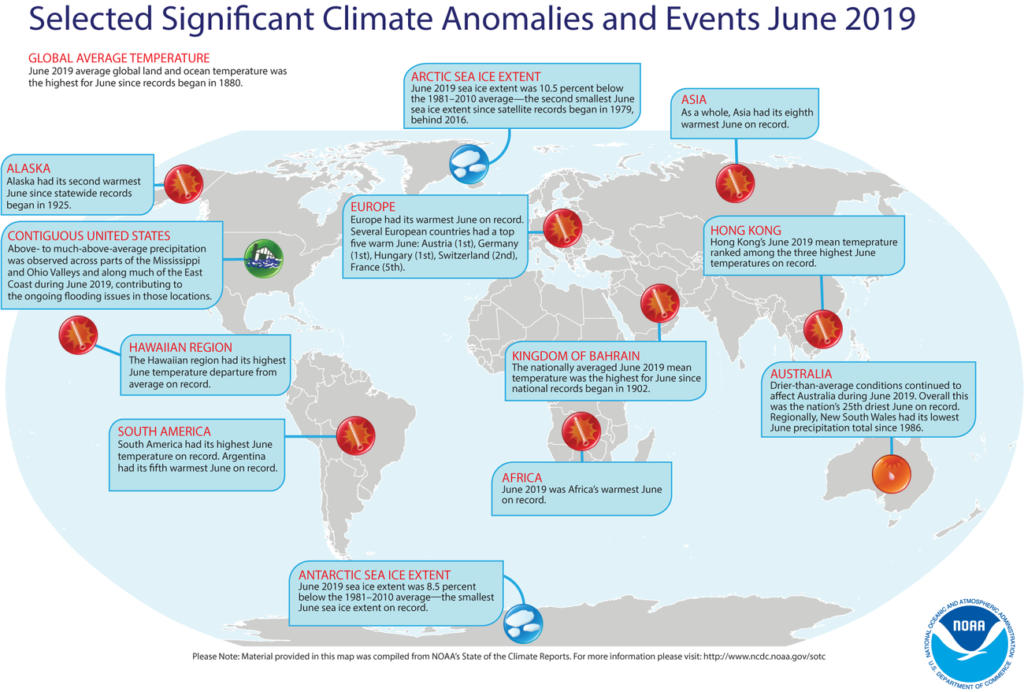
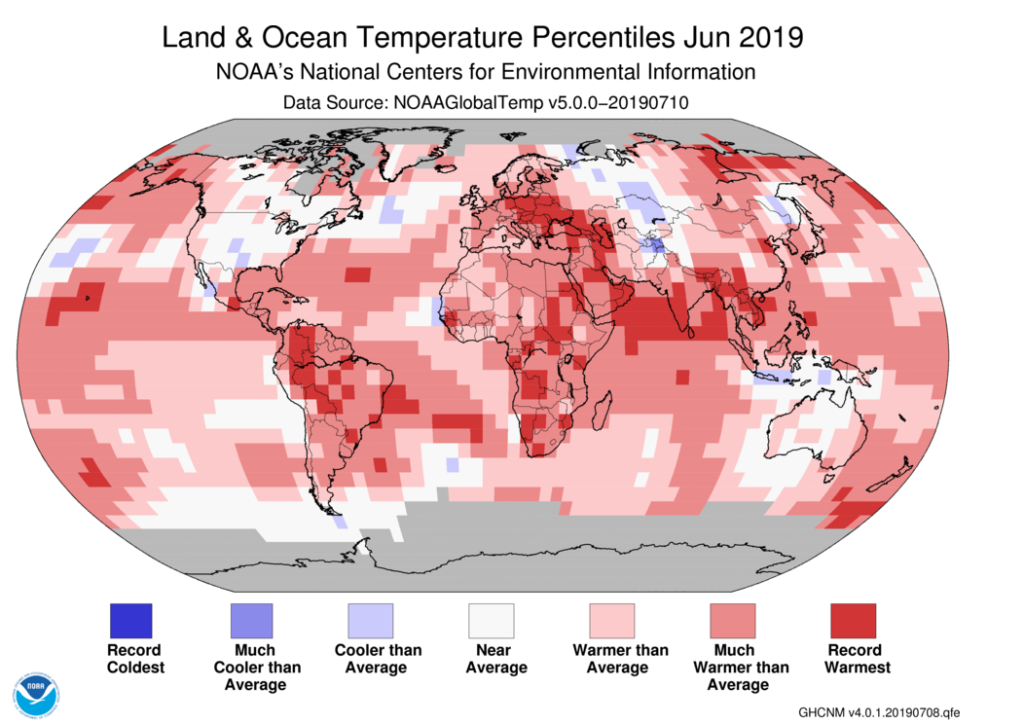
NOAA offered the following synopsis of the global climate for June 2019.
- The month of June was characterized by warmer-than-average temperatures across much of the world. The most notable warm June 2019 temperature departures from average were observed across central and eastern Europe, northern Russia, northeastern Canada, and southern parts of South America.
- Averaged as a whole, the June 2019 global land and ocean temperature departure from average was the highest for June since global records began in 1880.
- Nine of the 10 warmest Junes have occurred since 2010.
For more details, see the online June 2019 Global Climate Reportat the following link:
https://www.ncdc.noaa.gov/sotc/global/201906
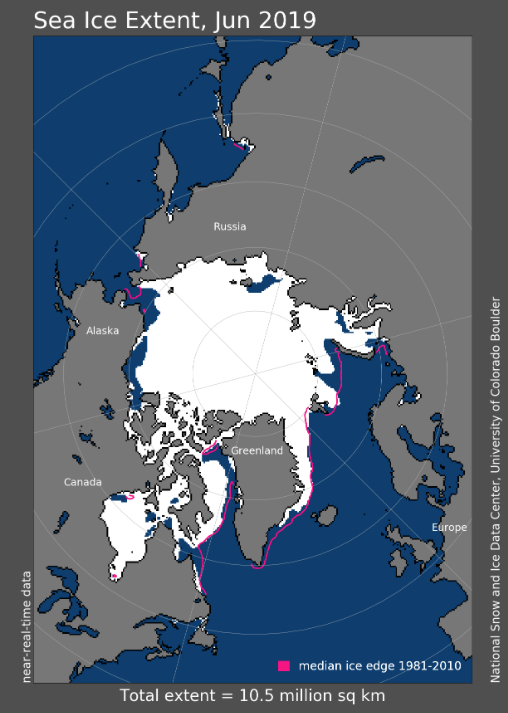
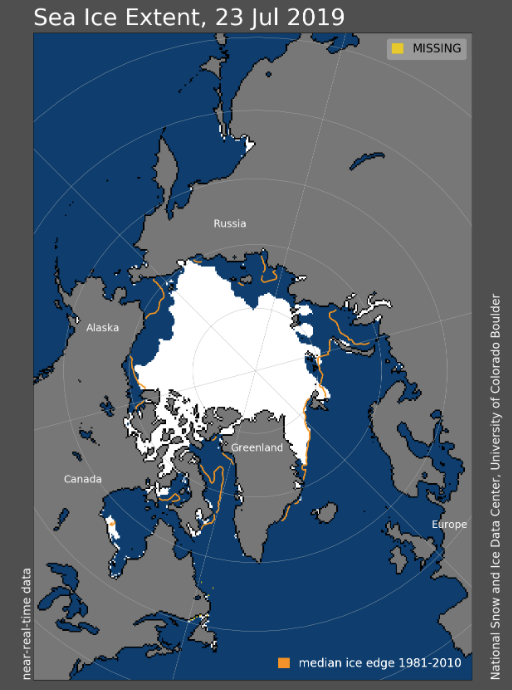
A complementary NOAA climate data resource is the National Snow & Ice Data Center’s (NSIDC’s) Sea Ice Index, which provides monthly and daily quick looks at Arctic-wide and Antarctic-wide changes in sea ice. It is a source for consistently processed ice extent and concentration images and data values since 1979. Maps show sea ice extent with an outline of the 30-year (1981-2010) median extent for the corresponding month or day. Other maps show sea ice concentration and anomalies and trends in concentration. In addition, there are several tools you can use on this website to animate a series of monthly images or to compare anomalies or trends. You’ll find the Sea Ice Index here:
https://nsidc.org/data/seaice_index/
The Arctic sea ice extent for June 2019 and the latest daily results for 23 July 2019 are shown in the following graphics, which show the rapid shrinkage of the ice pack during the Arctic summer. NOAA reported that the June 2019 Arctic sea ice extent was 10.5% below the 30-year (1981 – 2010) average. This is the second smallest June Arctic sea ice extent since satellite records began in 1979.
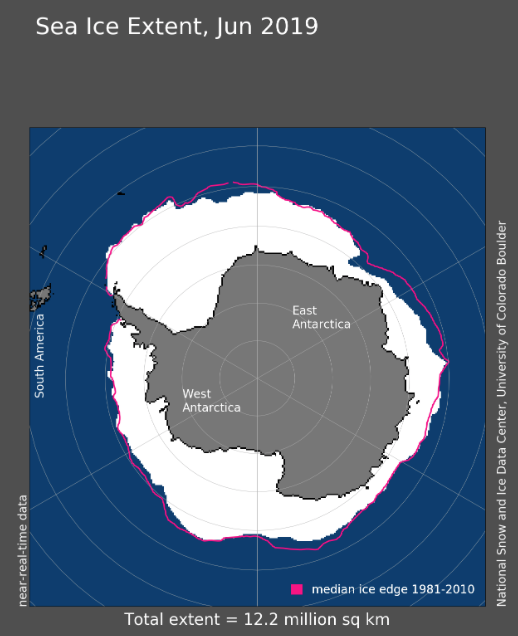
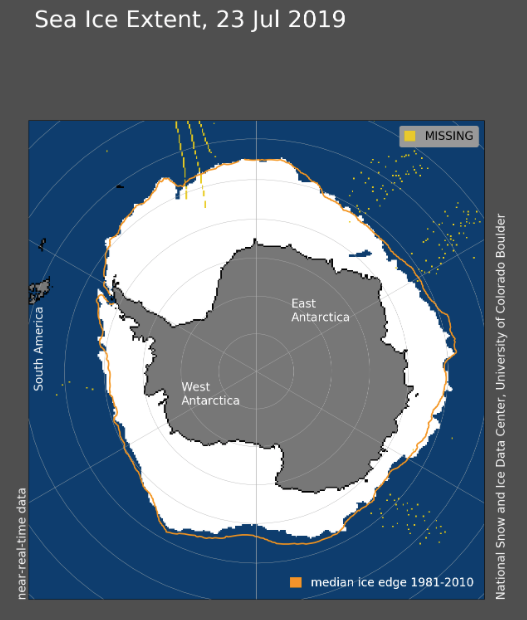
The monthly Antarctic results for June 2019 and the latest daily results for 23 July 2019 are shown in the following graphics, which show the growth of the Antarctic ice pack during the southern winter season. NOAA reported that the June 2019 Antarctic sea ice extent was 8.5% below the 30-year (1981 – 2010) average. This is the smallest June Antarctic sea ice extent on record.
I hope you enjoy exploring NOAA’s “State of the Climate” collection of monthly summaries.