Peter Lobner
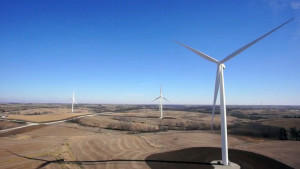
MidAmerican Energy Company, Iowa’s largest energy company, began installing wind turbines in 2004. In May 2013, MidAmerican Energy announced their latest plan to invest up to $1.9 billion to expand its wind generation fleet and add up to 1,050 MWe of wind generation in Iowa by year-end 2015. Once this expansion is complete, approximately 3,335 MWe, or approximately 39%, of MidAmerican Energy’s total owned generation capacity will come from wind-powered generation from 1,715 wind turbines.
You can visit the wind energy page on the MidAmerica Energy website at the following link:
http://www.midamericanenergy.com/wind_overview.aspx
Fact sheets on this site provide details on the two types of wind turbines currently being installed:
- 1.5 MWe General Electric wind turbine (most common in the MidAmerica fleet)
- 2.3 MWe Siemens wind turbine (largest in the MidAmerica fleet)
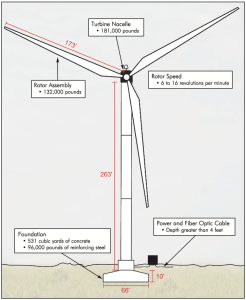
The impressive dimensions of the larger Siemens machine are shown in the following diagram:
MidAmerican Energy Company has posted a 5+ minute time-lapse video on YouTube showing their three-week construction process for the Siemens wind turbine. This is worth watching to get a better understanding of the modest site preparation work required, the very large scale of the pedestal and rotor components, and the short time frame required to complete a wind turbine generator and have it ready to be put into revenue-generating service. You can view the video at the following link:
https://www.youtube.com/embed/84BeVq2Jm88?feature=player_detailpage
Now complete this process several hundred times and you have a respectable sized wind farm.
The U.S. Energy Information Administration (EIA) defines “capacity factor” as follows:
“Capacity factors describe how intensively a fleet of generators is run. A capacity factor near 100% means a fleet is operating nearly all of the time. It is the ratio of a fleet’s actual generation to its maximum potential generation”.
EIA reports average monthly and annual capacity factors for utility generators. For utility generators not primarily using fossil fuels, the results are at the following link:
http://www.eia.gov/electricity/monthly/epm_table_grapher.cfm?t=epmt_6_07_b
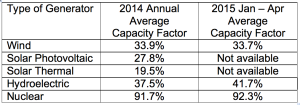
Here are average capacity factors reported by EIA:
As a renewable power source, wind has a significantly higher capacity factor than solar. However, over the long term, a wind farm delivers only about one-third of it’s “nameplate rating.” This statistic, of course, does not capture the real-time variability in electrical output as wind conditions constantly change.
As a point of comparison, you can find the EIA capacity factor results for utility generators primarily using fossil fuels at the following link:
http://www.eia.gov/electricity/monthly/epm_table_grapher.cfm?t=epmt_6_07_a
Here are average capacity factors reported by EIA for selected fossil generators (I only included those that are likely to be base loaded):


