Peter Lobner
On 16 July 1945, the Manhattan Project team successfully detonated the “The Gadget”, which was an implosion-type plutonium fission device similar in design to the Fat Man bomb detonated less than a month later over Nagasaki, Japan.
Various measurements were made to determine the yield of “The Gadget”. The best estimates are that the total yield of the test device was 21 kT, with 15 kT coming from plutonium fission and 6 kT coming from fast fissions in the natural uranium tamper. You can read more on the yield estimates at the following link:
http://blog.nuclearsecrecy.com/2014/11/10/fat-mans-uranium/
You also can read more details on the Trinity site and the test in a fact sheet prepared by the Defense Threat Reduction Agency, which you will find at the following link:
http://www.webcitation.org/6VDXaYUBL
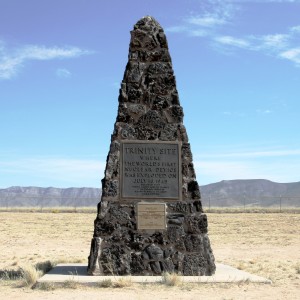
Today, the Trinity Site is part of the White Sands Missile Range. This site was declared a National Historic Landmark in 1965 and is marked by the Trinity Site Obelisk National Historical Landmark. Currently the site is open to visitors only on two days of the year, the first Saturday in April and October. No reservations are required. Check the White Sands Missile Range website for the latest information:
http://www.wsmr.army.mil/PAO/Trinity/Pages/default.aspx
You can read an account of a 2006 visit to Trinity Site at the following link:
http://www.takemytrip.com/06newmex/06_15a.htm
Together, the nuclear bombings of Hiroshima, on 6 August 1945, and Nagasaki, on 9 August 1945, are credited with bringing an end to World War II. Japan announced its surrender on 15 August 1945 and formally signed the surrender documents on 2 September 1945.
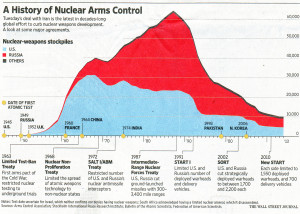
The Trinity test and the nuclear bombing of Japan also marked the start of a nuclear arms race, initially between the U.S. and the Soviet Union, but soon followed by other nations wishing to be nuclear powers: U.K, France, China, India, Pakistan and North Korea. The history of the worldwide nuclear weapons stockpiles and related arms control treaties is presented well in the following graphic from the Wall Street Journal. I’m hoping that Iran doesn’t show up as a new yellow dot on a future edition of that chart.

