Peter Lobner
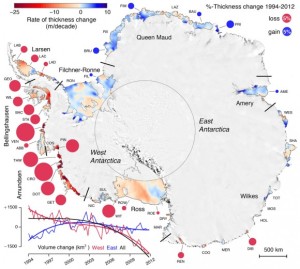
A new study of the Antarctic ice shelf by Scripps Institution of Oceanography and University of California San Diego presents, for the first time, high-resolution maps (about 30 km by 30 km) of ice thickness changes at three-month time steps during the 18-year period from 1994 – 2012. This data set has allowed scientists to quantify how the rate of thinning varies at different parts of the same ice shelf during a given year, and between different years.
The report was accepted on 11 March 2015 for publication in Science. The abstract reads as follows:
The floating ice shelves surrounding the Antarctic Ice Sheet restrain the grounded ice-sheet flow. Thinning of an ice shelf reduces this effect, leading to an increase in ice discharge to the ocean. Using eighteen years of continuous satellite radar altimeter observations we have computed decadal-scale changes in ice-shelf thickness around the Antarctic continent. Overall, average ice-shelf volume change accelerated from negligible loss at 25 ± 64 km3 per year for 1994-2003 to rapid loss of 310 ± 74 km3 per year for 2003-2012. West Antarctic losses increased by 70% in the last decade, and earlier volume gain by East Antarctic ice shelves ceased. In the Amundsen and Bellingshausen regions, some ice shelves have lost up to 18% of their thickness in less than two decades.
An overview of the results of this study is shown in the following map by Scripps Institution of Oceanography and UCSD.
You can read more about this study at the following link:
To see what’s happening to the Arctic ice sheet, check out the 23 March 2015 Pete’s Lynx posting, “2014 – 2015 Arctic sea ice maximum extent was lowest yet recorded.”
