Peter Lobner
Background on the oil and gas industry
In a 2013 report by the American Petroleum Institute (API) and PricewaterhouseCoopers (PwC) entitled, “Economic Impacts of the Oil and Natural Gas Industry on the US Economy in 2011,” it was reported that:
“Counting direct, indirect, and induced impacts, the industry’s total impact on labor income (including proprietors’ income) was $598 billion, or 6.3 percent of national labor income in 2011. The industry’s total impact on US GDP (gross domestic product) was $1.2 trillion, accounting for 8.0 percent of the national total in 2011.”
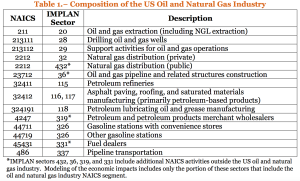
Table 1 of this report, which is reproduced below, defines the scope of the U.S. oil and natural gas industry included in this analysis.
In the table footnote you can see that the API – PwC economic assessment was limited to the oil and gas industry itself, and their results did not include the economic value of the many downstream businesses whose operations are dependent on one or more of the various products delivered by the oil and gas industry (i.e., plastic and synthetic material manufacturers, airlines, trucking, power plants, etc.). If we counted the economic values of these oil and/or gas dependent businesses, then the overall contribution of the oil and gas industry to the U.S. economy would be significantly higher than stated in the API – PwC report. You can get this report at the following link:
http://www.api.org/~/media/Files/Policy/Jobs/Economic_Impacts_ONG_2011.pdf
U.S. oil and gas pipeline infrastructure
Pipeline systems are a key element of the oil and gas industry infrastructure, enabling timely and efficient transportation of the following products:
- Crude oil
- Petroleum products from crude oil and other liquids processed at refineries, including transportation fuels, fuel oils for heating and electricity generation, asphalt and road oil, and various feedstocks for making chemicals, plastics, and synthetic materials
- Hydrocarbon gas liquids (HGL), including natural gas liquids (paraffins or alkanes) and olefins (alkenes) produced by natural gas processing plants, fractionators, crude oil refineries, and condensate splitters, but excluding liquefied natural gas (LNG) and aromatics
- Natural gas
The U.S. has over 200,000 miles of liquids pipelines that, in 2014, transported 16.2 billion barrels of crude oil, petroleum products and HGL. More than 17,000 miles of liquid pipelines were added to the network in the five-year period from 2010 thru 2014. The U.S. has over 300,000 miles of interstate and intrastate natural gas transmission pipelines. That’s adds up to more than a half million miles of major oil and gas pipelines in the U.S.
Most pipelines are installed underground, with pumping / compressor stations at grade level. The Trans-Alaska pipeline system is a notable exception, with its above-grade pipeline in permafrost regions.
The U.S. Energy Information Agency (EIA) maintains the U.S. Energy Mapping System, which is a geographic information system (GIS) that can display a great deal of energy infrastructure information. The user can select the map area to be viewed, the map style, and the data to be displayed on the map. Once you’ve created the map of your choice, you can zoom and scroll to explore map details. You can access the U.S. Energy Mapping System at the following link:
https://www.eia.gov/state/maps.cfm
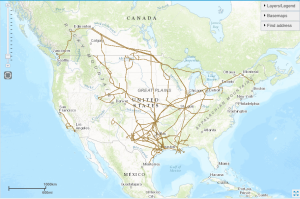
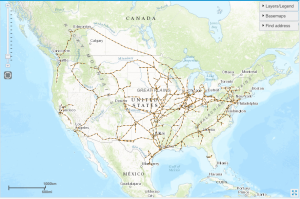
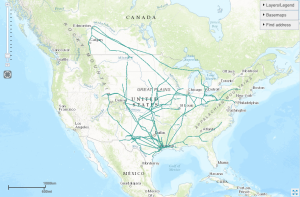
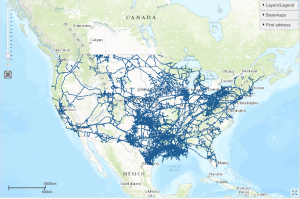
The following maps prepared using the U.S. Energy Mapping System show the distribution of oil and gas pipeline systems in the U.S. (except Alaska & Hawaii) and Canada. The source of pipeline mileage data is the Pipeline and Hazardous Material Safety Administration (PHMSA). The source of liquid capacity data is the Association of Oil Pipe Lines (AOPL).
Crude oil pipelines:
- 73,300 miles of interstate and intrastate pipelines in 2015 (PHMSA)
- Delivered 9.3 billion barrels (bbl) of crude oil nationwide in 2014 (AOPL)
Petroleum product pipelines:
- 62,588 miles of interstate and intrastate pipelines in 2015 (PHMSA)
- The petroleum product pipelines and the HGL pipelines together delivered 6.9 billion barrels (bbl) of products nationwide in 2014 (AOPL).
HGL (natural gas liquids) pipelines:
- 67,577 miles of interstate and intrastate pipelines in 2015 (PHMSA)
Natural gas pipelines:
- 2,509,000 total miles of natural gas pipelines in 2015 (PHMSA)
- 301,242 miles of interstate and intrastate transmission pipelines
- 1.28 million miles of gas distribution main lines (smaller than the transmission pipelines)
- 913,085 miles of gas distribution service lines
- 17,727 miles of gathering mains that collect gas from wells and move it through a series of compression stages to the main transmission pipelines
- Natural gas transmission pipeline capacity was approximately 443 billion cubic feet per day in 2011 (QER 1.1)
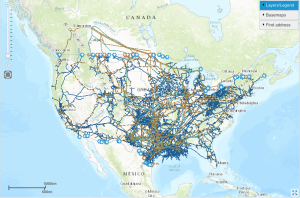
All of the above maps combined, including international border crossings:
The high density of pipeline systems in many parts of the nation is evident in the last map. On the EIA’s U.S. Energy Mapping System website, you can recreate and explore any of the above maps.
Pipeline safety
The Department of Transportation’s (DOT) Pipeline and Hazardous Material Safety Administration (PHMSA), acting through the Office of Pipeline Safety (OPS), administers the DOT national regulatory program to assure the safe transportation of natural gas, petroleum, and other hazardous materials by pipeline.
PHMSA has collected pipeline incident reports since 1970. PHMSA defines “significant incidents” as any of the following conditions that originate within the pipeline system (but not initiated by a nearby external event that affects the pipeline system).
- Fatality or injury requiring in-patient hospitalization
- $50,000 or more in total costs, measured in 1984 dollars
- Highly volatile liquid releases of 5 barrels (210 gallons) or more, or other liquid releases of 50 barrels (2,100 gallons) or more
- Liquid releases resulting in an unintentional fire or explosion
PHMSA data are available at the following link:
http://www.phmsa.dot.gov/pipeline/library/data-stats
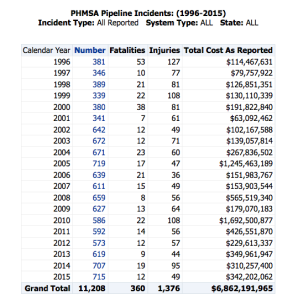
A summary of all reported pipeline incidents over the past 20 years is presented in the following PHMSA table.
The 20-year averages (1996 – 2015) are:
- Incidents: 560
- Fatalities: 18
- Injuries: 69
- Total cost: $343,109,598
The latest data for 2016 (possibly not final) are:
- Incidents: 620
- Fatalities: 17
- Injuries: 82
- Total cost: $275,341,057
Clearly, the oil and gas pipeline business is quite hazardous, and the economic cost of pipeline incidents is very high, even in an average year. Since the mid-1990s, the number of incidents per year has almost doubled (367 average for 1996 – 2000 vs. 641 average for 2011 – 2015) as has the total cost per year ($128.4 million average for 1996 – 2000 vs. $331.6 million average for 2011 – 2015).
In June 2015, Jonathan Thompson posted the article, “Mapping 7 Million Gallons of Crude Oil Spills,” on the High Country News website, at the following link:
http://www.hcn.org/articles/spilling-oil-santa-barbara/print_view
In this article, High Country News mapped the last five years of PHMSA data, which included more than 1,000 crude oil pipeline leaks and ruptures. Key points made in the High Country News article are
- Over the five-year period, 168,000 barrels (more than 7 million gallons) of crude oil were spilled as a result of reported incidents. That’s an average of about 1.4 million gallons (33,600 barrels) per year leaking or spilled from 73,300 miles of crude oil pipelines that delivered 3 billion barrels of oil annually in 2014. That annualized amount of leakage also is equivalent to the amount of oil carried in about 47 DOT-111 rail cars.
- Commonly reported causes included poor material condition (corrosion, bad seals), weather (heavy rains, lightning), and human error (valves being left open, people puncturing pipelines while digging).
- Many of the spills were small, releasing less than 10 barrels (420 gallons) of oil, but a few were much larger. For example, a 2013 lightning strike on a North Dakota pipeline caused a 20,000-barrel (840,000 gallon) leak.
Cleanup after these spills and leaks is included in the PHMSA total cost data.
Aging infrastructure
Is August 2014, Jordan Wirfs-Brock posted the article, “Half Century Old Pipelines Carry Oil and Gas Load,” on the Inside Energy (IE) website at the following link:
http://insideenergy.org/2014/08/01/half-century-old-pipelines-carry-oil-and-gas-load/
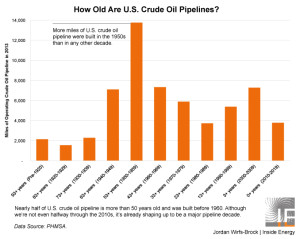
Using PHMSA data, the author mapped the age of the U.S. pipeline infrastructure and determined that, “About forty-five percent of U.S. crude oil pipeline is more than fifty years old.” The following chart shows the age distribution of U.S. crude oil pipelines.
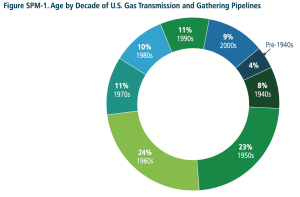
In April 2015 Administration issued the First Installment of the Quadrennial Energy Review (QER 1.1). This report included the following chart showing the age distribution of U.S. natural gas transmission and gathering pipelines. It looks like more than 50% of these natural gas pipelines are more than 50 years old.
Source: QER 1.1 Summary
The high percentage of older pipeline systems places the overall integrity, reliability and safety of the critical national pipeline infrastructure at risk.
Pipeline modernization
In a previous post, I described the Quadrennial Energy Review (QER) initiated by the Obama Administration in January 2014. The first QER report, QER 1.1, released in April 2015, provides a good overview of issues related to oil and gas pipeline system risks and opportunities to modernize this critical infrastructure.
One positive step was taken on 16 April 2015 by the Federal Energy Regulatory Commission (FERC) when it announced a new policy, Cost Recovery Mechanisms for Modernization of Natural Gas Facilities. This policy sets conditions for interstate natural gas pipeline operators to recover certain safety, environmental, or reliability capital expenditures made to modernize pipeline system infrastructure.
Given the scale of the national oil and gas pipeline infrastructure, and the age of significant portions of that infrastructure, it will take decades of investment to implement system-wide modernization. The political climate, economic climate, and maybe the stars need to be in alignment for this enormous, long-term modernization effort to deliver the needed results.
