Peter Lobner
In the last month, there have been reports of some very unexpected things happening under the surface of the earth. I’m talking about subduction plates that maintain their structure as they dive toward the Earth’s core and “jet streams” in the Earth’s core itself. Let’s take a look at these interesting phenomena.
What happens to subduction plates?
Oceanic tectonic plates are formed as magma wells up along mid-ocean ridges, forming new lithospheric rock that spread away from both sides of the ridge, building two different tectonic plates. This is known as a divergent plate boundary.
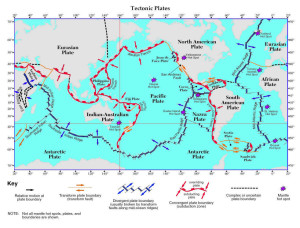
As tectonic plates move slowly across the Earth’s surface, each one moves differently than the adjacent plates. In simple terms, this relative motion at the plate interfaces is either a slipping, side-by-side (transform) motion, or a head-to-head (convergent) motion.
A map of the Earth showing the tectonic plates and the nature of the relative motion at the plate interfaces is shown below (click on the image to enlarge).
Source: http://www.regentsearth.com/
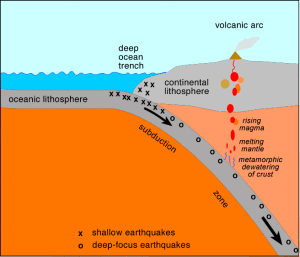
When two tectonic plate converge, one will sink under (subduct) the other. In the case of an oceanic plate converging with a continental plate, the heavier oceanic plate always sinks under the continental plate and may cause mountain building along the edge of the continental plate. When two oceanic plates converge, one will subduct the other, creating a deep mid-ocean trench (i.e., Mariana trench) and possibly forming an arc of islands on the overriding plate (i.e., Aleutian Islands and south Pacific island chains). In the diagram above, you can see that some subduction zones are quite long.
 Source: http://www.columbia.edu/~vjd1/subd_zone_basic.htm
The above diagram shows the subducting material from an oceanic plate descending deep into the Earth beneath the overriding continental plate. New research indicates that the subducting plates maintain their structure to a considerable depth below the surface of the Earth.
On 22 November 2016, an article by Paul Voosen, “’Atlas of the Underworld’ reveals oceans and mountains lost to Earth’s history,” was posted on the sciencemag.org website. The author reports:
“A team of Dutch scientists will announce a catalog of 100 subducted plates, with information about their age, size, and related surface rock records, based on their own tomographic model and cross-checks with other published studies.”
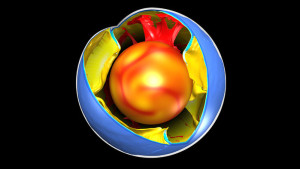
“…geoscientists have begun ….peering into the mantel itself, using earthquake waves that pass through Earth’s interior to generate images resembling computerized tomography (CT) scans. In the past few years, improvements in these tomographic techniques have revealed many of these cold, thick slabs as they free fall in slow motion to their ultimate graveyard—heaps of rock sitting just above Earth’s molten core, 2900 kilometers below.”
The following concept drawing illustrates how a CT scan of the whole Earth might look, with curtains of subducting material surrounding the molten core.
 Source: Science / Fabio Crameri
The author notes that research teams around the world are using more than 20 different models to interpret similar tomographic data. As you might expect, results differ. However, a few points are consistent:
- The subducting slabs in the upper mantle appear to be stiff, straight curtains of lithospheric rock
- These slabs may flex but they don’t crumble.
- These two features make it possible to “unwind” the geologic history of individual tectonic slabs and develop a better understanding of the route each slab took to its present location.
- The geologic history in subducting slabs only stretches back about 250 million years, which is the time it takes for subducting material to fall from the surface to the bottom of the mantle and be fully recycled.
You can read the fill article by Paul Voosen at the following link:
http://www.sciencemag.org/news/2016/11/atlas-underworld-reveals-oceans-and-mountains-lost-earths-history
Hopefully, the “Atlas of the Underworld” will help focus the dialogue among international research teams toward collaborative efforts to improve and standardize the processes and models for building an integrated CT model of our Earth.
A “jet stream” in the Earth’s core
The European Space Agency (ESA) developed the Swarm satellites to make highly accurate and frequent measurements of Earth’s continuously changing magnetic field, with the goal of developing new insights into our planet’s formation, dynamics and environment. The three-satellite Swarm mission was launched on 22 November 2013.
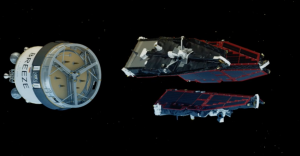 Swarm satellites separating from Russian booster. Source: ESA
ESA’s website for the Swarm mission is at the following link:
http://www.esa.int/Our_Activities/Observing_the_Earth/Swarm/From_core_to_crust
Here ESA explains the value of the measurements made by the Swarm satellites.
“One of the very few ways of probing Earth’s liquid core is to measure the magnetic field it creates and how it changes over time. Since variations in the field directly reflect the flow of fluid in the outermost core, new information from Swarm will further our understanding of the physics and dynamics of Earth’s stormy heart.
The continuous changes in the core field that result in motion of the magnetic poles and reversals are important for the study of Earth’s lithosphere, also known as the ‘crustal’ field, which has induced and remnant magnetized parts. The latter depend on the magnetic properties of the sub-surface rock and the history of Earth’s core field.
We can therefore learn more about the history of the magnetic field and geological activity by studying magnetism in Earth’s crust. As new oceanic crust is created through volcanic activity, iron-rich minerals in the upwelling magma are oriented to magnetic north at the time.
These magnetic stripes are evidence of pole reversals so analyzing the magnetic imprints of the ocean floor allows past core field changes to be reconstructed and also helps to investigate tectonic plate motion.”
Data from the Swarm satellites indicates that the liquid iron part of the Earth’s core has an internal, 420 km (261 miles) wide “jet stream” circling the core at high latitude at a current speed of about 40 km/year (25 miles/year) and accelerating. In geologic terms, this “jet stream” is significantly faster than typical large scale flows in the core. The basic geometry of this “jet stream” is shown in the following diagram.
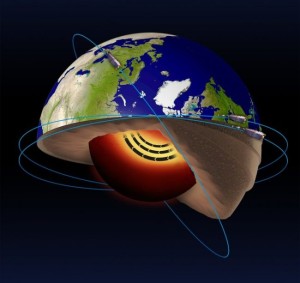 Source: ESA
These results were published on 19 December 2016 in the article, “An accelerating high-latitude jet in Earth’s core,” on the Nature Geoscience website at the following link:
http://www.nature.com/ngeo/journal/vaop/ncurrent/full/ngeo2859.html
A subscription is required for access to the full paper.
The Swarm mission is ongoing. Watch the ESA’s mission website for more news.
