Peter Lobner
In my 12 April 2016 post, “Landing a Reusable Booster Rocket on a Dime,” I discussed the first successful flights and recoveries of the SpaceX Falcon 9 orbital booster rocket and Blue Origin’s New Shepard suborbital booster rocket. In the past year, both SpaceX and Blue Origin have successfully launched and recovered several rockets. In addition, SpaceX and Blue Origin both have reused one or more booster rockets that were flown on previous missions.
Here’s a quick look at the SpaceX and Blue Origin track records and their future plans for even more ambitious recoverable launch vehicles. We’ll also take a brief look at what competitors are doing with their existing and planned launch vehicles.
SpaceX reusable booster rockets: Falcon 9 v1.2, Falcon Heavy, and Interplanetary Transport System
The Falcon 9 v1.2 is the current, operational version of this commercial, medium-lift, two-stage family of launch vehicles. This booster has a length of 230 ft (70 m) with the payload fairing and a booster diameter of 12 ft (3.66 m). The first stage generates 1.7 million pounds of thrust from seven Merlin engines burning liquid oxygen (LOX) and RP-1 kerosene. The second stage uses a single Merlin engine optimized for vacuum conditions. The Falcon 9 v1.2 specified payload mass is:
- 50,265 pounds (22.8 metric tons, 22,800 kg) to Low Earth Orbit (LEO),
- 18,298 pounds (8.3 metric tons, 8,300 kg) to Geosynchronous Transfer Orbit (GTO), or
- 8,862 pounds (4.02 metric tons, 4,020 kg) to escape velocity.
Falcon Heavy is an advanced heavy-lift, two-stage launch vehicle with a first stage comprised of three Falcon 9 booster rockets. The first stage generates 5.1 million pounds of thrust from 21 Merlin engines. The Falcon Heavy specified payload mass is:
- 119,931 pounds (54.4 metric tons, 54,400 kg) to LEO,
- 48,942 pounds (22.2 metric tons, 22,200 kg) to GTO, or
- 29,983 pounds (13.6 metric tons, 13,600) kg to escape velocity.
The first Falcon Heavy is expected to be launched in late 2017.
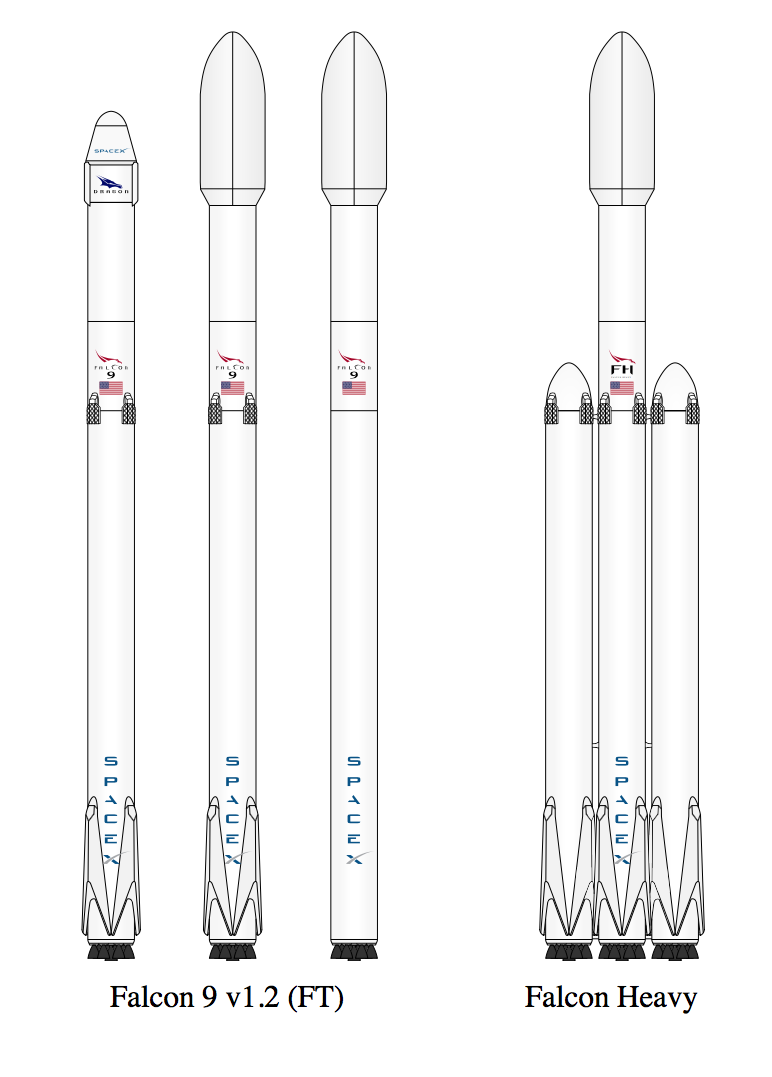
The Falcon 9 v1.2 family and the Falcon Heavy launch vehicles are shown in the following diagram. The scale-up from Falcon 9 V1.2 to Falcon Heavy is relatively straightforward. Versions designed for recovering the first stage include four extendable landing legs near the base of the rocket. In the diagram below, you can see that one version of the Falcon 9 does not include the landing legs, sacrificing booster recovery for greater booster performance.
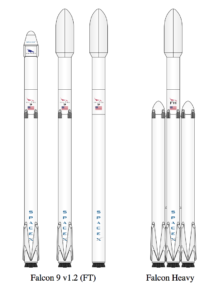 Source: SpaceX
SpaceX describes their Falcon 9 booster recovery process as follows:
“After being jettisoned, the first stage (autonomously) initiates a flip maneuver and begins a powered return back to Earth. Using a combination of reaction control thrusters, forward-mounted grid fins, and thrust from one to three of the main engines, the first stage flies either to a remotely-operated ship in the Atlantic (or Pacific) Ocean, or to land. Upon arrival, the vehicle deploys a set of landing legs and sets itself down upright.”
In practice, SpaceX expects to recover about 1/3 of its boosters on land, back near the launch site. Boosters for most of the remaining missions (primarily the higher-energy missions) will be recovered on a downrange drone ship. You can watch a short video explaining these two mission profiles at the following link:
https://www.youtube.com/watch?v=lEr9cPpuAx8
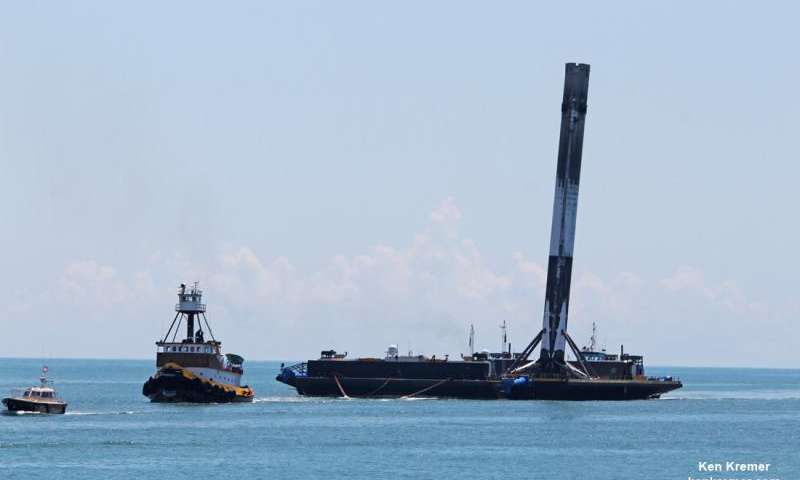
A recovered Falcon 9 first stage booster rocket is very large:
- overall length of about 151 ft (46 m) in landing configuration,
- dry mass is about 50,706 pounds (23,000 kg), and
- estimated total mass is 94,578 pounds (42,900 kg) with 5% residual fuel after landing.
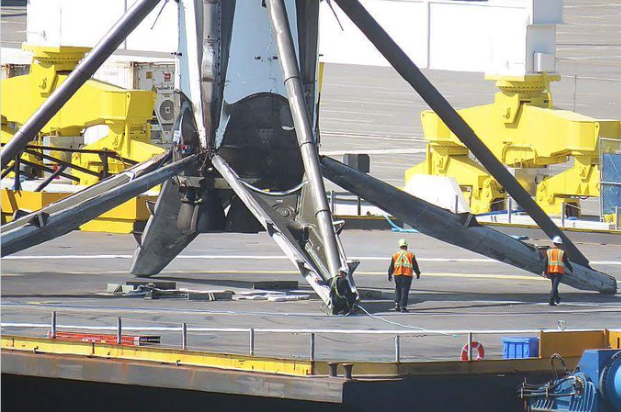
The large scale of the Falcon 9 booster is apparent in the following photo taken after a landing on the stationary drone ship.
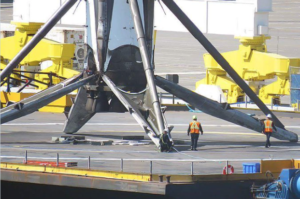 Source: SpaceX
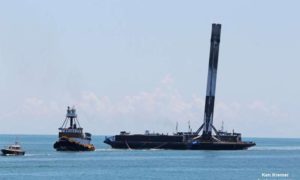 Source: Ken Kremer/kenkremer.com
You can see a video of the January 2017 Falcon 9 v1.2 launch and booster recovery at the following link:
https://www.youtube.com/watch?v=c8wy5sQ2JDE
The SpaceX mission on 30 March 2017 marked two important milestones:
- The first reuse of a Falcon 9 booster stage, which was recovered on the drone barge and will be available again for reuse.
- The first recovery of the costly (about $6 million) payload fairing, which was jettisoned during ascent and returned under parachute for an ocean splashdown. The payload fairing will be reused.
As of 3 April 2017, the SpaceX Falcon 9 scorecard is:
- Thirteen booster recoveries attempted
- Three successful recoveries on land; first in December 2015
- Six successful recoveries on a drone ship at sea, first in April 2016
- Four drone ship recovery failures
- One booster stage reused
The number of times a Falcon 9 first stage can be re-flown is not clearly specified. However, Elon Musk placed that number at 10 – 20 additional missions, and, with minor refurbishment, up to 100 missions.
Falcon Heavy missions will involve considerably more complex, simultaneous, autonomous booster recovery operations. The port and starboard Falcon 9 boosters will separate first and fly to designated recovery points, likely on land. The core booster will burn longer before separating from the second stage, which will take the payload into orbit. After separation, the core Falcon 9 booster also will fly to a designated recovery point, likely on a downrange drone ship. After a Falcon Heavy launch, it literally will be raining Falcon 9 boosters. This will be a spectacular demonstration of autonomous flight control and range safety.
You’ll find a list of Falcon 9 and Falcon Heavy launches, booster recovery status, and future missions at the following link:
https://en.wikipedia.org/wiki/List_of_Falcon_9_and_Falcon_Heavy_launches
SpaceX has been developing the recoverable Dragon space capsule as a family of spacecraft to be launched by the Falcon booster to conduct a variety of orbital and interplanetary missions. Like the recoverable Falcon booster, the Dragon capsule uses aerodynamic forces to slow its descent into the atmosphere and rocket propulsion for the final landing phase.
- Dragon CRS: Since October 2012, this unmanned cargo version of the Dragon space capsule has been conducting Commercial Resupply Service (CRS) missions to the International Space Station (ISS) and returning cargo to Earth.
- Dragon CRS “free-flyer”: The Dragon capsule also can operate independently in Earth orbit carrying a variety of payloads and returning them to Earth.
- Dragon 2: This is a human-rated version of the Dragon space capsule. The first manned orbital flight in expected 2018.
- Red Dragon: This is an unmanned version of Dragon 2 adapted for a mission to Mars and launched by a Falcon Heavy. Red Dragon is designed to make a propulsive landing on Mars’ surface with a 2,200 pound (1,000 kg) payload. The first launch of a Red Dragon mission could occur as early as 2018. Thereafter, SpaceX plans to conduct “regular “ (as suitable launch windows occur) Red Dragon missions to Mars.
The SpaceX Interplanetary Transport System (ITS) is a concept for an enormous launch vehicle, a manned interplanetary spacecraft, and a tanker spacecraft for refueling the interplanetary spacecraft in Earth orbit before starting the interplanetary phase of the mission. ITS will enable transportation of a large crew and equipment to Mars starting in the late 2020s. Later, when propellant plants have been established on distant bodies in the solar system, the ITS interplanetary spacecraft will be able to refuel in deep space and journey beyond Mars. The ITS is “conceptualized to be fully reusable with 1,000 uses per booster, 100 uses per tanker and 12 round trips to Mars with one spacecraft over a period of over 25 years.”
As shown in the following diagram, the ITS booster rocket carrying the interplanetary spacecraft is much larger than the National Aeronautics and Space Administration’s (NASA) Saturn V used in the 1960s and 1970s on the Apollo lunar missions. At launch, the ITS will be 400 ft (122 m) tall and 39.4 ft (12 m) in diameter.
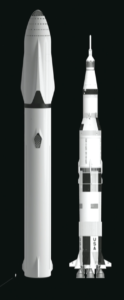 ITS & Saturn V. Source: SpaceX
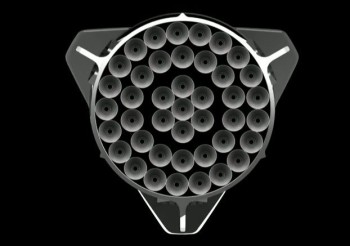
With 42 Raptor sub-cooled liquid methane / liquid oxygen engines, the first stage will have a liftoff thrust of about 26 million pounds, which is more than three times the thrust of Saturn V. This engine configuration is reminiscent of the Soviet N-1 moon rocket, (circa late 1960s), which clustered 30 engines in a similar configuration.
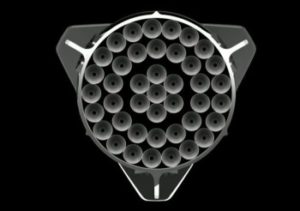 ITS 1st stage Raptor engines. Source: SpaceX
The ITS specified payload mass is:
- 1 million pounds (500 metric tons, 500,000 kg) to LEO with a fully expendable booster, or
- 661,000 pounds (300 metric tons, 300,000 kg) to LEO with a reusable booster
ITS can lift ten times the payload of the Falcon Heavy booster.
The first stage of the ITS launch vehicle will be designed to fly back to the launch site for rapid servicing and reuse (i.e., to launch the refueling tanker spacecraft). In landing configuration, the ITS booster stage will be about 254 ft (77.5 m) long with a dry mass of about 275 tons (25 metric tons, 250,000 kg).
You can watch Elon Musk’s briefing on the ITS concept, including a short video of the ITS launch and interplanetary mission profile, at the following link.
http://www.spacex.com/mars
Can you spell A M B I T I O U S? The SpaceX ITS concept certainly is ambitious, but it offers a much more compelling vision of future manned spaceflight than anything NASA has offered over the past decade.
Blue Origin reusable booster rockets: New Shepard and New Glenn
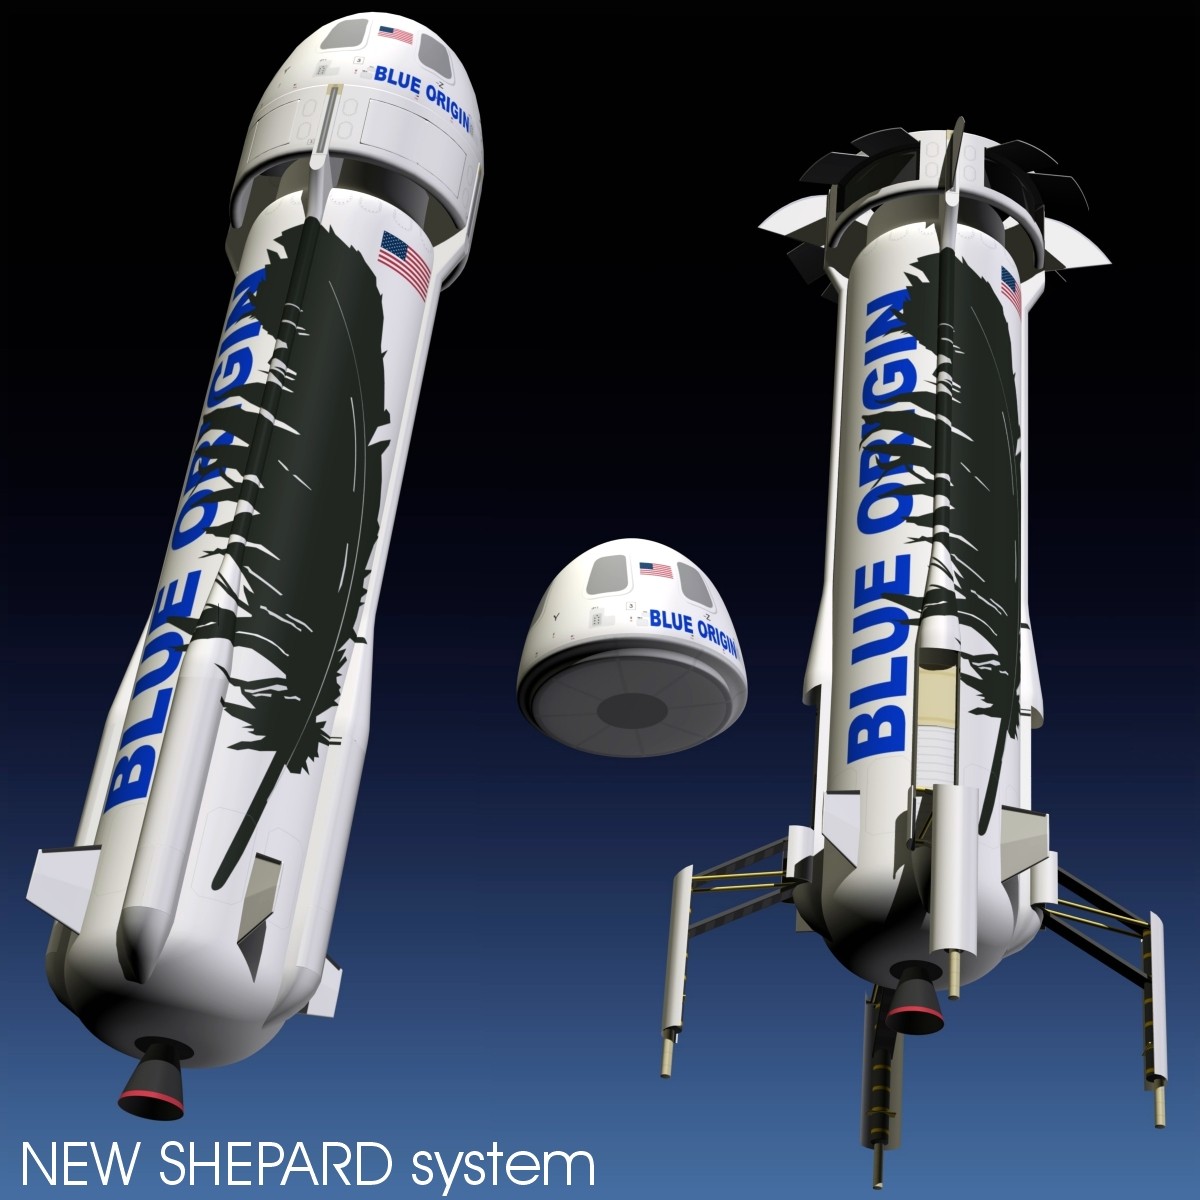
New Shepard is a small, single stage, suborbital rocket intended for research and commercial passenger service to the fringe of space, above the Karman line at 62 miles (330,000 ft, 100 km) above the Earth. New Shepard is named for Project Mercury astronaut Alan Shepard, who, on 5 May 1961, made the first U.S. suborbital flight in the Freedom 7 capsule launched from Cape Canaveral by a Redstone rocket. The New Shepard, in launch and recovery configurations, is shown in the following figure.
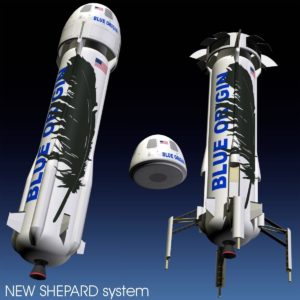 Source: https://www.stlfinder.com/3dmodels/Besos
You can see a short video showing the June 2016 fourth launch and recovery of the New Shepard booster and capsule at the following link:
https://www.youtube.com/watch?v=nNRs2gMyLLk
As of 3 April 2017, the New Shepard scorecard is:
- Six booster recoveries attempted
- Five successful recoveries on land; first in November 2015
- One booster recovery failure
- One booster stage recovered and used five times
In all of these New Shepard unmanned test flights, the passenger capsule was recovered.
Blue Origin expects to conduct the first manned tests of New Shepard in late 2017. Commercial passenger flights, with up to six people in the space capsule, could begin in 2018. Blue Origin has stated that they may be able to conduct as many as 50 New Shepard flights per year.
You’ll find a list of New Shepard launches and booster recovery status, at the following link:
https://en.wikipedia.org/wiki/Blue_Origin
On 29 March 2017, the National Aeronautic Association (NAA) announced that it selected Blue Origin New Shepard to receive the prestigious 2016 Robert J. Collier Trophy. The award reads:
“… for successfully demonstrating rocket booster reusability with the New Shepard human spaceflight vehicle through five successful test flights of a single booster and engine, all of which performed powered vertical landings on Earth.”
You can read the complete NAA press release at the following link:
https://naa.aero/userfiles/files/documents/Press%20Releases/Collier%20Trophy%202016.pdf
On 12 September 2016, Jeff Bezos announced Blue Origin’s plans to develop New Glenn, which is a very large, heavy-lift, 2- or 3-stage reusable launch vehicle. New Glenn is named for Project Mercury astronaut John Glenn, who, on 20 February 1962, became the first U.S. astronaut to reach orbit. John Glenn flew in the Friendship 7 capsule launched from Cape Canaveral by an Atlas rocket.
The size of New Glenn is apparent n the following diagram. The two-stage version will be 270 ft (82 m) tall, and the three-stage version will be 313 ft (95 m) tall, approaching the size of NASA’s Saturn V.
 Source: Blue Origin
The New Glenn first stage is powered by seven BE-4 methane / LOX engines rated at a combined 3.85 million pounds of thrust (about ½ of the Saturn V), the second stage is powered by a single BE-4 engine optimized for vacuum conditions and rated at 550,000 pounds of thrust, and the third stage is powered by one BE-3 liquid hydrogen / LOX engine rated at 110,000 pounds thrust. The BE-4 engines in the reusable first stage are designed with a 100-flight lifetime.
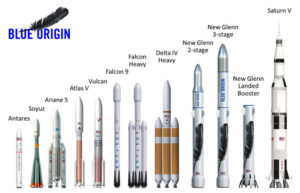
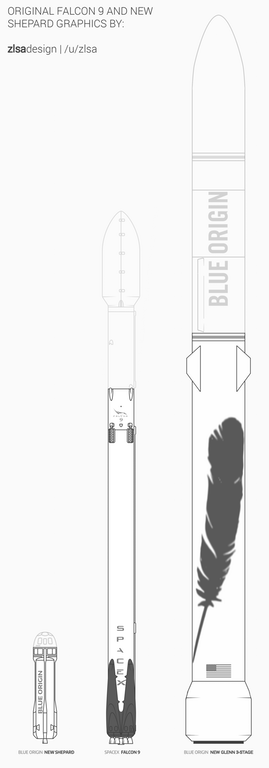
A more detailed size comparison between New Shepard, Falcon 9 and New Glenn is shown in the following diagram.
 Source: zisadesign I /u/zisa
The scale-up from New Shepard, which is not yet operational, to New Glenn is tremendous. The specified payload mass for the two-stage version of New Glenn is:
- 99,000 pounds (45 metric tons, 45,000 kg) to LEO,
- 29,000 pounds (13 metric tons, 13,000 kg) to GTO
The three-stage New Glenn will carry heavier payloads.
The first stage of the New Glenn booster is being designed to fly to a designated landing site to be recovered. Aerodynamic surfaces on the first stage will give New Glenn more aerodynamic maneuvering capability than the SpaceX Falcon during the descent to landing. On 7 March 2017, Jeff Bezos gave the following details on the recovery of the first stage.
“Those aerodynamic surfaces allow us to operate with very high availability in very high wind conditions……..We don’t want to constrain the availability of launch based on the availability of the landing of the reusable booster. We put a lot of effort into letting the vehicle fly back with aerodynamic surface control instead of with propulsion.”
Of course, rocket propulsion is needed for the final phase of landing on a large, moving platform at sea. The first stage has six extendable landing legs, and can land safely if only five deploy.
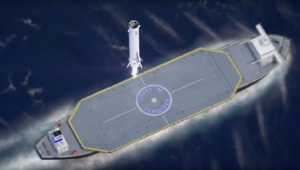 New Glenn landing. Source: Blue Origin
You’ll find a short animated video showing the launch and recovery process for New Glenn at the following link:
https://www.blueorigin.com/#youtubeBTEhohh6eYk
New Glenn flights are expected to start in 2020, about three years after the first SpaceX Falcon Heavy flight.
What are other launch vehicle competitors doing?
No other operational or planned launch vehicles offer the extent of reusability found in the SpaceX Falcon and ITS and the Blue Origin New Shepard and New Glenn. The following launch vehicles will offer only partial reusability.
NASA: partially-reusable Space Launch System (SLS)
NASA is developing the SLS to launch heavy payloads into Earth orbit and to launch the Orion manned spacecraft on a variety of near-Earth and deep space missions. As shown in the following diagram, the SLS booster rocket has a large, liquid-fueled, two-stage core flanked by two large solid rocket boosters manufactured by Orbital ATK.
SLS is designed to put 150,000 to 290,000 pounds (70,000 to 130,000 kg) into LEO.
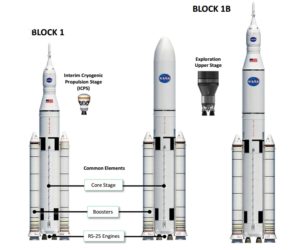 SLS launch vehicle: Source: NASA
As with the NASA Space Shuttle, the solid rocket boosters are designed to be recovered and reused. However, the liquid-fueled first stage booster is expendable; not designed for reuse.
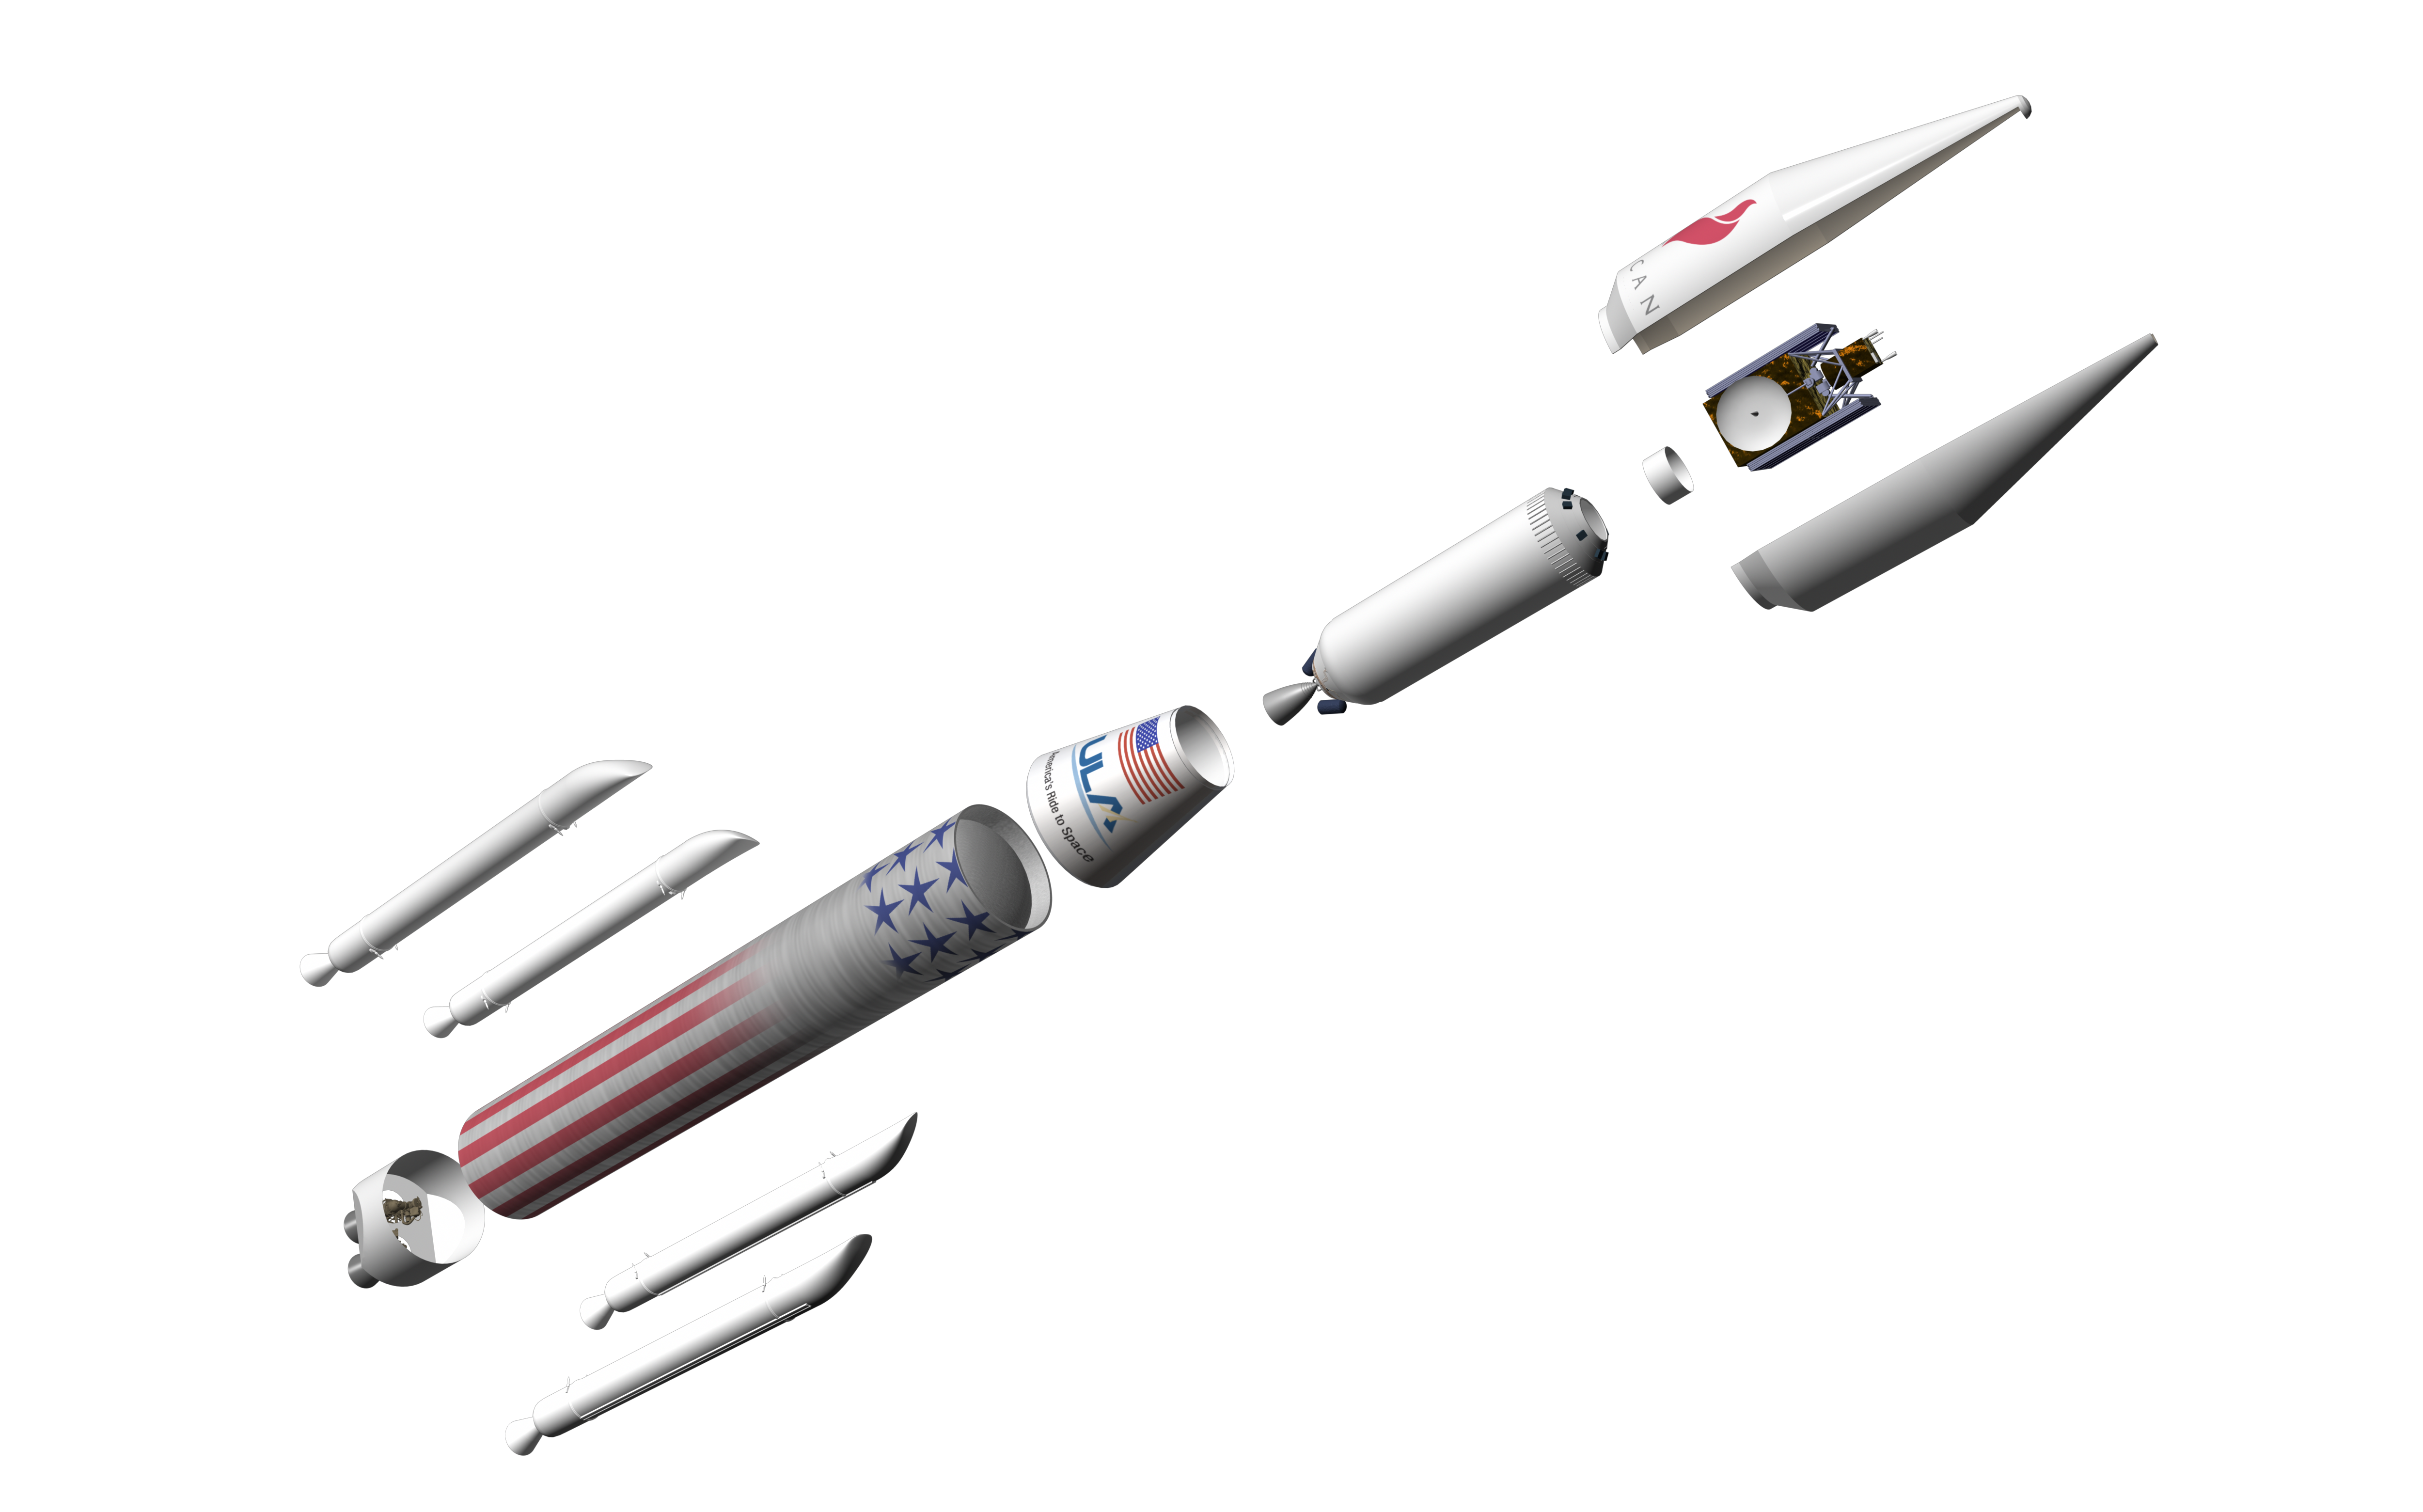
United Launch Alliance (ULA): partially-reusable Vulcan
ULA currently provides medium- and heavy-lift launch with the expendable Atlas V, Delta III and Delta IV boosters. In April 2015, ULA announced that they were developing Vulcan as their Next-Generation Launch System (NGLS) to support a wide variety of Earth-orbital and interplanetary missions. In August 2016, ULA announced plans to qualify Vulcan for manned space missions.
As shown in the following diagram, Vulcan is comprised of a liquid-fueled, two-stage core rocket that can be augmented with up to six solid rocket boosters as needed for the specific mission. This basic architecture is quite similar to ULA’s current Delta III booster, but on a larger scale.
Vulcan launch vehicle. Source: ULA
Vulcan’s maximum payload capacity is expected to fall between ULA’s current Atlas V and Delta IV boosters. ULA expects that “bare bones” Vulcan launch services will sell for half the price of an Atlas V, which is less costly to fly than the Delta IV.
The Vulcan first stage is not designed to be recovered as a unit and reused like the SpaceX Falcon. Instead, ULA is planning a future version that will be partially reusable. In this version, the engines will be designed to detach from the booster after engine cutoff, descend through the atmosphere inside a heat shield, and deploy a parachute for final descent and recovery.
European Space Agency (ESA): expendable Ariane 5 & partially-reusable Ariane 6
ESA’s current Ariane 5 medium- to heavy-lift booster has a two-stage, liquid-fueled core rocket flanked by two large solid rocket boosters. The basic configuration of Ariane 5 is shown in the following diagram. Ariane V is an expendable booster, not designed for reuse.
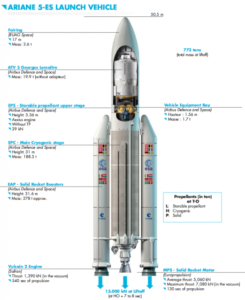
Ariane 5. Source: Arianespace
Ariane 5 first flew in June 1996 and has been employed on a wide variety of Earth orbital and interplanetary missions. Versions of Ariane 5 can deliver a payload of more than 44,000 pounds (20,000 kg) to LEO or 23,100 pounds (10,735 kg) to GTO.
In 2014, ESA announced the basic configuration of the Ariane 6 launch vehicle. Like Ariane 5, Arian 6 will have a two-stage, liquid-fueled core rocket flanked by solid rocket boosters.
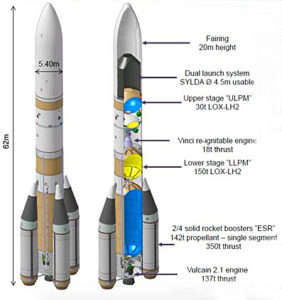 Ariane 6. Source: adapted from BBC
Two versions are being developed:
- Ariane 62, with two solid rocket boosters capable of launching about 11,000 pounds (5,000 kg) to GTO
- Ariane 64, with four solid rocket boosters capable of launching about 24,000 pounds (11,000 kg) to GTO
Ariane 62 and 64 are expendable boosters, not designed for reuse.
In 2015, Airbus Defense and Space announced plans to develop a partially reusable first stage named Adeline that could enter service on a future version of Ariane 6 in the 2025 – 2030 time frame. Like ULA’s plans for Vulcan, only the Ariane 6 first stage high-value parts (i.e., the engine) would be recovered for reuse.
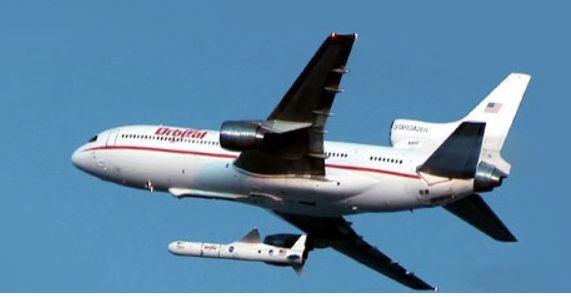
Stratolaunch Systems: giant aircraft plus potentially reusable, air-launched rocket booster
Paul Allen’s firm Stratolaunch Systems is building what will become the world’s largest aircraft, for use as an airborne launch platform for a variety of booster rockets that will take small-to-medium payloads into Earth orbit. The Stratolaunch Carrier will have two fuselages, six jet engines, a length of 238 feet (72 m), and a wingspan of 385 feet (117 m). The giant plane is designed to carry a rocket and payload with a combined weight of up to 550,000 pounds (250,000 kg) to a launch altitude of about 30,000 ft (9,144 m). Payloads up to 13,500 pounds (6,136 kg) can be delivered to LEO. The Stratolaunch Carrier can fly more than 1,000 miles to reach the launch point, giving it unprecedented operational flexibility for delivering payloads to orbit. An example mission profile is shown in the following figure.
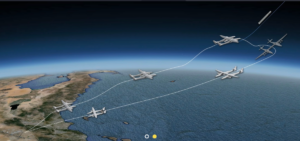 Source: Stratolaunch
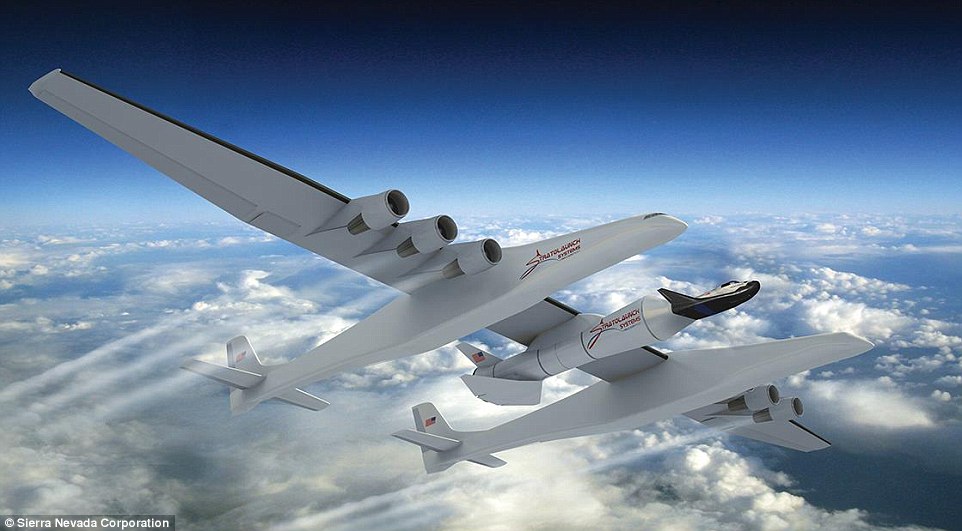
In 2014, Sierra Nevada Corporation (SNC) announced that it planned to use Stratolaunch as the launch platform for a scaled version of its Dream Chaser reusable spacecraft, initially for unmanned missions and later for manned missions with up to three astronauts. As shown in the following concept drawing, Dream Chaser appears to mounted on a winged, recoverable booster rocket. For more information on the Dream Chaser reusable spacecraft, visit the SNC website at the following link:
https://www.sncorp.com
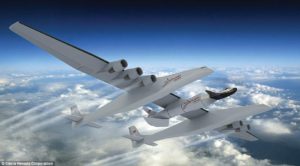 Stratolauncher Carrier with Dream Chaser. Source: Sierra Nevada
In 2014, a planned partnership between Stratolaunch Systems and SpaceX for an air-dropped version of the Falcon booster failed to materialize. In October 2016, Stratolaunch announced a partnership with Orbital ATK, which will provide Pegasus XL expendable boosters for use in launching small satellites into Earth orbit from the Stratolaunch aircraft.
The Stratolaunch Carrier was reported to be 76% complete in 2016. Stratolaunch Systems expects the aircraft to be operational by the end of this decade. You’ll find more information on Stratolaunch here:
http://www.stratolaunch.com
Other launch systems
You’ll find a list of worldwide orbital launch systems at the following link. Most of these are expendable launch systems.
https://en.wikipedia.org/wiki/List_of_orbital_launch_systems
A comparison of these orbital launch systems is available here:
https://en.wikipedia.org/wiki/Comparison_of_orbital_launch_systems
Not included in the above list is the new Next Generation Launch (NGL) System announced by Orbital ATK on 6 April 2017. Two versions of this new, expendable, three-stage booster will be developed to handle medium-to-large payloads, roughly comparable to the payload capability of the SpaceX Falcon 9 reusable booster. The first two stages of the NGL System will be solid fueled. First flight is planned for 2021. You’ll find a fact sheet on the NGL system at the following link:
http://www.orbitalatk.com/flight-systems/space-launch-vehicles/NGL/docs/BR17001_3862%20NGL_Final%20and%20Approved.pdf
In conclusion
In the highly competitive launch vehicle market, booster reusability should yield a significant economic advantage. In the long run, demonstrating better launch service economies will determine the success or failure of reusable launch vehicles.
While SpaceX and Blue Origin have demonstrated the technical ability to recover and reuse the first stage of a launch vehicle, they have not yet demonstrated the long-term economic value of that capability. In 2017, SpaceX plans to re-fly about six Falcon 9 v1.2 boosters, with even more recycled boosters to be launched in 2018. Blue Origin will likely start New Shepard passenger flights in 2018.
I’m betting that SpaceX and Blue Origin will be successful and reusable boosters will find a permanent role in reducing the price for delivering cargo and people into space.

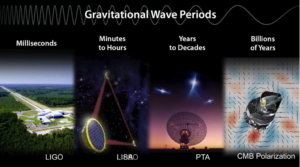 Source: screenshot from Kip Thorne / Walter Issacson interview at:
 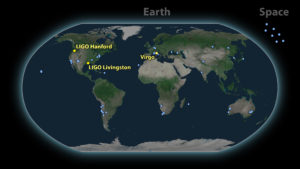 Source: LIGO – VIRGO,
 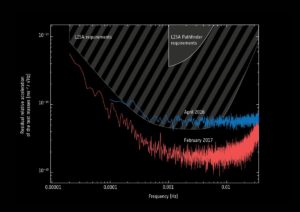 Source: ESA, https://www.elisascience.org/
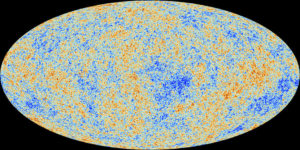 Planck all-sky survey. Source; ESA / Planck Collaboration


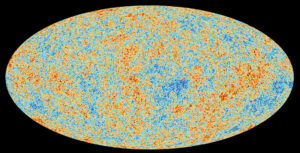 Planck all-sky survey 2013 CBM temperature map shows anisotropies in the temperature of the CMB at the full resolution obtained by Planck. Source: ESA / Planck Collaboration
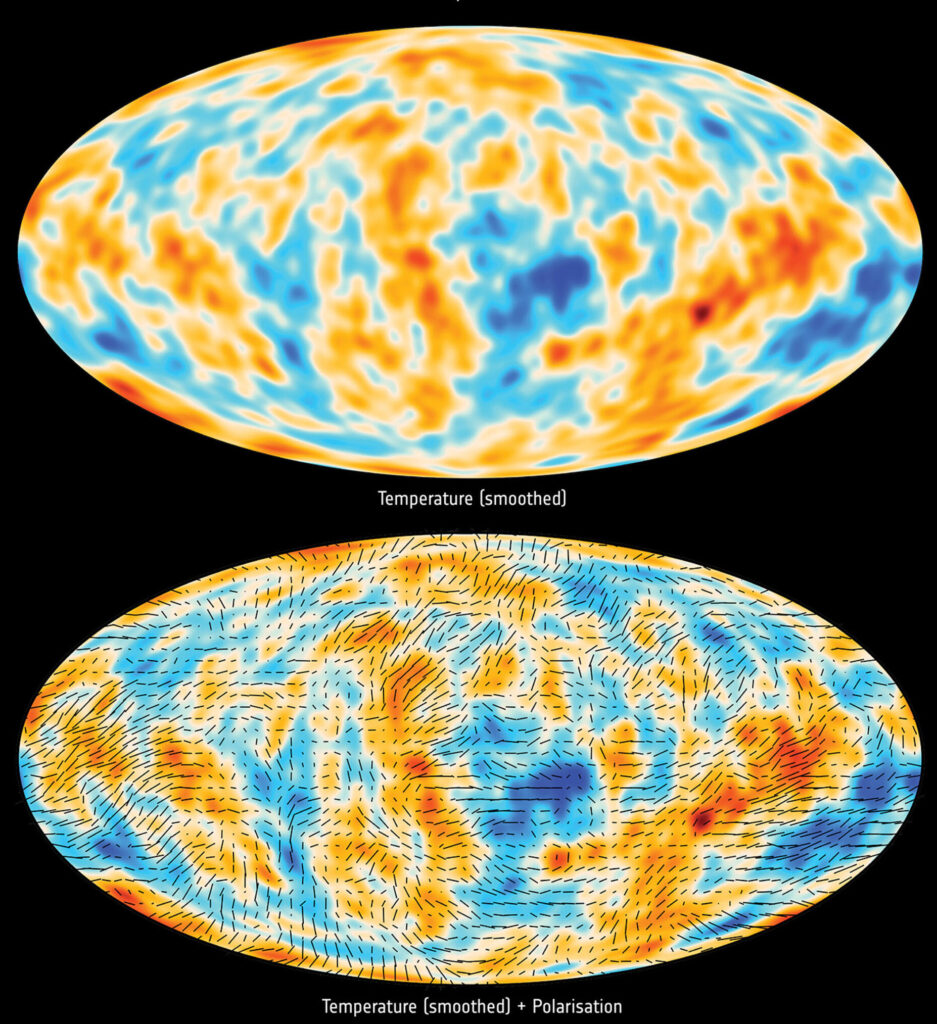