Peter Lobner
The National Aeronautics and Space Administration’s (NASA) Goddard Institute for Space Studies (GISS) released the results of an analysis by NASA and National Oceanic and Atmospheric Administration (NOAA) that showed that globally-averaged temperature in 2015 was the highest since modern record keeping began in 1880. You can read the NOAA / NASA press release at the following link:
http://www.giss.nasa.gov/research/news/20160120/
You can download a copy of the more detailed NOAA / NASA briefing at the following link:
http://www.giss.nasa.gov/research/news/20160120/noaa_nasa_global_analysis_2015.pdf
The analysis shows that globally-averaged temperature in 2015 exceeded the previous mark set in 2014 by 0.23 degrees Fahrenheit (0.13 degrees Celsius) and continued a warming trend, as shown in the following graph.
 Source: NASA Goddard
In this graph, the zero on the y-axis is the average temperature for a 30-year period from 1951 to 1980. The trend lines show results for El Niño years (orange), La Niña years (blue), and all years (dashed line). The 2015 globally-averaged temperature was:
- 57° F (0.87° C) above the 1951 to 1980 30-year (baseline) average, and
- 62° F (0.90° C) above the 1901 to 2000 100-year (20th century) average
The distribution of global temperatures relative to the 1951 – 80 baseline is shown in the following charts.

 Source, both graphics: NOAA / NASA Annual Global Analysis for 2015
The NOAA / NASA press release cited above includes an animation that helps visualize Earth’s long-term warming trend based on data from 1880 to 2015. NOAA / NASA note that phenomena such as El Niño or La Niña, which warm or cool the tropical Pacific Ocean, can contribute to short-term variations in global average temperature. A warming El Niño was in effect for most of 2015
The full 2015 surface temperature data set and the complete methodology used by NOAA / NASA in their analysis are available to the public on the GISS Surface Temperature Analysis (GISTEMP) webpage at the following link:
http://data.giss.nasa.gov/gistemp/
The availability of the data and the analytical methodology allows the NOAA / NASA results to be subject to independent scrutiny. I commend NOAA and NASA for their openness in this matter, which will aid in reaching scientific consensus on the NOAA / NASA results.
This behavior by NOAA / NASA is a stark contrast to the United Nations (UN) Intergovernmental Panel on Climate Change (IPCC), which has failed to provide full public access to their underlying data and analytical methodologies and has been criticized for failing to rigorously apply the scientific method in their work. To help understand why the IPCC claim of “scientific consensus” is without merit, the Nongovernmental International Panel on Climate Change (NIPCC) published the book, “Why Scientists Disagree About Global Warming,” on 30 November 2015. You can download this document for free at the following link:
https://www.heartland.org/policy-documents/why-scientists-disagree-about-global-warming
To help put this in perspective, I thank cartoonist Wiley Miller for the following timely and insightful cartoon published on 20 January 2016. I challenge you to apply this cartoon to your understanding of the climate change debate.
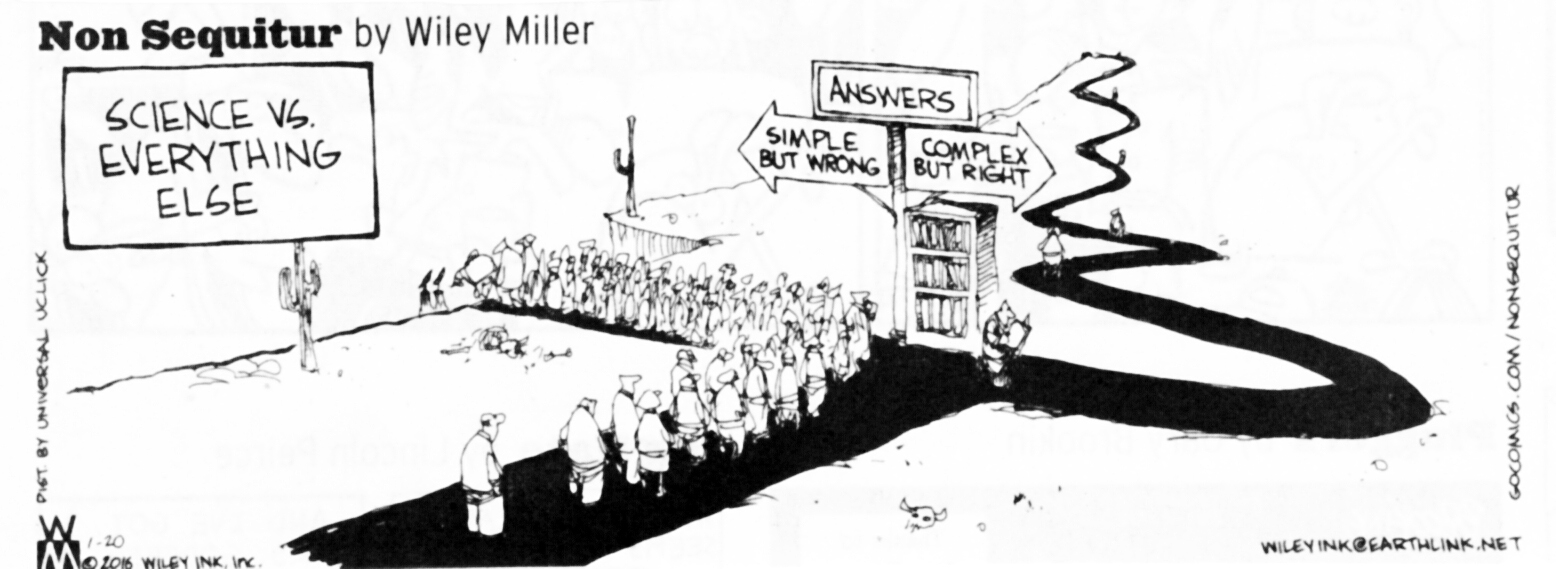 Source: San Diego Union Tribune