Tag Archives: Multi-messenger

NASA’s Sonification Project Makes the Universe Audible

Peter Lobner, updated 6 September 2024

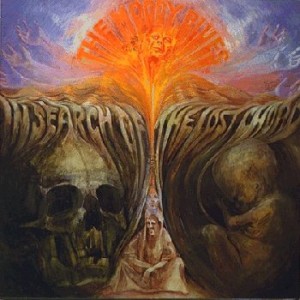
In my 2016 post, “Remarkable Multispectral View of Our Milky Way Galaxy, “ I started by recalling the following lyrics from the 1968 Moody Blues song, “The Word,” by Graeme, Edge, from the album “In Search of the Lost Chord”:

This garden universe vibrates complete

Some, we get a sound so sweet

Vibrations reach on up to become light

And then through gamma, out of sight

Between the eyes and ears there lie

The sounds of color and the light of a sigh

And to hear the sun, what a thing to believe

But it’s all around if we could but perceive

To know ultraviolet, infrared and X-rays

Beauty to find in so many ways.

Well, NASA actually has done this thru their Sonification Project, which they explain as follows:

“Much of our Universe is too distant for anyone to visit in person, but we can still explore it. Telescopes give us a chance to understand what objects in our Universe are like in different types of light. By translating the inherently digital data (in the form of ones and zeroes) captured by telescopes in space into images, astronomers can create visual representations of what would otherwise be invisible to us. But what about experiencing these data with other senses, like hearing? Sonification is the process that translates data into sound. Our new project brings parts of our Milky Way galaxy, and of the greater Universe beyond it, to listeners for the first time. We take actual observational data from telescopes like NASA’s Chandra X-ray Observatory, Hubble Space Telescope or James Webb Space Telescope and translate it into corresponding frequencies that can be heard by the human ear.”

I hope you’ll enjoy NASA’s ” Universe of Sound” website, which includes sonifications of more than 20 astronomical targets, each with descriptions of the target and details on how the sonification was made. Start your audio exploration of the Milky Way galaxy and the Universe beyond here: https://chandra.si.edu/sound/

Good luck trying to pick a favorite.

Many of NASA’s sonifications also are available individually on YouTube. Here are two very different samples:

In September 2024, NASA released sonifications of three new images to mark the 25th anniversary of Chandra’s “First Light” image. Check out the story and enjoy the new sonifications here: https://www.nasa.gov/missions/chandra/new-nasa-sonifications-listen-to-the-universes-past/

For more information

Remarkable Multispectral View of Our Milky Way Galaxy

Peter Lobner, updated 18 August 2023

Moody Blues cover - In search of the lost chordAlbum Album cover art credit: Deram Records

Some of you may recall the following lyrics from the 1968 Moody Blues song, “The Word,” by Graeme, Edge, from the album “In Search of the Lost Chord”:

This garden universe vibrates complete

Some, we get a sound so sweet

 Vibrations reach on up to become light

And then through gamma, out of sight

Between the eyes and ears there lie

The sounds of color and the light of a sigh

And to hear the sun, what a thing to believe

But it’s all around if we could but perceive

 To know ultraviolet, infrared and X-rays

Beauty to find in so many ways

On 24 February 2016, the European Southern Observatory (ESO) Consortium announced that it has completed the ATLASGAL Survey of the Milky Way. The survey mapped the entire galactic plane visible from the southern hemisphere at sub-millimeter wavelengths, between infrared light and radio waves, using the Atacama Pathfinder EXperiment (APEX) telescope located at 5,100 meters (16,732 ft.) above sea level in Chile’s Atacama region. The southern sky is particularly important because it includes the galactic center of our Milky Way. The Milky Way in the northern sky has already been mapped by the James Clerk Maxwell Telescope, which is a sub-millimeter wavelength telescope at the Mauna Kea Observatory in Hawaii.

The new ATLASGAL maps cover an area of sky 140 degrees long and 3 degrees wide. ESO stated that these are the sharpest maps yet made, and they complement those from other land-based and space-based observatories. The principal space-based observatories are the following:

  • European Space Agency’s (ESA) Plank satellite: Mission on-going, mapping anisotropies of the cosmic microwave background at microwave and infrared frequencies.
  • ESA’s Herschel Space Observatory: Mission on-going, conducting sky surveys in the far-infrared and sub-millimeter frequencies.
  • National Aeronautics and Space Administration (NASA) Spitzer Space Telescope: Mission on-going, conducting infrared observations and mapping as described in my 1 April 2015 post.
  • NASA’s Hubble Space Telescope: Mission on-going, observing and mapping at ultraviolet, optical, and infrared frequencies.
  • NASA’s Chandra X-Ray Observatory: Mission on-going, observing and mapping X-ray sources.
  • NASA’s Compton Gamma Ray Observatory: Mission ended in 2000. Observed and mapped gamma ray and x-ray sources.

ESO reported that the combination of Planck and APEX data allowed astronomers to detect emission spread over a larger area of sky and to estimate from it the fraction of dense gas in the inner galaxy. The ATLASGAL data were also used to create a complete census of cold and massive clouds where new generations of stars are forming.

You can read the ESO press release at the following link:

https://www.eso.org/public/news/eso1606/

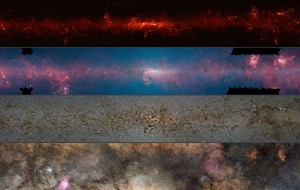
Below is a composite ESO photograph that shows the same central region of the Milky Way observed at different wavelengths.

ESO Multispectral view of Milky WaySource: ESO/ATLASGAL consortium/NASA/GLIMPSE consortium/VVV Survey/ESA/Planck/D. Minniti/S. Guisard. Acknowledgement: Ignacio Toledo, Martin Kornmesser

  • The top panel shows compact sources of sub-millimeter radiation detected by APEX as part of the ATLASGAL survey, combined with complementary data from ESA’s Planck satellite, to capture more extended features.
  • The second panel shows the same region as seen in shorter, infrared wavelengths by the NASA Spitzer Space Telescope
  • The third panel shows the same part of sky again at even shorter wavelengths, the near-infrared, as seen by ESO’s VISTA infrared survey telescope at the Paranal Observatory in Chile. Regions appearing as dark dust tendrils in the third panel show up brightly in the ATLASGAL view (top panel).
  • The bottom panel shows the more familiar view in visible light, where most of the more distant structures are hidden from view

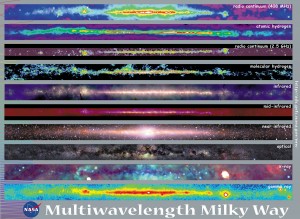
NASA’s Goddard Space Flight Center also  created a multispectral view of the Milky Way, which  is shown in the following composite photograph of the same central region of the Milky Way observed at different wavelengths.

NASA Goddard multispectralSource: NASA Goddard Space Flight Center

Starting from the top, the ten panels in the NASA image cover the following wavelengths.

  • Radio frequency (408 MHz)
  • Atomic hydrogen
  • Radio frequency (2.5 GHz)
  • Molecular hydrogen
  • Infrared
  • Mid-infrared
  • Near-infrared
  • Optical
  • X-ray
  • Gamma ray

The Moody Blues song, “The Word,” ends with the following lyrics:

 Two notes of the chord, that’s our full scope

But to reach the chord is our life’s hope

And to name the chord is important to some

So they give it a word, and the word is “Om”

While “Om” (pronounced or hummed “ahh-ummmm”) traditionally is a sacred mantra of Hindu, Jain and Buddhist religions, it also may be the mantra of astronomers as they unravel new secrets of the Milky Way and, more broadly, the Universe. I suspect that completing the ATLASGAL Survey of the Milky Way was an “Om” moment for the many participants in the ESO Consortium effort.

For more information