Tag Archives: Chandra X-Ray Observatory

Webb Space Telescope Provides an Extraordinary View of the Planet Neptune

Peter Lobner

In April 2021, I posted a short article entitled, “Multi-messenger Astronomy Provides Extraordinary Views of Uranus,” which included two composite views of Uranus, created by combining near-infrared images taken by the Keck-1 telescope at an elevation of 4,145 meters (13,599 ft) on Maunakea, Hawaii, with X-ray images taken with the Advanced CCD Imaging Spectrometer (ACIS) aboard the orbiting Chandra X-Ray Observatory.

Now, the Webb Space Telescope has taken stunning near-infrared images of the next, and outermost, planet in our solar system, Neptune (sorry, Pluto). You can read NASA’s 21 September 2022 news release on these images here: https://www.nasa.gov/feature/goddard/2022/new-webb-image-captures-clearest-view-of-neptune-s-rings-in-decades

The Webb images of Neptune, taken on July 12, 2022, are reproduced below.

NASA: “Webb captured seven of Neptune’s 14 known moons: Galatea, Naiad, Thalassa, Despina, Proteus, Larissa, and Triton. Neptune’s large and unusual moon, Triton, dominates this Webb portrait of Neptune as a very bright point of light sporting the signature diffraction spikes seen in many of Webb’s images.”
Source: NASA, ESA, CSA, STScI
NASA: “…image of Neptune……brings the planet’s rings into full focus for the first time in more than three decades. The most prominent features of Neptune’s atmosphere in this image are a series of bright patches in the planet’s southern hemisphere that represent high-altitude methane-ice clouds. More subtly, a thin line of brightness circling the planet’s equator could be a visual signature of global atmospheric circulation that powers Neptune’s winds and storms. Additionally, for the first time, Webb has teased out a continuous band of high-latitude clouds surrounding a previously-known vortex at Neptune’s southern pole.” Source: NASA, ESA, CSA, STScI

The Space Telescope Science Institute (STScI) has created a Resource Gallery of Webb Space Telescope images, which you can browse here: https://webbtelescope.org/resource-gallery/images. Currently there are 280 images in the Webb Resource Gallery.  I think this is a website worth revisiting from time to time.

NASA’s Solar System Exploration website provides views of Neptune from several earlier sources, including the 1989 Voyager 2 deep space probe, the Hubble Space Telescope and the European Southern Observatory’s (ESO) Very Large Telescope (VLT). Check it out here: https://solarsystem.nasa.gov/planets/neptune/galleries/

2018: The following image was taken in July 2018 during the testing of the narrow-field, adaptive optics mode of the optical/infrared MUSE/GALACSI instrument on ESO’s VLT, which is located at an elevation of 2,635 m (8,645 ft) at Cerro Paranal, in the Atacama Desert of northern Chile.

2018 VLT image of Neptune. The corrected image is sharper than a comparable image from the NASA/ESA Hubble Space Telescope. Source: ESO/P. Weilbacher (AIP)

1994: The more recent Webb Space Telescope and VLT images are much better than the Hubble Space Telescope optical-range images of Neptune taken more than two decades earlier, in 1994.

NASA: “The images were taken in 1994 on October 10 (upper left), October 18 (upper right), and November 2 (lower center). Hubble is allowing astronomers to study Neptune’s dynamic atmosphere with a level of detail not possible since the 1989 flyby of the Voyager 2 space probe. Building on Voyager’s initial discoveries, Hubble is revealing that Neptune has a remarkably dynamic atmosphere that changes over just a few days. The temperature difference between Neptune’s strong internal heat source and its frigid cloud tops (-260 degrees Fahrenheit) might trigger instabilities in the atmosphere that drive these large-scale weather changes. In addition to hydrogen and helium, the main constituents, Neptune’s atmosphere is composed of methane and hydrocarbons, like ethane and acetylene.” Source: NASA, JPL, STScI

1989: In October 1989, the following whole planet view of Neptune was produced using images taken through the green and orange filters on the narrow angle camera during the Voyager 2 spacecraft flyby of the planet.

NASA: “This picture of Neptune was taken by Voyager 2 less than five days before the probe’s closest approach of the planet on Aug. 25, 1989. The picture shows the “Great Dark Spot” — a storm in Neptune’s atmosphere — and the bright, light-blue smudge of clouds that accompanies the storm”. 
Source: NASA/JPL-Caltech (1989)
 

In the future, we can hopefully look forward to more detailed multi-messenger images of Neptune, combining the near-infrared images from Webb with images from other observatories that can view the planet in different spectral bands.

For more information

Video

Multi-messenger Astronomy Provides Extraordinary Views of Uranus

Peter Lobner, updated 19 December 2023

1. Introduction

Uranus, the seventh planet from the Sun, is an ice giant planet with 27 known moons in a unique orbit beyond Saturn. Uranus makes a complete orbit around the Sun in about 84 Earth years. It is the only planet whose equator is tilted nearly at a right angle to its orbital plane, which results in the polar regions pointing toward the Sun (and Earth) during parts of the orbit.

Uranus was visited briefly by NASA’s Voyager 2 spacecraft during its January 1986 flyby, which came within 81,500 km (50,600 miles) of the planet’s cloud tops. Since then, Uranus has been studied at visible, near-infrared and X-ray wavelengths from the perspective of terrestrial and near-Earth, space-based observatories.

Visible light has a wavelength in the range from about 350 to 750 nanometers (nm, 10-9meters) or 3,500 to 7,500 Angstroms.  Near-infrared light is the part of the infrared spectrum that is closest to the visible light spectrum, but at a longer wavelength, from about 800 to 2,500 nm.  X-rays have a much shorter wavelength, from about 20 to 0.001 nm.  In the following chart, you can see the relative placement of visible and near-infrared light and X-rays in the electromagnetic spectrum.

Electromagnetic spectrum. Source: Wikipedia

2. 2021 composite images of Uranus at visible / near-infrared and X-ray wavelengths

In March 2021, the National Aeronautics and Space Administration (NASA) announced that its orbiting Chandra X-ray Observatory had made the first ever detection of X-rays coming from the ice giant planet Uranus.  Recent analysis of Chandra observations from 2002 and 2017 resulted in this discovery. You can read NASA’s 2021 announcement of this discovery here: https://chandra.si.edu/photo/2021/uranus/

X-rays coming from other planets have been detected in the past.  NASA reported, “Like Jupiter and Saturn, Uranus and its rings appear to mainly produce X-rays by scattering solar X-rays, but some may also come from auroras…… The X-rays from auroras on Jupiter come from two sources: electrons traveling down magnetic field lines, as on Earth, and positively charged atoms and molecules raining down at Jupiter’s polar regions. However, scientists are less certain about what causes auroras on Uranus.”  

Another possible X-ray source could be from an interaction between Uranus’ rings and the near-space charged particle environment around the planet.  This phenomenon has been observed at Saturn.

In connection with the discovery of X-rays coming from Uranus, NASA released two spectacular composite (multi-messenger) images of the planet created by combining images from two different parts of the electromagnetic spectrum: optical / near-infrared and X-ray. 

The components of the first composite image are described below:

  • Near-infrared image: This was taken in July 2004 with the 10-meter (32-foot 10-inch) Keck-1 telescope located at an altitude of 4,145 meters (13,599 ft) on Maunakea, Hawaii.
  • The X-ray image: This was produced with 7 August 2002 data from the Advanced CCD Imaging Spectrometer (ACIS) aboard Chandra, which has a spatial resolution of 0.5” (seconds). The angular size of Uranus for the observation was 3.7”. The X-rays were in the 0.6 to 1.1 keV (2.1 to 1.1 nm) spectral range, which is consistent with X-ray emissions from Jupiter and Saturn. 
(Left) Keck-1 July 2004 near-infrared image of Uranus. The North Pole is at the 4 o’clock position. Sources: Space Science Institute;  University of Wisconsin-Madison / W. M. Keck Observatory (Right) Chandra August 2002 ACIS X-ray image of Uranus.  Sources: NASA/CXO/University College London
2021 Keck-1 & Chandra ACIS composite image

The second 2021 composite image, shown below, was created from a Keck optical image and X-ray images made with Chandra’s High Resolution Camera (HRC) during observations on 11 and 12 November 2017.  The HRC is sensitive to softer X-ray emissions (down to 0.06 keV, 20.7 nm) than ACIS, enabling it to collect more photons in the 0.1–1.2 keV (12.4 to 0.1 nm) range most important for planetary studies. The authors report, ”These fluxes exceed expectations from scattered solar emission alone, suggesting either a larger X-ray albedo than Jupiter/Saturn or the possibility of additional X-ray production processes at Uranus.”

2021 Keck & Chandra HRC composite image
Sources:  X-ray: NASA/CXO/University College London/W. Dunn 
et al; Optical: W.M. Keck Observatory

The authors conclude by noting that, “Further, and longer, observations with Chandra would help to produce a map of X-ray emission across Uranus and to identify, with better signal-to-noise, the source locations for the X-rays, constraining possible contributions from the rings and aurora…… However, the current generation of X-ray observatories does not provide sufficient sensitivity to spectrally characterize the short interval temporal fluctuation observed in the November 12, 2017 observation.”

New space-based X-ray observational capabilities are being developed by NASA and the European Space Agency (ESA), but won’t be operational for a decade or more:

3. 2023 JWST near-infrared images of Uranus

The James Webb Space Telescope (JWST), which has four science instruments designed to observe at optical to mid-infrared (0.6 – 28.3 microns) wavelengths, produced its first images of Uranus in April 2023.

Annotated image of Uranus captured by the JWST on 6 Feb. 2023,  provides a view of the bright North polar ice cap and glowing clouds at near-infrared wavelengths of 1.4 to 3.0 microns. Sources: NASA, ESA, CSA, STScI

Wide field image of Uranus captured by the JWST on 6 Feb. 2023 at near-infrared wavelengths of 1.4 to 5.0 microns. Note  that 14 of the 27 known moons are identified in the image. Also note the many distant galaxies in this image. Sources: NASA, ESA, CSA, STScI

Enlarged view of the 6 Feb. 2023 JWST near-infrared image shows the bright North polar cap, glowing clouds, details of the ring structure and many of the inner moons. Sources: NASA, ESA, CSA, STScI

4. For more information:

The Event Horizon Telescope Team has Produced the First Image Showing the Shadow of a Black Hole

Peter Lobner, updated 7 April 2020 & 19 January 2024

The first image of a black hole was released on 10 April 2019  at a press conference in Washington D.C. held by the Event Horizon Telescope (EHT) team and the National Science Foundation (NSF).  The subject of the image is the supermassive black hole known as M87* located near the center of the Messier 87 (M87) galaxy.  This black hole is about 55 million light years from Earth and is estimated to have a mass 6.5 billion times greater than our Sun.  The image shows a glowing circular emission ring surrounding the dark region (shadow) containing the black hole.  The brightest part of the image also may have captured a bright relativistic jet of plasma that appears to be streaming away from the black hole at nearly the speed of light, beaming generally in the direction of Earth.

The first ever image showing the shadow of a black hole (M87*), which remains unseen at the center of the dark circular region. Source:The EHT Collaboration, et al.

The EHT is not one physical telescope.  Rather, it an array of millimeter and sub-millimeter wavelength radio telescopes located around the world.  The following map shows the eight telescopes that participated in the 2017 observations of M87.  Three additional telescopes joined the EHT array in 2018 and later.  

The EHT array as used for the April 2017 observations.  
Source: The EHT Collaboration, et al.

All of the EHT telescopes are used on a non-dedicated basis by an EHT team of more than 200 researchers during a limited annual observing cycle.  The image of the M87* black hole was created from observations made during a one week period in April 2017.

The long baselines between the individual radio telescopes give the “synthetic” EHT the resolving power of a physical radio telescope with a diameter that is approximately equal to the diameter of the Earth. A technique called very long-baseline interferometry (VLBI) is used to combine the data from the individual telescopes to synthesize the image of a black hole. EHT Director, Shep Doeleman, referred to VLBI as “the ultimate in delayed gratification among astronomers.” The magnifying power of the EHT becomes real only when the data from all of the telescopes are brought together and the data are properly combined and processed. This takes time.

At a nominal operating wavelength of about 1.3 mm (frequency of 230 GHz), EHT angular resolution is about 25 microarcseconds (μas), which is sufficient to resolve nearby supermassive black hole candidates on scales that correspond to their event horizons.  The EHT team reports that the M87* bright emission disk subtends an angle of 42 ± 3 microarcseconds.

For comparison, the resolution of a human eye in visible light is about 60 arcseconds (1/60thof a degree; there are 3,600 arcseconds in one degree) and the 2.4-meter diameter Hubble Space Telescope has a resolution of about 0.05 arcseconds (50,000 microarcseconds).

You can read five open access papers on the first M87* Event Horizon Telescope results written by the EHT team and published on 10 April 2019 in the Astrophysical Journal Letters here:

Congratulations to the EHT Collaboration for their extraordinary success in creating the first-ever image of a black hole shadow.

7 April 2020 Update:  EHT observations were complemented by multi-spectral (multi-messenger) observations by NASA spacecraft

On 10 April 2019, NASA reported on its use of several orbiting spacecraft to observe M87 in different wavelengths during the period of the EHT observation.

  • “To complement the EHT findings, several NASA spacecraft were part of a large effort, coordinated by the EHT’s Multiwavelength Working Group, to observe the black hole using different wavelengths of light. As part of this effort, NASA’s Chandra X-ray Observatory, Nuclear Spectroscopic Telescope Array (NuSTAR) and Neil Gehrels Swift Observatory space telescope missions, all attuned to different varieties of X-ray light, turned their gaze to the M87* black hole around the same time as the EHT in April 2017. NASA’s Fermi Gamma-ray Space Telescope was also watching for changes in gamma-ray light from M87* during the EHT observations.”
  • “NASA space telescopes have previously studied a jet extending more than 1,000 light-years away from the center of M87*. The jet is made of particles traveling near the speed of light, shooting out at high energies from close to the event horizon. The EHT was designed in part to study the origin of this jet and others like it.”

NASA’s Neutron star Interior Composition Explorer (NICER) experiment on the International Space Station also contributed to the multi-spectral observations of M87*, which were coordinated by EHT’s Multiwavelength Working Group.

Chandra X-ray Observatory close-up of the core of the M87 galaxy,
showing the location of the M87* black hole (+) and the relativistic jet.
Source: NASA/CXC/Villanova University/J. Neilsen

On April 25, 2019, NASA released the following composite image showing the M87 galaxy, the position of the M87* black hole and large relativistic jets of matter being ejected from the black hole.  These infrared images were made by NASA’s orbiting Spitzer Space Telescope.  

The M87 galaxy, with two expanded views, first showing the location of the M87* black hole and two plasma jets (orange) at the center of the galaxy, and second, the closeup EHT image of the M87* black hole’s shadow.  
Source: NASA/JPL-Caltech/IPAC/Event Horizon Telescope

19 January 2024 Update: Results of the second M87* black hole EHT observation campaign

The original image of the M87* black hole released in April 2019 was derived from data collected during the April 2017 EHT observation campaign.  In January 2024, the EHT Collaboration published the results of a second M87* black hole observation campaign, which took place in April 2018 with an improved global EHT array, wider frequency coverage, and increased bandwidth. This paper shows that the M87* black hole has maintained a similar size in the two images and that the brightest part of the ring surrounding the black hole has rotated about 30 degrees.

Original M87* black hole image (left) & an image from data collected one year later (right). Source: EHT Collaboration via Astronomy & Astrophysics (Jan 2024)

The EHT Collaboration concluded, “The perennial persistence of the ring and its diameter robustly support the interpretation that the ring is formed by lensed emission surrounding a Kerr black hole with a mass ∼6.5 × 109M (mass of the Sun). The significant change in the ring brightness asymmetry implies a spin axis that is more consistent with the position angle of the large-scale jet.”

For more information:

See the following sources for more information on the EHT and imaging the M87* black hole:

NuSTAR Provides a High-Resolution X-ray View of our Universe

Peter Lobner

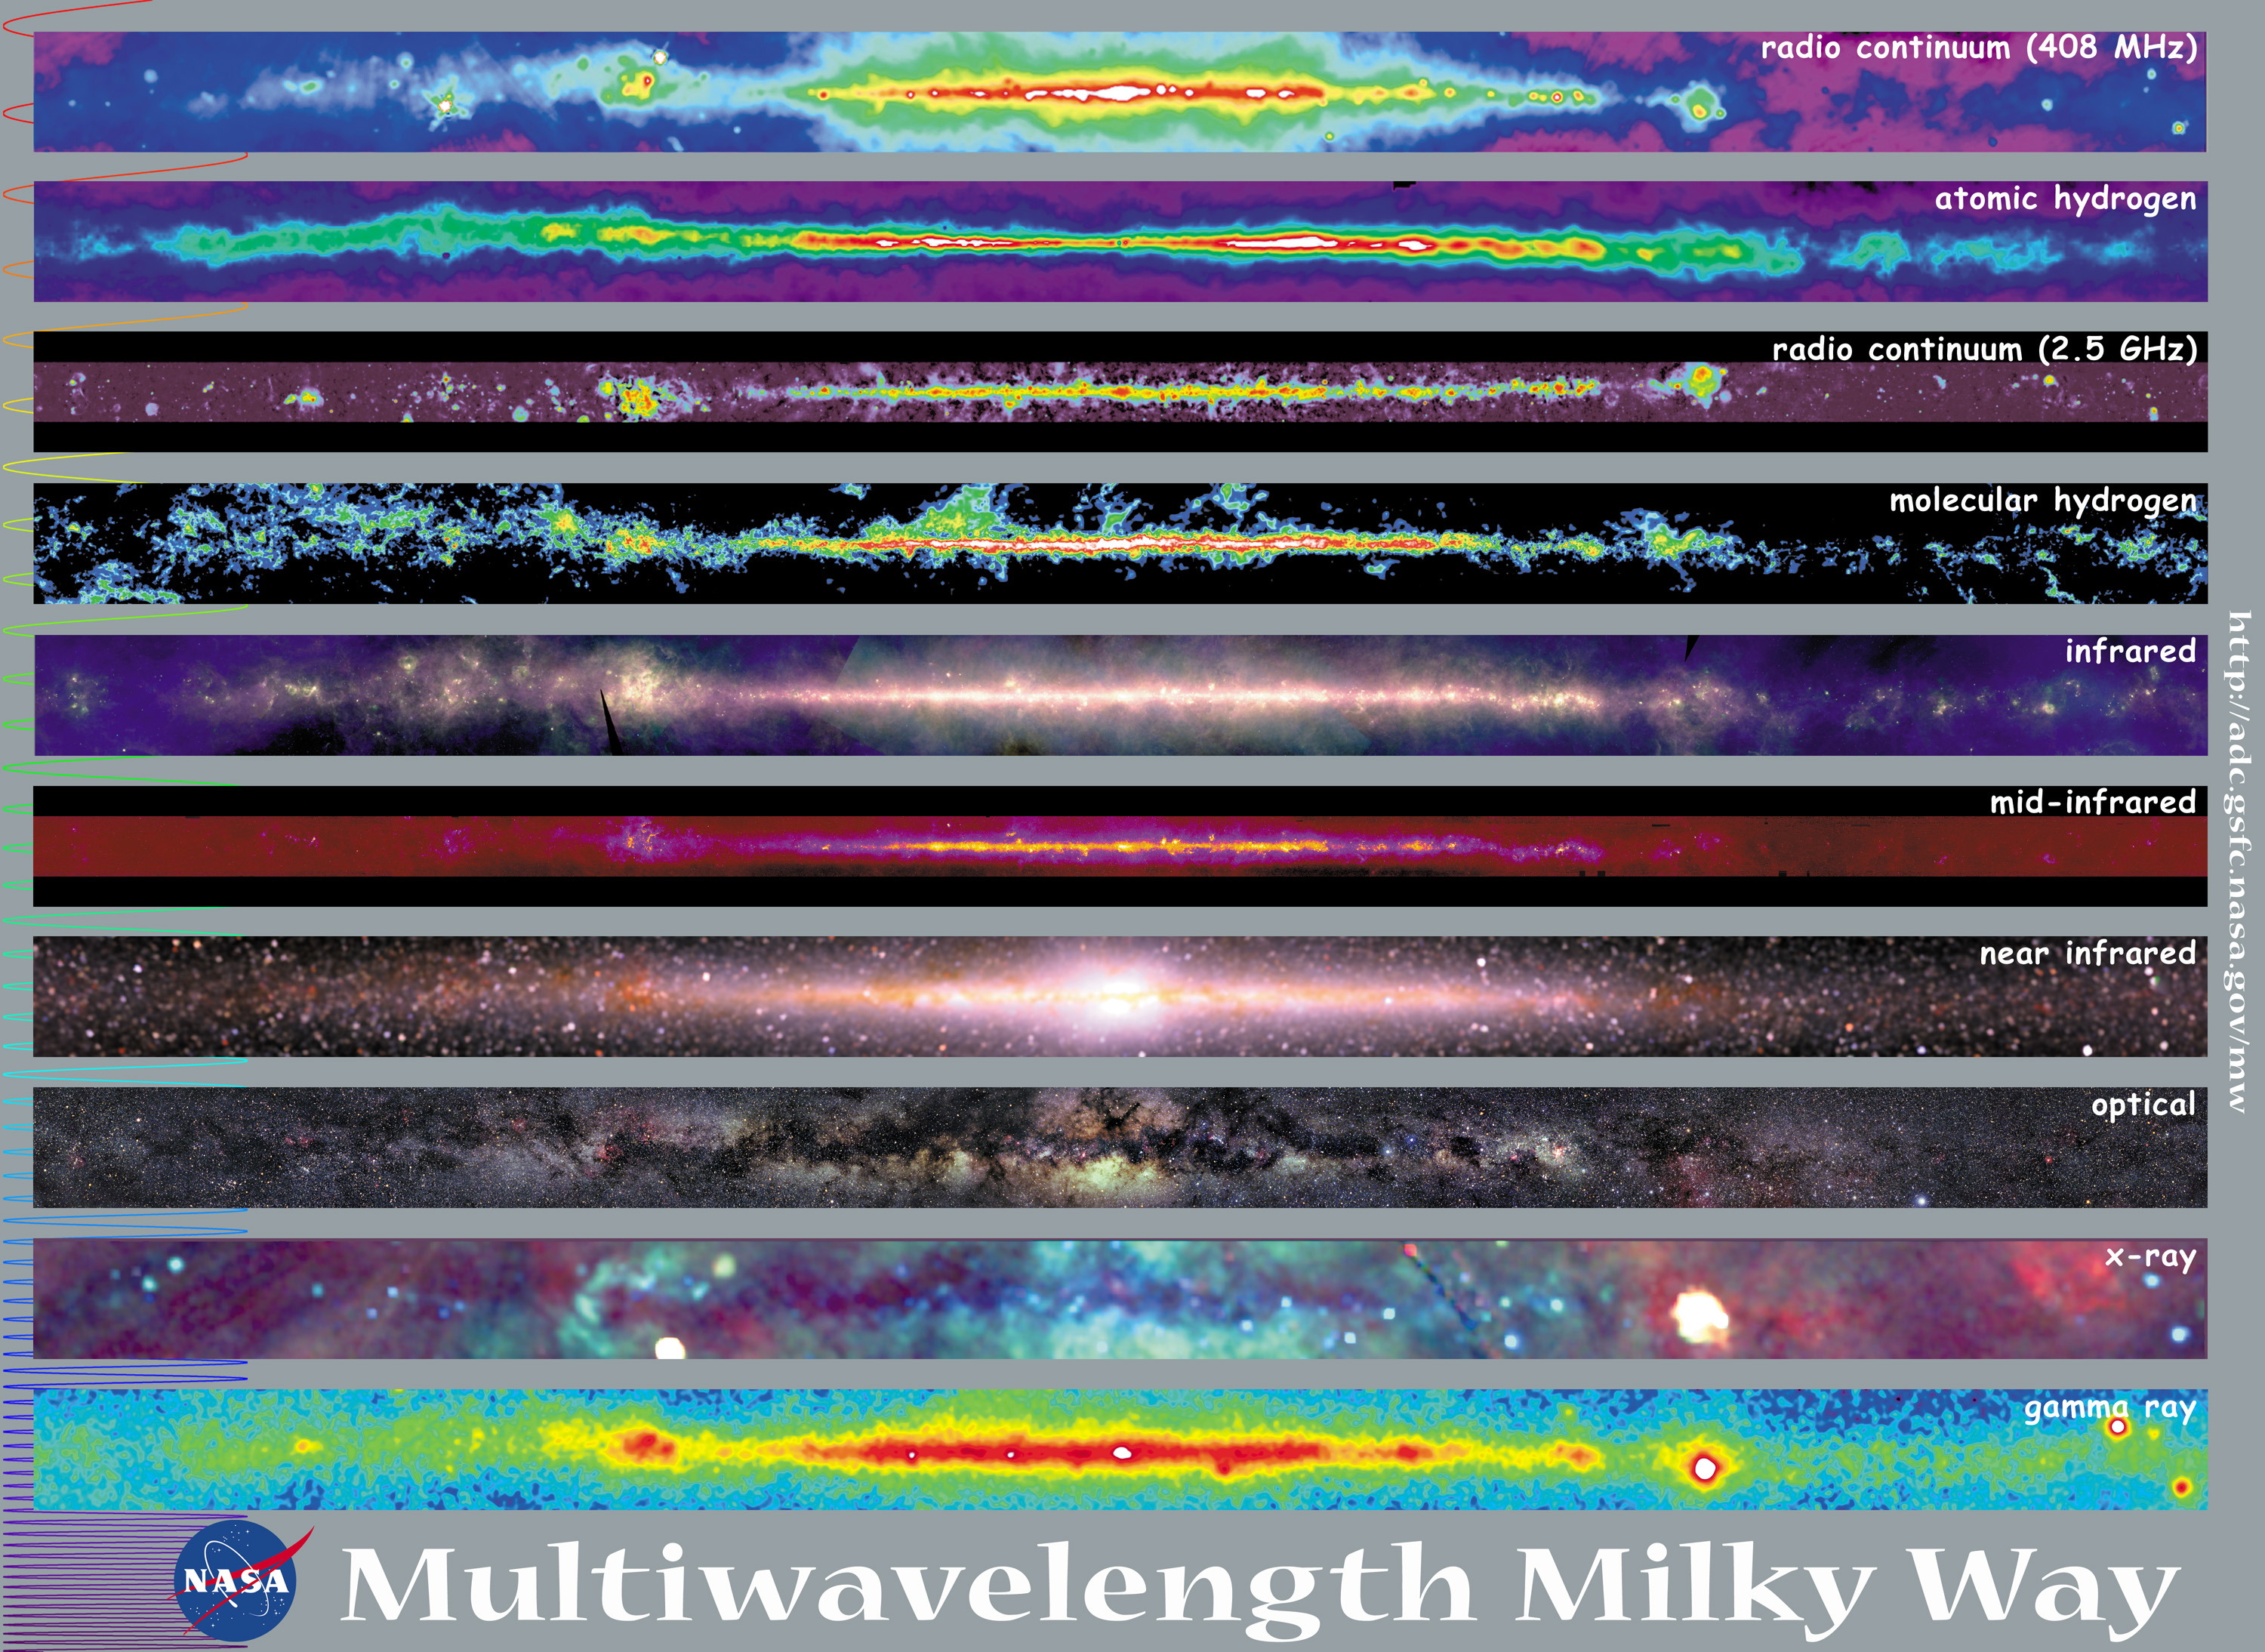
In my 6 March 2016 post, “Remarkable Multispectral View of Our Milky Way Galaxy,” I briefly discussed several of the space-based observatories that are helping to develop a deeper understanding of our galaxy and the universe. One space-based observatory not mentioned in that post is the National Aeronautics and Space Administration (NASA) Nuclear Spectroscopic Telescope Array (NuSTAR) X-Ray observatory, which was launched on 13 June 2012 into a near equatorial, low Earth orbit. NASA describes the NuSTAR mission as follows:

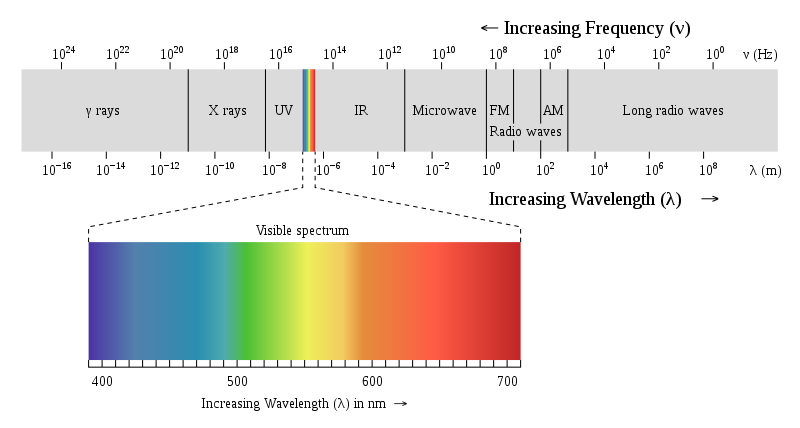
“The NuSTAR mission has deployed the first orbiting telescopes to focus light in the high energy X-ray (6 – 79 keV) region of the electromagnetic spectrum. Our view of the universe in this spectral window has been limited because previous orbiting telescopes have not employed true focusing optics, but rather have used coded apertures that have intrinsically high backgrounds and limited sensitivity.

During a two-year primary mission phase, NuSTAR will map selected regions of the sky in order to:

1.  Take a census of collapsed stars and black holes of different sizes by surveying regions surrounding the center of own Milky Way Galaxy and performing deep observations of the extragalactic sky;

2.  Map recently-synthesized material in young supernova remnants to understand how stars explode and how elements are created; and

3.  Understand what powers relativistic jets of particles from the most extreme active galaxies hosting supermassive black holes.”

 The NuSTAR spacecraft is relatively small, with a payload mass of only 171 kg (377 lb). In it’s stowed configuration, this compact satellite was launched by an Orbital ATK Pegasus XL booster, which was carried aloft by the Stargazer L-1011 aircraft to approximately 40,000 feet over open ocean, where the booster was released and carried the small payload into orbit.

Orbital ATK L-1011 StargazerStargazer L-1011 dropping a Pegasus XL booster. Source: Orbital ATK

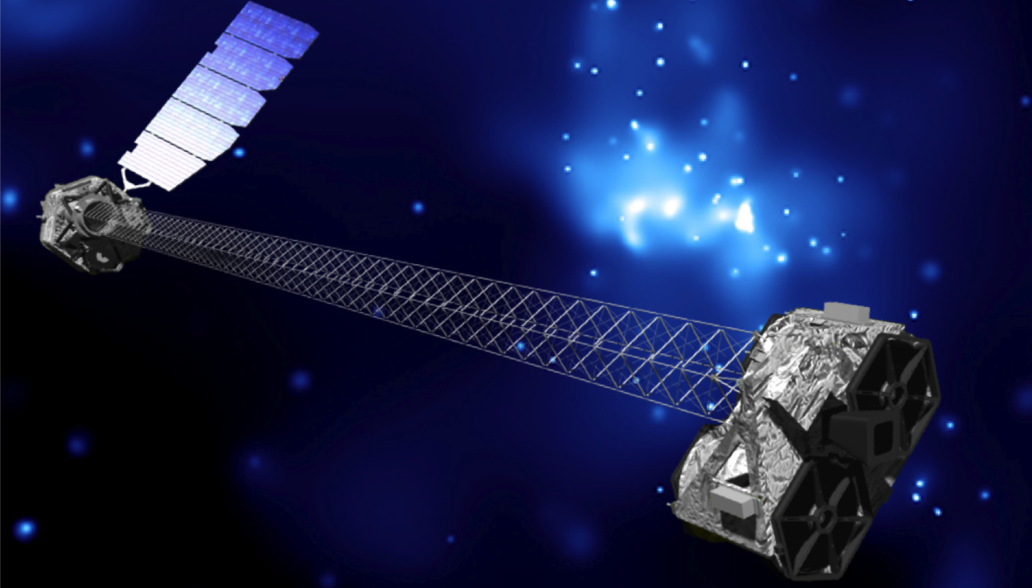
In orbit, the solar-powered NuSTAR extended to a total length of 10.9 meters (35.8 feet) in the orbital configuration shown below. The extended spacecraft gives the X-ray telescope a 10 meter (32.8 foot) focal length.

NuSTAR satellite
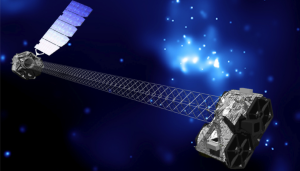
NuSTAR orbital configuration. Source: NASA / JPL – Caltech

NASA describes the NuSTAR X-Ray telescope as follows:

“The NuSTAR instrument consists of two co-aligned grazing incidence X-Ray telescopes (Wolter type I) with specially coated optics and newly developed detectors that extend sensitivity to higher energies as compared to previous missions such as NASA’a Chandra X-Ray Observatory launched in 1999 and the European Space Agency’s (ESA) XMM-Newton (aka High-throughput X-Ray Spectrometry Mission), also launched in 1999…….. The observatory will provide a combination of sensitivity, spatial, and spectral resolution factors of 10 to 100 improved over previous missions that have operated at these X-ray energies.”

The NASA NuSTAR mission website is at the following link:

https://www.nasa.gov/mission_pages/nustar/main/index.html

Some examples of NuSTAR findings posted on this website are summarized below.

X-ray emitting structures of galaxies identified

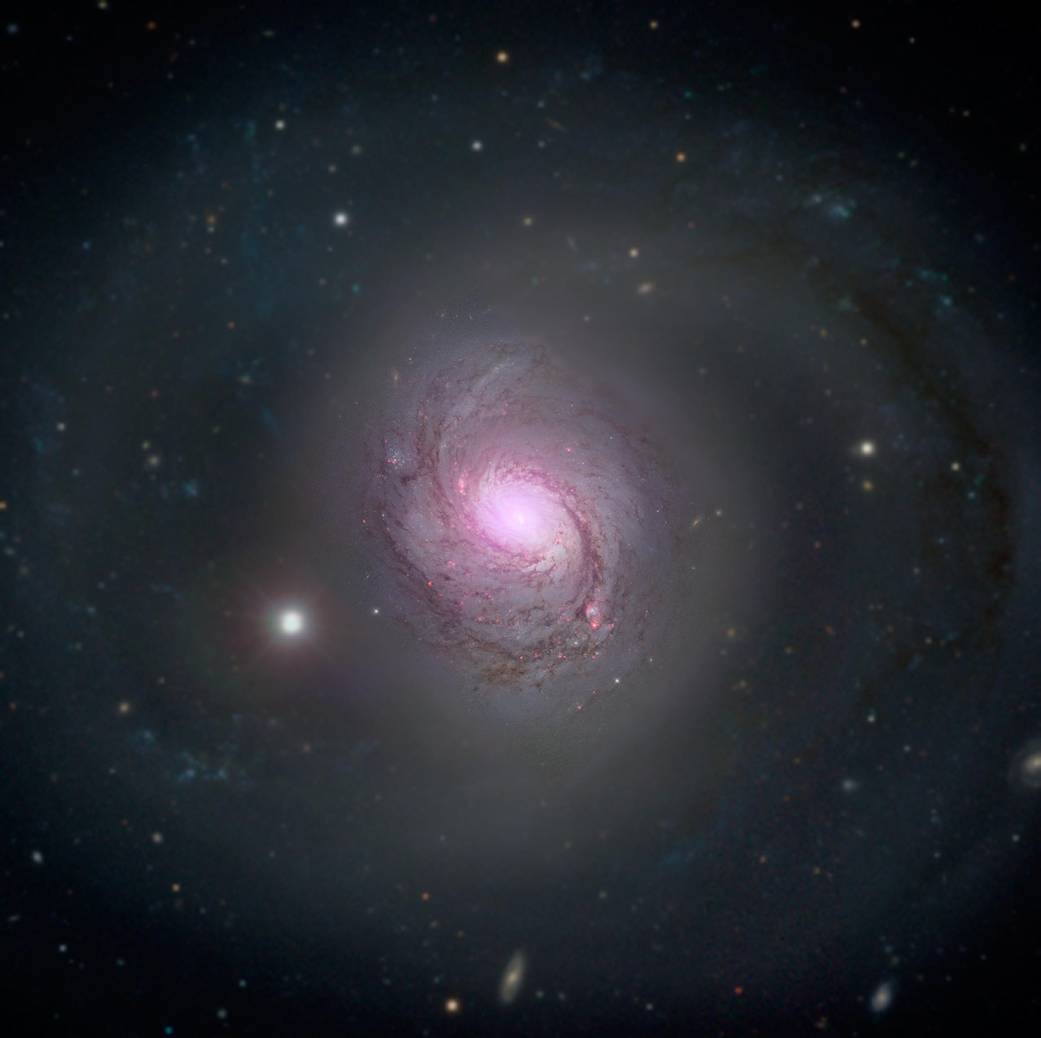
In the following composite image of Galaxy 1068, high-energy X-rays (shown in magenta) captured by NuSTAR are overlaid on visible-light images from both NASA’s Hubble Space Telescope and the Sloan Digital Sky Survey.

Galaxy 1068
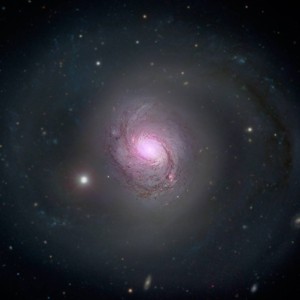
Galaxy 1068. Source: NASA/JPL-Caltech/Roma Tre Univ

Below is a more detailed X-ray view of portion of the Andromeda galaxy (aka M31), which is the galaxy nearest to our Milky Way. On 5 January 2017, NASA reported:

“The space mission has observed 40 ‘X-ray binaries’ — intense sources of X-rays comprised of a black hole or neutron star that feeds off a stellar companion.

Andromeda is the only large spiral galaxy where we can see individual X-ray binaries and study them in detail in an environment like our own.”

In the following image, the portion of the Andromeda galaxy surveyed by NuSTAR is in the smaller outlined area. The larger outlined area toward the top of this image is the corresponding X-ray view of the surveyed area.

Andromeda galaxy
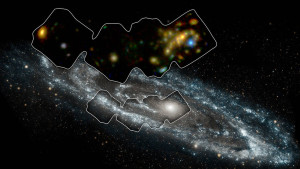
Andromeda galaxy.  Source: NASA/JPL-Caltech/GSFC

NASA describes the following mechanism for X-ray binaries to generate the observed intense X-ray emissions:

“In X-ray binaries, one member is always a dead star or remnant formed from the explosion of what was once a star much more massive than the sun. Depending on the mass and other properties of the original giant star, the explosion may produce either a black hole or neutron star. Under the right circumstances, material from the companion star can “spill over” its outermost edges and then be caught by the gravity of the black hole or neutron star. As the material falls in, it is heated to blazingly high temperatures, releasing a huge amount of X-rays.”

You can read more on this NuStar discovery at the following link:

https://www.nasa.gov/feature/jpl/Andromeda-Galaxy-Scanned-with-High-Energy-X-ray-Vision

Composition of supernova remnants determined

Cassiopeia A is within our Milky Way, about 11,000 light-years from Earth. The following NASA three-panel chart shows Cassiopeia A originally as an iron-core star. After going supernova, Cassiopeia A scattered its outer layers, which have distributed into the diffuse structure we see today, known as the supernova remnant. The image in the right-hand panel is a composite X-ray image of the supernova remnant from both the Chandra X-ray Observatory and NuStar.

Cassiopeia A
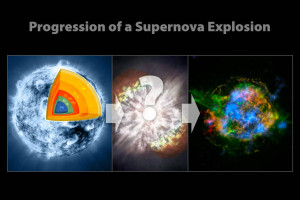
Source: NASA/CXC/SAO/JPL-Caltech

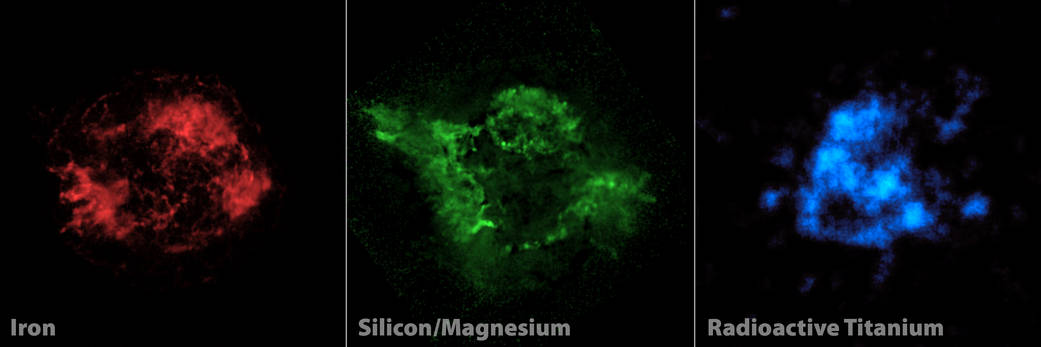
In the following three-panel chart, the composite image (above, right) is unfolded into its components. Red shows iron and green shows both silicon and magnesium, as seen by the Chandra X-ray Observatory. Blue shows radioactive titanium-44, as mapped by NuSTAR.

 Cassiopeia A componentsSource: NASA/JPL-Caltech/CXC/SAO

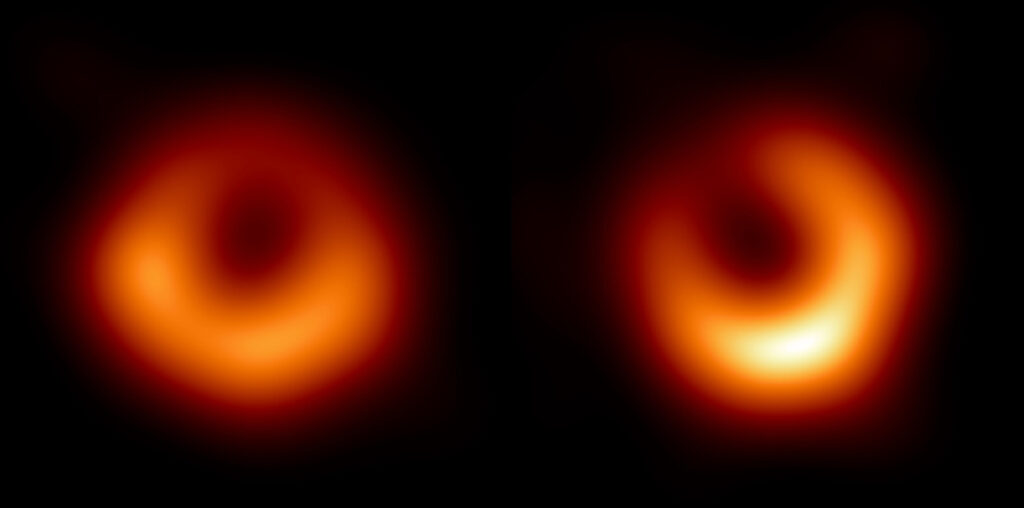
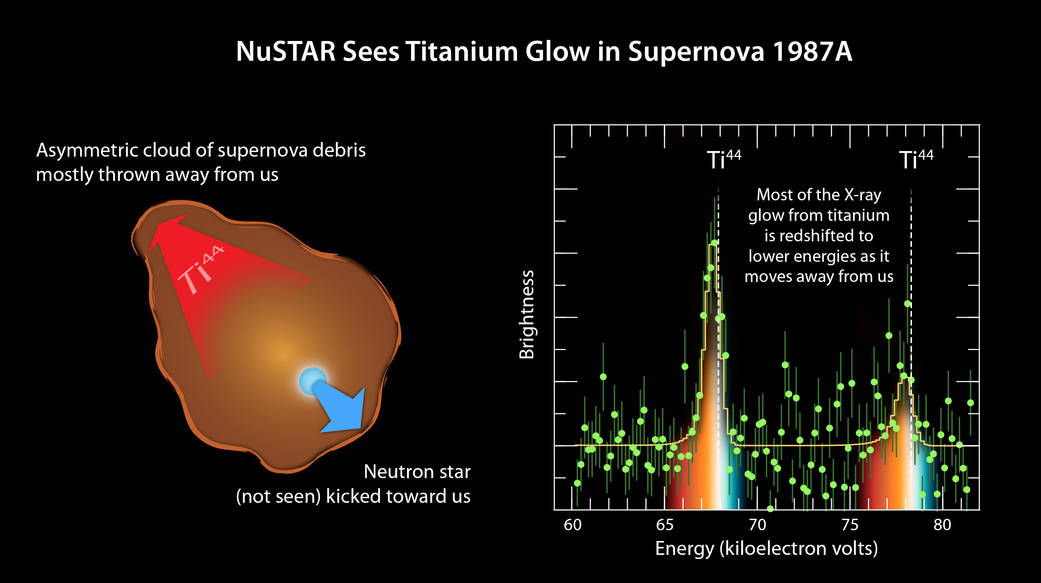
Supernova 1987A is about 168,000 light-years from Earth in the Large Magellanic Cloud. As shown below, NuSTAR also observed titanium in this supernova remnant.

SN 1987A titaniumSource: NASA/JPL-Caltech/UC Berkeley

These observations are providing new insights into how massive stars explode into supernovae.

Remarkable Multispectral View of Our Milky Way Galaxy

Peter Lobner, updated 18 August 2023

Moody Blues cover - In search of the lost chordAlbum Album cover art credit: Deram Records

Some of you may recall the following lyrics from the 1968 Moody Blues song, “The Word,” by Graeme, Edge, from the album “In Search of the Lost Chord”:

This garden universe vibrates complete

Some, we get a sound so sweet

 Vibrations reach on up to become light

And then through gamma, out of sight

Between the eyes and ears there lie

The sounds of color and the light of a sigh

And to hear the sun, what a thing to believe

But it’s all around if we could but perceive

 To know ultraviolet, infrared and X-rays

Beauty to find in so many ways

On 24 February 2016, the European Southern Observatory (ESO) Consortium announced that it has completed the ATLASGAL Survey of the Milky Way. The survey mapped the entire galactic plane visible from the southern hemisphere at sub-millimeter wavelengths, between infrared light and radio waves, using the Atacama Pathfinder EXperiment (APEX) telescope located at 5,100 meters (16,732 ft.) above sea level in Chile’s Atacama region. The southern sky is particularly important because it includes the galactic center of our Milky Way. The Milky Way in the northern sky has already been mapped by the James Clerk Maxwell Telescope, which is a sub-millimeter wavelength telescope at the Mauna Kea Observatory in Hawaii.

The new ATLASGAL maps cover an area of sky 140 degrees long and 3 degrees wide. ESO stated that these are the sharpest maps yet made, and they complement those from other land-based and space-based observatories. The principal space-based observatories are the following:

  • European Space Agency’s (ESA) Plank satellite: Mission on-going, mapping anisotropies of the cosmic microwave background at microwave and infrared frequencies.
  • ESA’s Herschel Space Observatory: Mission on-going, conducting sky surveys in the far-infrared and sub-millimeter frequencies.
  • National Aeronautics and Space Administration (NASA) Spitzer Space Telescope: Mission on-going, conducting infrared observations and mapping as described in my 1 April 2015 post.
  • NASA’s Hubble Space Telescope: Mission on-going, observing and mapping at ultraviolet, optical, and infrared frequencies.
  • NASA’s Chandra X-Ray Observatory: Mission on-going, observing and mapping X-ray sources.
  • NASA’s Compton Gamma Ray Observatory: Mission ended in 2000. Observed and mapped gamma ray and x-ray sources.

ESO reported that the combination of Planck and APEX data allowed astronomers to detect emission spread over a larger area of sky and to estimate from it the fraction of dense gas in the inner galaxy. The ATLASGAL data were also used to create a complete census of cold and massive clouds where new generations of stars are forming.

You can read the ESO press release at the following link:

https://www.eso.org/public/news/eso1606/

Below is a composite ESO photograph that shows the same central region of the Milky Way observed at different wavelengths.

ESO Multispectral view of Milky WaySource: ESO/ATLASGAL consortium/NASA/GLIMPSE consortium/VVV Survey/ESA/Planck/D. Minniti/S. Guisard. Acknowledgement: Ignacio Toledo, Martin Kornmesser

  • The top panel shows compact sources of sub-millimeter radiation detected by APEX as part of the ATLASGAL survey, combined with complementary data from ESA’s Planck satellite, to capture more extended features.
  • The second panel shows the same region as seen in shorter, infrared wavelengths by the NASA Spitzer Space Telescope
  • The third panel shows the same part of sky again at even shorter wavelengths, the near-infrared, as seen by ESO’s VISTA infrared survey telescope at the Paranal Observatory in Chile. Regions appearing as dark dust tendrils in the third panel show up brightly in the ATLASGAL view (top panel).
  • The bottom panel shows the more familiar view in visible light, where most of the more distant structures are hidden from view

NASA’s Goddard Space Flight Center also  created a multispectral view of the Milky Way, which  is shown in the following composite photograph of the same central region of the Milky Way observed at different wavelengths.

NASA Goddard multispectralSource: NASA Goddard Space Flight Center

Starting from the top, the ten panels in the NASA image cover the following wavelengths.

  • Radio frequency (408 MHz)
  • Atomic hydrogen
  • Radio frequency (2.5 GHz)
  • Molecular hydrogen
  • Infrared
  • Mid-infrared
  • Near-infrared
  • Optical
  • X-ray
  • Gamma ray

The Moody Blues song, “The Word,” ends with the following lyrics:

 Two notes of the chord, that’s our full scope

But to reach the chord is our life’s hope

And to name the chord is important to some

So they give it a word, and the word is “Om”

While “Om” (pronounced or hummed “ahh-ummmm”) traditionally is a sacred mantra of Hindu, Jain and Buddhist religions, it also may be the mantra of astronomers as they unravel new secrets of the Milky Way and, more broadly, the Universe. I suspect that completing the ATLASGAL Survey of the Milky Way was an “Om” moment for the many participants in the ESO Consortium effort.

For more information