All posts by Drummer

How Can Studios Release High-Definition Versions of Decades Old Movies and TV Shows?

Peter Lobner

That modern high-definition (HD) digital versions of movies can be created from the original film stock is a real testament to the very high-resolution available in movie film, even older film stock if it has been well preserved. Details on the process are described in the article at the following link:

http://www.howtogeek.com/199182/ask-htg-how-can-studios-release-high-definition-versions-of-decades-old-movies-and-tv-shows/

The most common film used in traditional movie theaters is 35 mm film, which is available in several variations for Cinemascope, widescreen, etc.  A 35 mm film frame measures 22 mm wide by 16 mm high and more or less of that frame is used depending on the aspect ratio of the image being captured. For example, a wide-screen (high aspect ratio) image does not use the full height of the 35 mm film frame. In effect, this is optical image compression.

35mm_film_formatSource: Wikipedia Commons

The large format film stock discussed in the article is 65 mm film, which was used to film the 1959 movie Ben Hur and many other wide-screen movies.  The resolution is higher than for 35 mm film because of the greater film area available for an “uncompressed” wide-screen image. As used in cameras, each film frame is 48.5 mm wide by 22.1 mm high. For projection, the original 65 mm film is printed on 70 mm film. The additional 5 mm in film width are used for four magnetic strips holding six tracks of sound.

IMAX-70mm-35mm comparisonSource: HowStuffWorks.com

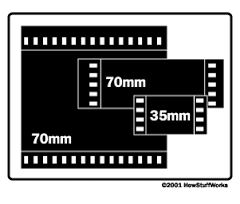
The article doesn’t mention IMAX film, which is a horizontal variant of 70 mm film, in which the film roll is turned on its side with 15 perforations per frame. The above figure shows the relative sizes of 35 mm, standard 70 mm and IMAX 70 mm film. An IMAX frame is more than three times the size of a standard 70 mm frame and almost nine times greater than a 35 mm film frame. No wonder IMAX film movies look so impressive.

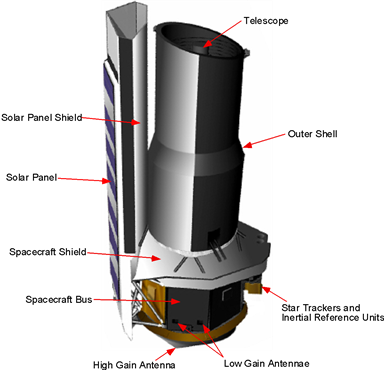
The 1st-generation U.S. photographic spy satellites, Corona, used special Kodak 70 mm film.

As noted in the article, the resolution of 35mm film is comparable to that of a 20 megapixel digital image. The large format 65-70mm film has roughly double the potential resolution of 35mm film, comparable to a 30-40 megapixel digital image. This means an IMAX film image would be comparable to a 90 – 120 megapixel digital image.

Many new movies are being filmed in 8K digital (7680 x 4320 pixel frame = about 33.2 megapixels per frame), which has about 4 times the resolution of the latest 4K (3840 x 2160 pixel frame = about 8.2 megapixels per frame) HDTVs.  Even 8K digital doesn’t match the image quality from the original film version of the movie Ben Hur or a modern IMAX film.

Searching the Internet of Things

Peter Lobner

The company Shodan (https://www.shodan.io) makes a search engine for Internet connected devices, which commonly is referred to as the “Internet of things”. The Shodan website explains that the intent of this search engine is to provide the following services:

Explore the Internet of Things

  • Use Shodan to discover which of your devices are connected to the Internet, where they are located, and who is using them.

Monitor Network Security

  • Keep track of all the computers on your network that are directly accessible from the Internet. Shodan lets you understand your digital footprint.

Get a Competitive Advantage

  • Who is using your product? Where are they located? Use Shodan to develop empirical market intelligence.

See the Big Picture

  • Websites are just one part of the Internet. There are power plants, smart TVs, smart appliances, and much more that can be found with Shodan.

From a security point-of-view, the last point, above, should seem a bit unsettling to the owners / operators of the power plants, smart TVs and smart appliances.

Shodan founder, John Matherly, claims to have “pinged” all devices on the internet.  Not surprisingly, the results, which are reproduced below, show that internet-connected devices are concentrated in developed nations and metropolitan areas. These results were reported on Twitter at the following link:

https://twitter.com/achillean/status/505049645245288448/photo/1

Shodan 2014 ping of Internet of Things

World Bank Open Data Website Provides Free Access to Data About Development in Countries Around the Globe

Peter Lobner

You can access World Bank Open Data at the following link:

http://data.worldbank.org

Your basic navigation options are shown below:

World Bank web site navigation

As an example of what you can find, I selected the “Indicators” tab, then looked under the “Infrastructure” heading and found that data on “Internet users (per 100 people)” were available. These data are viewable in different formats (tabular, map, graph). The map results for the period 2010 – 2014 are shown below:

World Bank internet usage 2010 - 2014

Resolution is at the country level, so the country-wide average values are not representative of usage in remote areas of the country (i.e., the Canadian northern territories).  Nonetheless, the map of the global distribution of Internet users is an interesting result that is quickly available from World Bank data.

The World Bank website look like an interesting site to explore at your leisure.

Shrinking of Antarctic Ice Shelves is Accelerating

Peter Lobner

A new study of the Antarctic ice shelf by Scripps Institution of Oceanography and University of California San Diego presents, for the first time, high-resolution maps (about 30 km by 30 km) of ice thickness changes at three-month time steps during the 18-year period from 1994 – 2012. This data set has allowed scientists to quantify how the rate of thinning varies at different parts of the same ice shelf during a given year, and between different years.

The report was accepted on 11 March 2015 for publication in Science. The abstract reads as follows:

The floating ice shelves surrounding the Antarctic Ice Sheet restrain the grounded ice-sheet flow. Thinning of an ice shelf reduces this effect, leading to an increase in ice discharge to the ocean. Using eighteen years of continuous satellite radar altimeter observations we have computed decadal-scale changes in ice-shelf thickness around the Antarctic continent. Overall, average ice-shelf volume change accelerated from negligible loss at 25 ± 64 km3 per year for 1994-2003 to rapid loss of 310 ± 74 km3 per year for 2003-2012. West Antarctic losses increased by 70% in the last decade, and earlier volume gain by East Antarctic ice shelves ceased. In the Amundsen and Bellingshausen regions, some ice shelves have lost up to 18% of their thickness in less than two decades.

 An overview of the results of this study is shown in the following map by Scripps Institution of Oceanography and UCSD.

antarctica-map-e1427758816392

You can read more about this study at the following link:

http://earthsky.org/earth/shrinking-of-antarctic-ice-shelves-is-accelerating?utm_source=EarthSky+News&utm_campaign=6a57484c50-EarthSky_News&utm_medium=email&utm_term=0_c643945d79-6a57484c50-394288401

To see what’s happening to the Arctic ice sheet, check out the 23 March 2015 Pete’s Lynx posting, “2014 – 2015 Arctic sea ice maximum extent was lowest yet recorded.”

Spitzer Space Telescope “Warm Mission” Continued into 2020

Peter Lobner

Updated 19 February 2020

The Spitzer Space Telescope, an infrared space observatory, was launched on 8 August 2003 into an “earth-trailing” orbit around the Sun. It is one of four “Great Observatories” launched by NASA; the others being the Hubble Space Telescope, the Compton Gamma-ray Observatory; and the Chandra X-ray Observatory.

Spitzer_Telescope_Handbook013   Diagram source: NASA

The primary mirror is 85 cm in diameter, made of beryllium, and until May 2009, was cooled by liquid helium to 5.5 degrees K. With the on-board liquid helium supply exhausted, most of the instruments were no longer usable. However, the two shortest wavelength modules of the Infrared Science Archive (IRAC) camera remained operable at their original sensitivities. This allowed the mission team to continue with the “Spitzer Warm Mission”.

You can read about the design of the Spitzer Space Telescope at the following link:

http://irsa.ipac.caltech.edu/data/SPITZER/docs/spitzermission/missionoverview/spitzertelescopehandbook/9/

An example of an image from the Spitzer Space Telescope is this view of Eta Carinae:

The tortured clouds of Eta Carinae  Photo source: NASA

You can see this and many other images from the Spitzer telescope, and related image data, at the following NASA / JPL / Caltech website:

http://www.spitzer.caltech.edu

Update 19 February 2020

On 30 January 2020, NASA reported,

“After more than 16 years studying the universe in infrared light, revealing new wonders in our solar system, our galaxy and beyond, NASA’s Spitzer Space Telescope’s mission has come to an end…..the spacecraft was placed in a safe mode, ceasing all scientific operations.”

You can read the NASA announcement and a summary of the accomplishments of the Spitzer mission here:

http://www.spitzer.caltech.edu/news/2252-ssc2020-08-NASA-s-Spitzer-Space-Telescope-Ends-Mission-of-Astronomical-Discovery

Next Generation Science Standards (NGSS) for K – 12 students

Peter Lobner

Based on the National Research Council’s, “A Framework for K-12 Science Education,” the new NAP publication, “Next Generation Science Standards,” identifies “the science” all K-12 students should know. It is claimed that the NGSS present a vision of science and engineering learning designed to bring these subjects alive for all students, emphasizing the satisfaction of pursuing compelling questions and the joy of discovery and invention. You might find it interesting to review the topic-specific “Performance Expectations” at the various grade levels.

NGSS coverSource:  NAP

A separate document, “Guide to Implementing the NGSS,” is intended to provide guidance to district and school leaders and teachers charged with developing a plan and implementing the NGSS.

If you have set up a MyNAP account as described in my 14 March 2015 post, you can download pdf copies of these documents for free from NAP at the following link:

http://www.nap.edu/search/?term=next+generation+science+standards

7 January 2017 Update – Infographic – science and engineering practices

In January 2017, NAP published the following infographic poster (click the image to enlarge) and a corresponding interactive version that highlight science and engineering practices that should be mastered in STEM classroom.  You can download this poster at the following link:

https://www.nap.edu/visualizations/practices-for-k-12-classrooms/

NAP STEM chartSource:  NAP

The Svalbard Global Seed Vault Provides a Genetic Agricultural Safety Net

Peter Lobner

The Svalbard Global Seed Vault, which was opened in 2008 by the Norwegian government, is a secure seed bank on the Norwegian island of Spitsbergen in the remote Arctic Svalbard archipelago, about 1,300 kilometres from the North Pole. The mission of the Seed Vault is to provide a safety net against accidental loss of diversity in traditional agricultural genebanks.

svalbard-map

Svalbard Global Seed Vault

From all across the globe, crates of seeds are sent here for safe and secure long-term storage in cold and dry rock vaults.

Read more about the Svalbard Global Seed Vault at the following link:

https://www.regjeringen.no/en/topics/food-fisheries-and-agriculture/agriculture/svalbard-global-seed-vault/id462220/

A new documentary film, “Seeds of Time,” tracks the history and mission of the Svalbard Global Seed Vault, and its founder Cary Fowler. The film is due to be released on 22 May 2015. You can see the trailer for this movie at the following link:

http://earthsky.org/earth/seeds-of-time-to-hit-theaters-in-may?utm_source=EarthSky+News&utm_campaign=5c4858146d-EarthSky_News&utm_medium=email&utm_term=0_c643945d79-5c4858146d-394288401

NASA’s Opportunity Rover Just Completed an 11-year Marathon on Mars

Peter Lobner

The Opportunity rover landed on Mars on January 25, 2004. It originally was designed for a 90 Sol mission (a Sol, one Martian day, is slightly longer than an Earth day at 24 hours and 37 minutes). The rover has proven to be far more durable than expected.  A marathon is a long-distance running event with an official distance of 42.195 kilometers (26 miles and 385 yards).  The rover Opportunity is the first extraterrestrial rover to complete this distance. The record time for this event was 11 years and 2 months.

Opportunity rover Rover Opportunity; source:  NASA

Opportunity path om Mars 26+ miles    Map of the marathon trek; source: NASA

8 July 2015 Update:

On 2 July 2015, NASA/JPL uploaded an 8-minute time-lapse video of rover Opportunity’s marathon road trip on Mars. This compilation of images from the low-resolution, wide-field-of-view hazard-avoidance cameras on rover Opportunity between January 2004 and April 2015 shows the rover’s-eye-view of the Martian marathon from its landing location to the rim of Endeavour Crater. The sound in the video is synthesized from accelerometers on rover Opportunity.  You can view this video using the link below.  The view from the rover is in the left-hand panel, and a map of the rover’s path is on the right-hand panel of the video.

The URL for this embedded video is:

https://www.youtube.com/watch?v=3b1DxICZbGc&feature=youtu.be

Virtual Reality Headsets Coming to Market Slower Than Expected Because Many Induce Motion Sickness

Peter Lobner

At the recent Game Developers Conference in San Francisco, several developers of virtual reality systems designed to immerse players in 3-D games and video acknowledged problems with users suffering from motion sickness. The big players in this market include Oculus VR teamed with Samsung (Oculus Rift), Sony (Project Morpheus), and Microsoft (HoloLens).

OculusRift Oculus Rift

PS4-VR-Headset Sony Project Morpheus PS4

microsoft-hololens-4 Microsoft HoloLens

In an interview at the developer conference, Gabe Newell, the president and co-founder of Valve, said he, too, had reacted badly to most headset demonstrations, describing them as the “world’s best motion sickness inducers.”

Read more about this issue at the following link:

http://www.nytimes.com/2015/03/05/technology/solution-to-nausea-puts-virtual-reality-closer-to-market.html?_r=0

One solution proposed by researchers at Purdue University is to add a virtual reality “nose” in the middle of the user’s field of vision in virtual reality, right where it would be in real life.

Read more about this novel solution at the following link:

http://motherboard.vice.com/read/this-virtual-nose-is-the-latest-solution-to-virtual-realitys-sickness-problem?utm_source=howtogeek&utm_medium=email&utm_campaign=newsletter