Tag Archives: EPA

Cow Farts Could be Subject to Regulation Under a New California Law

Peter Lobner

On 19 September 2016, California Governor Jerry Brown signed into law Senate Bill No. 1383 that requires the state to cut methane (CH4) emissions by 40% from 2013 levels by 2030. Now before I say anything about this bill and the associated technology for bovine methane control, you have an opportunity to read the full text of SB 1383 at the following link:

https://leginfo.legislature.ca.gov/faces/billNavClient.xhtml?bill_id=201520160SB1383

You’ll also find a May 2016 overview and analysis here:

https://www.ceres.org/files/water/sb-1383-slcp-summary/at_download/file

The problem statement from the cow’s perspective:

Cows are ruminants with a digestive system that includes a few digestive organs not found in the simpler monogastric digestive systems of humans and many other animals. Other ruminant species include sheep, goat, elk, deer, moose, buffalo, bison, giraffes and camels. Other monogastric species include apes, chimpanzees, horses, pigs, chickens and rhinos.

As explained by the BC Agriculture in the Classroom Foundation:

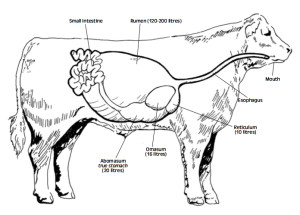
“Instead of one compartment to the stomach they (ruminants) have four. Of the four compartments the rumen is the largest section and the main digestive center. The rumen is filled with billions of tiny microorganisms that are able to break down (through a process called enteric fermentation) grass and other coarse vegetation that animals with one stomach (including humans, chickens and pigs) cannot digest.

 Ruminant animals do not completely chew the grass or vegetation they eat. The partially chewed grass goes into the large rumen where it is stored and broken down into balls of “cud”. When the animal has eaten its fill it will rest and “chew its cud”. The cud is then swallowed once again where it will pass into the next three compartments—the reticulum, the omasum and the true stomach, the abomasum.”

Cow digestive system

Source: BC Agriculture in the Classroom Foundation

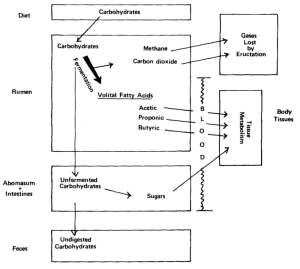
Generation of methane and carbon dioxide in ruminants results from their digestion of carbohydrates in the rumen (their largest digestive organ) as shown in the following process diagram. Cows don’t generate methane from metabolizing proteins or fats.

Cow digestion of carbs

Source: Texas Agricultural Extension Service

You’ll find the similar process diagrams for protein and fat digestion at the following link:

http://animalscience.tamu.edu/wp-content/uploads/sites/14/2012/04/nutrition-cows-digestive-system.pdf

Argentina’s National Institute for Agricultural Technology (INTA) has conducted research into methane emissions from cows and determined that a cow produces about 300 liters of gas per day. At standard temperature and pressure (STP) conditions, that exceeds the volume of a typical cow’s rumen (120 – 200 liters), so frequent bovine farting probably is necessary for the comfort and safety of the cow.

The problem statement from the greenhouse gas perspective:

The U.S. Environmental Protection Agency (EPA) reported U.S. greenhouse gas emissions for the period from 1990 to 2014 in document EPA 430-R-16-002, which you can download at the following link:

https://www3.epa.gov/climatechange/Downloads/ghgemissions/US-GHG-Inventory-2016-Main-Text.pdf

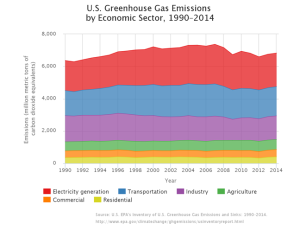
Greenhouse gas emissions by economic sector are shown in the following EPA chart.

us-greenhouse-gas-emissions-economic-1990-2014

For the period from 1990 to 2014, total emissions from the agricultural sector, in terms of CO2 equivalents, have been relatively constant.

Regarding methane contributions to greenhouse gas, the EPA stated:

“Methane is emitted during the production and transport of coal, natural gas, and oil. Methane emissions also result from livestock and other agricultural practices and by the decay of organic waste in municipal solid waste landfills.

Also, when animals’ manure is stored or managed in lagoons or holding tanks, CH4 is produced. Because humans raise these animals for food, the emissions are considered human-related. Globally, the Agriculture sector is the primary source of CH4 emissions.”

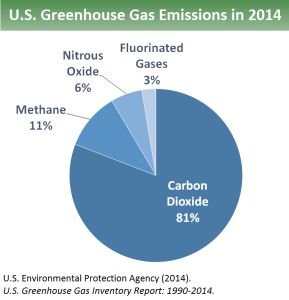
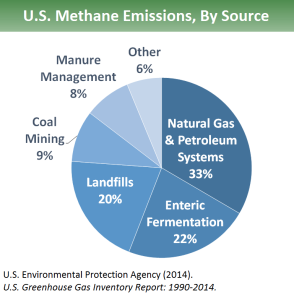
The components of U.S. 2014 greenhouse gas emissions and a breakdown of methane sources are shown in the following two EPA charts.

Sources of GHG

Sources of Methane

In 2014, methane made up 11% of total U.S. greenhouse gas emissions. Enteric fermentation is the process that generates methane in the rumen of cows and other ruminants, which collectively contribute 2.42% to total U.S. greenhouse gas emissions. Manure management from all sorts of farm animals collectively contributes another 0.88% to total U.S. greenhouse gas emissions.

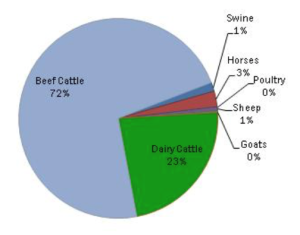
EPA data from 2007 shows the following distribution of sources of enteric fermentation among farting farm animals.

Animal sources of methane

Source: EPA, 2007

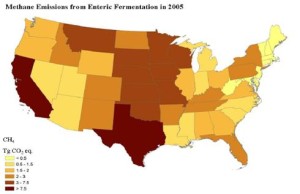
So it’s clear that cattle are the culprits. By state, the distribution of methane production from enteric fermentation is shown in the following map.

State sources of methane

Source: U.S. Department of Agriculture, 2005

On this map, California and Texas appear to be the largest generators of methane from ruminants. More recent data on the cattle population in each state as of 1 January 2015 is available at the following link:

http://www.cattlenetwork.com/advice-and-tips/cowcalf-producer/cattle-inventory-ranking-all-50-states

Here, the top five states based on cattle population are: (1) Texas @ 11.8 million, (2) Nebraska @ 6.3 million, (3) Kansas @ 6.0 million, (4) California @ 5.2 million, and (5) Oklahoma @ 4.6 million.  Total U.S. population of cattle and calves is about 89.5 million.

This brings us back to California’s new law.

The problem statement from the California legislative perspective:

The state has the power to do this, as summarized in the preamble in SB 1383:

“The California Global Warming Solutions Act of 2006 designates the State Air Resources Board as the state agency charged with monitoring and regulating sources of emissions of greenhouse gases. The state board is required to approve a statewide greenhouse gas emissions limit equivalent to the statewide greenhouse gas emissions level in 1990 to be achieved by 2020. The state board is also required to complete a comprehensive strategy to reduce emissions of short-lived climate pollutants, as defined, in the state.”

Particular requirements that apply to the state’s bovine population are the following:

“Work with stakeholders to identify and address technical, market, regulatory, and other challenges and barriers to the development of dairy methane emissions reduction projects.” [39730.7(b)(2)(A)]

“Conduct or consider livestock and dairy operation research on dairy methane emissions reduction projects, including, but not limited to, scrape manure management systems, solids separation systems, and enteric fermentation.” [39730.7(b)(2)(C)(i)]

“Enteric emissions reductions shall be achieved only through incentive-based mechanisms until the state board, in consultation with the department, determines that a cost-effective, considering the impact on animal productivity, and scientifically proven method of reducing enteric emissions is available and that adoption of the enteric emissions reduction method would not damage animal health, public health, or consumer acceptance. Voluntary enteric emissions reductions may be used toward satisfying the goals of this chapter.” [39730.7(f)]

By 1 July 2020, the State Air Resources Board is  required to assess the progress made by the dairy and livestock sector in achieving the goals for methane reduction. If this assessment shows that progress has not been made because of insufficient funding, technical or market barriers, then the state has the leeway to reduce the goals for methane reduction.

Possible technical solution

As shown in a chart above, several different industries contribute to methane production. One way to achieve most of California’s 40% reduction goal in the next 14 years would be to simply move all cattle and dairy cow businesses out of state and clean up the old manure management sites. While this actually may happen for economic reasons, let’s look at some technical alternatives.

  • Breed cows that generate less methane
  • Develop new feed for cows, which could help cows better digest their food and produce less methane.
  • Put a plug in it
  • Collect the methane from the cows

Any type of genetically modified organism (GMO) doesn’t go over well in California, so I think a GMO reduced methane producing cow is simply a non-starter.

A cow’s diet consists primarily of carbohydrates, usually from parts of plants that are not suitable as food for humans and many other animals. The first step in the ruminant digestion process is fermentation in the rumen, and this is the source of methane gas. The only option is to put cows on a low-carb diet. That would be impossible to implement for cows that are allowed to graze in the field.

Based on a cow’s methane production rate, putting a cork in it is a very short-term solution, at best, and you’ll probably irritate the cow.  However, some humorists find this to be an option worthy of further examination.

Source: Taint

That leaves us with the technical option of collecting the methane from the cows. Two basic options exist: collect the methane from the rumen, or from the other end of the cow. I was a bit surprised that several examples of methane collecting “backpacks” have been developed for cows. Unanimously, and much to the relief of the researchers, the international choice for methane collection has been from the rumen.

So, what does a fashionable, environmentally-friendly cow with a methane-collecting backpack look like?

Argentina’s INTA took first place with the sleek blue model shown below.

Argentine cowSource: INTA

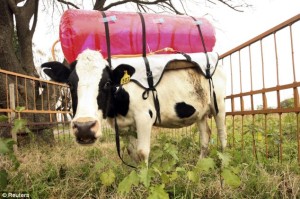
Another INTA example was larger and more colorful, but considerably less stylish. Even if this INTA experiment fails to yield a practical solution for collecting methane from cows, it clearly demonstrates that cows have absolutely no self-esteem.

Daily Mail cow methane collectorSource: INTA

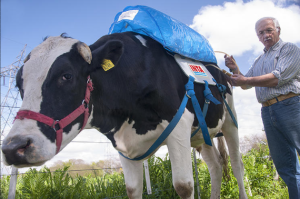
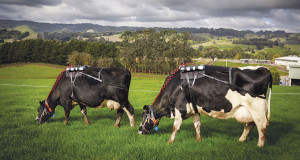
In Australia, these cows are wearing smaller backpacks just to measure their emissions.

Australian cowSource: sciencenews.org

Time will tell if methane collection devices become de rigueur for cattle and dairy cows in California or anywhere else in the world. While this could spawn a whole new industry for tending those inflating collection devices and making productive use of the collected methane, I can’t imagine that the California economy could actually support the cost for managing such devices for all of the state’s 5.2 million cattle and dairy cows.

Of all the things we need in California, managing methane from cow farts (oops, I meant to say enteric fermentation) probably is at the very bottom of most people’s lists, unless they’re on the State Air Resources Board.

20 February 2019 Update:  “Negative Emissions Technology” (NET) may be an appropriate solution to methane production from ruminent animals

 In my 19 February 2019 post, “Converting Carbon Dioxide into Useful Products,” I discussed the use of NETs as a means to reduce atmospheric carbon dioxide by deploying carbon dioxide removal “factories” that can be sited independently from the sources of carbon dioxide generation.  An appropriately scaled and sited NET could mitigate the effects of methane released to the atmosphere from all ruminent animals in a selected region, with the added benefit of not interfering directly with the animals.  You can read my post here:

https://lynceans.org/all-posts/converting-carbon-dioxide-into-useful-products/
Is EPA Fudging the Numbers for its Carbon Regulation?

Peter Lobner

In my 2 July 2015 post, I commented on significant deficiencies in the U.S. Environmental Protection Agency (EPA) Clean Power Plan proposed rule. On 3 August 2015, the EPA announced the final rule. You can read the final rule for existing power plants, the EPA’s regulatory impact analysis, and associated fact sheets at the following link:

http://www2.epa.gov/cleanpowerplan/clean-power-plan-existing-power-plants

The Institute for Energy Research (IER) is a not-for-profit organization that conducts research and analysis on the functions, operations, and government regulation of global energy markets. The IER home page is at the following link:

http://instituteforenergyresearch.org

On 24 November 2015, the IER published an insightful article entitled, Is EPA Fudging the Numbers for its Carbon Regulation?, which I believe is worth your attention. The IER’s main points are:

  1. U.S. Energy Information Agency’s (EIA) Annual Energy Outlook (AEO) is the data source usually used by federal government agencies in their analysis of energy issues.
  2. EPA stands out as an exception. It frequently chooses not to use EIA data, and instead develops it’s own duplicative, different data.
  3. In the case of the Clean Power Plan, the EPA’s own data significantly underestimates the number of coal plants that need to be retired to comply with the Plan. The result is a much lower estimate of the economic impact of the Plan than if EIA data had been used.

It appears to me that the EPA created and used data skewed to produce a more favorable, but likely unrealistic, estimate of the economic impact that will borne by the U.S. power industry and power customers as the Clean Power Plan is implemented. Form your own opinion after reading the full IER article at the following link:

http://instituteforenergyresearch.org/analysis/is-epa-fudging-the-numbers-for-its-carbon-regulation/

Update 19 Feb 2016

On 8 February 2016, the American Nuclear Society (ANS) released their, “Nuclear in the States Toolkit Version 1.0 – Policy Options for States Considering the Role of Nuclear Power in Their Energy Mix.” The toolkit catalogs policies related to new and existing nuclear reactors for state policymakers to consider as they draft their Clean Power Plan compliance strategies.   The Toolkit identifies a range of policy options that individually or in aggregate can make nuclear generation a more attractive generation alternative for states and utilities.

You can download this document at the following link:

http://nuclearconnect.org/wp-content/uploads/2016/02/ANS-NIS-Toolkit-download.pdf

On 9 February 2016, the U.S. Supreme Court issues a stay on implementation of the EPA’s Clean Power Plan (CPP) pending the resolution of legal challenges to the program in court.

The ANS noted that, “….the stay provides them (the states) an opportunity to take a new look at the carbon offsets that existing nuclear plants provide, which they weren’t encouraged to do under the CPP rules.”

EPA Clean Power Plan Proposed Rule Does Not Adequately Recognize the Role of Nuclear Power in Greenhouse Gas Reduction

Peter Lobner

On June 2, 2014, the U.S. Environmental Protection Agency (EPA) proposed what they called, “a common sense plan to cut carbon pollution from power plants.”  You can access the Clean Power Plan Proposed Rule and many related documents at the following EPA link:

http://www2.epa.gov/carbon-pollution-standards/clean-power-plan-proposed-rule

This Plan proposes to limit carbon emissions from existing fossil fuel fired electric generating units, including steam generating, integrated gasification combined cycle, or stationary combustion turbines (in either simple-cycle or combined-cycle configuration) operating or under construction by January 8, 2014. Main points of the Clean Power Plan include:

  • Wind and solar power are the preferred EPA options.
  • Natural gas is an interim solution.
  • New nuclear capacity is not a compliance option.
  • The EPA allows compliance credit for:
    • New nuclear plants currently under construction, and
    • Preservation of existing nuclear plants that might otherwise be retired

I’ve already formed my opinion on the Clean Power Plan. To help you form your opinion, I recommend that you refer to the following recent analyses by four respected government and industry organizations that have reviewed the Clean Power Plan.

Institute for Energy Research (IER)

On 15 June 2015, the IER issued the results of their analysis entitled, EPA’s Clean Power Plan Ignores New Nuclear as a Compliance Option. IER concluded that the compliance formulae in the Clean Power Plan are biased toward new wind and solar power development. Deployment of these technologies, which currently are not capable of delivering reliable capacity, will decrease the reliability of the electric grid. IER also concluded that the Clean Power Plan will result in much higher electricity prices for all American consumers, while having only a marginal impact on global temperature based on EPA’s computer models.

You can read the IER analysis at the following link:

http://instituteforenergyresearch.org/analysis/epas-clean-power-plan-ignores-new-nuclear-as-a-compliance-option/

National Association of Clean Air Agencies (NACAA)

On 21 May 2015, the NACAA issued a report entitled, Implementing EPA’s Clean Power Plan: A Menu of Options, containing 25 chapters, each of which explores a particular approach to greenhouse gas (GHG) reduction in the electric power sector.  NACAA is a nonpartisan, nonprofit association of air pollution control agencies in 41 states, the District of Columbia, four territories and 116 metropolitan areas.  Each chapter of their Menu of Options includes a brief descriptions of: (1) the option and it’s pros and cons; (2) the regulatory backdrop, policy underpinnings, implementation experience, and GHG reduction potential associated with the option; and (3) benefits of the option to society and the utility system, including costs and cost-effectiveness. In the last chapter, a variety of emerging technologies and other policy options for reducing GHG emissions are addressed.

An interesting table and two figures included in Chapter 6 of the Menu of Options are reproduced below.

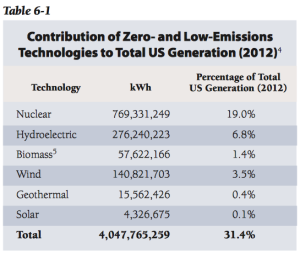
NACAA Table 6-1 Source: NACAA

In 2012, electric power generation technologies with zero or low GHG emissions accounted for 31.4% of the USA’s total generating capacity. The data in Table 6-1 shows that 82.2% of the zero or low GHG emission generating capacity came from nuclear and hydroelectric power plants. The remaining low-emission generation capacity came from biomass, wind, geothermal, and solar power plants.

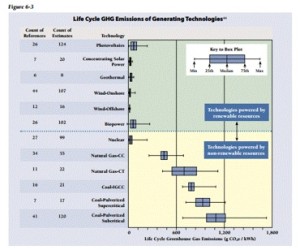
NACAA Figure 6-3Source: NACAA

In Figure 6-3, “life cycle GHG emissions” include those associated with operation as well as construction, fabrication, and fuel processing.  While nuclear power is not included among the “technologies powered by renewable resources”, it’s clear in Figure 6-3 that nuclear power meets the GHG reduction performance of the other technologies using renewable resources.

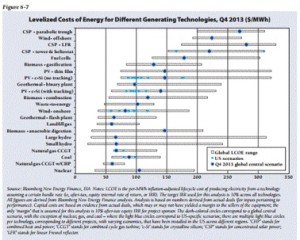
NACAA Figure 6-7  Source: NACAA

In Figure 6-7, note the relative cost-of-energy differential between nuclear power and fossil power. This difference makes it difficult for nuclear power plants to compete head-to-head with coal and natural gas merchant power plants and encourages the early retirement of some nuclear power plants on economic grounds.  While most renewable power sources have even higher costs-of-energy, various financial schemes subsidize their power generation.

You can download individual chapters or the entire NACAA Menu of Options at the following link:

http://www.4cleanair.org/NACAA_Menu_of_Options

U.S. Energy Information Administration (EIA)

On 22 May 2015, the EIA released their analysis of the Clean Power Plan. The EIA analysis supports the IER finding that the Clean Power Plan will result in much higher electricity prices for all American consumers, even in a scenario that allows GHG reduction credit for new nuclear generation.

You can read the EIA press release at the following link:

http://www.eia.gov/analysis/requests/powerplants/cleanplan/

You also can download a PDFs copy of the May 2015 EIA report, Analysis of the Impacts of the Clean Power Plan, at the following link:

http://www.eia.gov/analysis/requests/powerplants/cleanplan/pdf/powerplant.pdf

Nuclear Energy Institute’s (NEI)

To address the “clean power” attributes of nuclear power, I refer you to an NEI Knowledge Center webpage: Environment: Emissions Prevented, which you will find at the following link:

http://www.nei.org/Knowledge-Center/Nuclear-Statistics/Environment-Emissions-Prevented

Here you’ll find a link to data on the amount of sulfur dioxide, nitrogen oxides, and carbon dioxide emissions avoided in the U.S. during the years 1995 to 2014 by virtue of having about 20% of U.S. electric power generated by nuclear power plants instead of fossil power plants. NEI reports the total avoided emissions for this period as follows:

  • Sulfur dioxide: 57.75 million short tons (52.4 million metric tons)
  • Nitrogen oxides: 22.92 million short tons (20.8 million metric tons)
  • Carbon dioxide: 13,063.6 million short tons (11,851 million metric tons)

On this website, NEI states:

“Nuclear energy facilities avoided 595 million metric tons of carbon dioxide in 2014 across the U.S. This is nearly as much carbon dioxide as is released from nearly 135 million cars, which is more than all U.S. passenger cars. The U.S. produces more than five billion metric tons of carbon dioxide each year.

Without the emission avoidances from nuclear generation, required reductions in the U.S. would increase by more than 50 percent to achieve targets under the Kyoto Protocol.”

2013 paper, “Prevented Mortality and Greenhouse Gas Emissions from Historical and Projected Nuclear Power”.

Supporting the above NEI position on the GHG reduction merits of nuclear power, there is a related 2013 article by NASA scientists from Goddard Institute for Space Studies and Columbia University entitled, “Prevented Mortality and Greenhouse Gas Emissions from Historical and Projected Nuclear Power”.  You can read a short article on this paper on the Scientific American website at the following link:

http://blogs.scientificamerican.com/the-curious-wavefunction/nuclear-power-may-have-saved-1-8-million-lives-otherwise-lost-to-fossil-fuels-may-save-up-to-7-million-more/

You also can read the complete paper at the following link:

http://pubs.acs.org/doi/pdf/10.1021/es3051197

In their study, authors Pushker A. Kharecha and James E. Hansen used historical production data from 1971 to 2009 and calculated that global nuclear power has prevented an average of 1.84 million air pollution-related deaths and 64 gigatonnes of CO2-equivalent (GtCO2-eq) greenhouse gas (GHG) emissions that would have resulted from fossil fuel burning. From their analysis, the authors drew the following conclusion:

“In conclusion, it is clear that nuclear power has provided a large contribution to the reduction of global mortality and GHG emissions due to fossil fuel use. If the role of nuclear power significantly declines in the next few decades, the International Energy Agency asserts that achieving a target atmospheric GHG level of 450 ppm CO2-eq would require “heroic achievements in the deployment of emerging low- carbon technologies, which have yet to be proven. Countries that rely heavily on nuclear power would find it particularly challenging and significantly more costly to meet their targeted levels of emissions.”

So, what do you think about the EPA’s proposed Clean Power Plan? Is this the “common sense plan to cut carbon pollution from power plants” promised by EPA; a politically motivated piece of crap designed to kill the nuclear and coal power industries; or something in between?