Peter Lobner
1. New process for manufacturing bio-fuel
The Joint BioEnergy Institute (JBEI) is a Department of Energy (DOE) bioenergy research center dedicated to developing advanced bio-fuels, which are liquid fuels derived from the solar energy stored in plant biomass. Such fuels currently are replacing gasoline, diesel and jet fuels in selected applications.
On 1 July 2016, a team of Lawrence Berkeley National Laboratory (LBNL) and Sandia National Laboratories (SNL) scientists working at JBEI published a paper entitled, “CO2 enabled process integration for the production of cellulosic ethanol using bionic liquids.” The new process reported in this paper greatly simplifies the industrial manufacturing of bio-fuel and significantly reduces waste stream volume and toxicity as well as manufacturing cost.
The abstract provides further information:
“There is a clear and unmet need for a robust and affordable biomass conversion technology that can process a wide range of biomass feedstocks and produce high yields of fermentable sugars and bio-fuels with minimal intervention between unit operations. The lower microbial toxicity of recently developed renewable ionic liquids (ILs), or bionic liquids (BILs), helps overcome the challenges associated with the integration of pretreatment with enzymatic saccharification and microbial fermentation. However, the most effective BILs known to date for biomass pretreatment form extremely basic pH solutions in the presence of water, and therefore require neutralization before the pH range is acceptable for the enzymes and microbes used to complete the biomass conversion process. Neutralization using acids creates unwanted secondary effects that are problematic for efficient and cost-effective biorefinery operations using either continuous or batch modes.
We demonstrate a novel approach that addresses these challenges through the use of gaseous carbon dioxide to reversibly control the pH mismatch. This approach enables the realization of an integrated biomass conversion process (i.e., “single pot”) that eliminates the need for intermediate washing and/or separation steps. A preliminary technoeconomic analysis indicates that this integrated approach could reduce production costs by 50–65% compared to previous IL biomass conversion methods studied.”
Regarding the above abstract, here are a couple of useful definitions:
- Ionic liquids: powerful solvents composed entirely of paired ions that can be used to dissolve cellulosic biomass into sugars for fermentation.
- Enzymatic saccharification: breaking complex carbohydrates such as starch or cellulose into their monosaccharide (carbohydrate) components, which are the simplest carbohydrates, also known as single sugars.
The paper was published on-line in the journal, Energy and Environmental Sciences, which you can access via the following link:
http://pubs.rsc.org/en/content/articlelanding/2016/ee/c6ee00913a#!divAbstract
Let’s hope they’re right about the significant cost reduction for bio-fuel production.
2. Operational use of bio-fuel
One factor limiting the wide-scale use of bio-fuel is its higher price relative to the conventional fossil fuels it is intended to replace. The prospect for significantly lower bio-fuel prices comes at a time when operational use of bio-fuel is expanding, particularly in commercial airlines and in the U.S. Department of Defense (DoD). These bio-fuel users want advanced bio-fuels that are “drop-in” replacements to traditional gasoline, diesel, or jet fuel. This means that the advanced bio-fuels need to be compatible with the existing fuel distribution and storage infrastructure and run satisfactorily in the intended facilities and vehicles without introducing significant operational or maintenance / repair / overhaul (MRO) constraints.
You will find a fact sheet on the DoD bio-fuel program at the following link:
http://www.americansecurityproject.org/dods-biofuels-program/
The “drop in” concept can be difficult to achieve because a bio-fuel may have different energy content and properties than the petroleum fuel it is intended to replace. You can find a Department of Energy (DOE) fuel properties comparison chart at the following link:
http://www.afdc.energy.gov/fuels/fuel_comparison_chart.pdf
Another increasingly important factor affecting the deployment of bio-fuels is that the “water footprint” involved in growing the biomass needed for bio-fuel production and then producing the bio-fuel is considerably greater than the water footprint for conventional hydrocarbon fuel extraction and production.
A. Commercial airline use of bio-fuel:
Commercial airlines became increasingly interested in alternative fuels after worldwide oil prices peaked near $140 in 2008 and remained high until 2014.
A 2009 Rand Corporation technical report, “Near-term Feasibility of Alternative Jet Fuels,” provides a good overview of issues and timescales associated with employment of bio-fuels in the commercial aviation industry. Important findings included:
- Drop-in” fuels have considerable advantages over other alternatives as practical replacements for petroleum-based aviation fuel.
- Alcohols do not offer direct benefits to aviation, primarily because high vapor pressure poses problems for high-altitude flight and safe fuel handling. In addition, the reduced energy density of alcohols relative to petroleum-based aviation fuel would substantially reduced aircraft operating capabilities and would be less energy efficient.
- Biodiesel and biokerosene, collectively known as FAMEs, are not appropriate for use in aviation, primarily because they leave deposits at the high temperatures found in aircraft engines, freeze at higher temperatures than petroleum-based fuel, and break down during storage
You can download this Rand report at the following link
http://www.rand.org/content/dam/rand/pubs/technical_reports/2009/RAND_TR554.pdf
After almost two years of collaboration with member airlines and strategic partners, the International Air Transport Association (IATA) published the report, “IATA Guidance Material for Biojet Fuel Management,” in November 2012. A key finding in this document is the following:
“To be acceptable to Civil Aviation Authorities, aviation turbine fuel must meet strict chemical and physical criteria. There exist several specifications that authorities refer to when describing acceptable conventional jet fuel such as ASTM D1655 and Def Stan 91-91. At the time of issue, blends of up to 50% biojet fuel produced through either the Fischer-Tropsch (FT) process or the hydroprocessing of oils and fats (HEFA – hydroprocessed esters and fatty acids) are acceptable for use under these specifications, but must first be certified under ASTM D7566. Once the blend has demonstrated compliance with the relevant product specifications, it may be regarded as equivalent to conventional jet fuel in most applications.“
You can download this IATA document at the following link:
https://www.iata.org/publications/Documents/guidance-biojet-management.pdf
In 2011, KLM flew the world’s first commercial bio-fuel flight, carrying passengers from Amsterdam to Paris. Also in 2011, Aeromexico flew the world’s first bio-fuel trans-Atlantic revenue passenger flight, from Mexico City to Madrid.
In March 2015, United Airlines (UA) inaugurated use of bio-fuel on flights between Los Angeles (LAX) and San Francisco (SFO). Eventually, UA plans to expand the use of bio-fuel to all flights operating from LAX. UA is the first U.S. airline to use renewable fuel for regular commercial operation.
Many other airlines worldwide are in various stages of bio-fuel testing and operational use.
B. U.S. Navy use of bio-fuel:
The Navy is deploying bio-fuel in shore facilities, aircraft, and surface ships. Navy Secretary Ray Mabus has established a goal to replace half of the Navy’s conventional fuel supply with renewables by 2020.
In 2012, the Navy experimented with a 50:50 blend of traditional petroleum-based fuel and biofuel made from waste cooking oil and algae oil. This blend was used successfully on about 40 U.S. surface ships that participated in the Rim of the Pacific (RIMPAC) exercise with ships of other nations. The cost of pure bio-fuel fuel for this demonstration was about $26.00 per gallon, compared to about $3.50 per gallon for conventional fuel at that time.
In 2016, the Navy established the “Great Green Fleet” (GGF) as a year-long initiative to demonstrate the Navy’s ability to transform its energy use.
![]() Source: U.S. Navy
Source: U.S. Navy
The Navy described this initiative as follows:
“The centerpiece of the Great Green Fleet is a Carrier Strike Group (CSG) that deploys on alternative fuels, including nuclear power for the carrier and a blend of advanced bio-fuel made from beef fat and traditional petroleum for its escort ships. These bio-fuels have been procured by DON (Department of Navy) at prices that are on par with conventional fuels, as required by law, and are certified as “drop-in” replacements that require no engine modifications or changes to operational procedures.”
Deployment of the Great Green Fleet started in January 2016 with the deployment of Strike Group 3 and its flagship, the nuclear-powered aircraft carrier USS John C. Stennis. The conventionally-powered ships in the Strike Group are using a blend of 10% bio-fuel and 90% petroleum. The Navy originally aimed for a 50:50 ratio, but the cost was too high. The Navy purchased about 78 million gallons of blended bio-fuel for the Great Green Fleet at a price of $2.05 per gallon.
C. U.S. Air Force use of bio-fuel:
The USAF has a goal of meeting half its domestic fuel needs with alternative sources by 2016, including aviation fuel.
The Air Force has been testing different blends of jet fuel and biofuels known generically as Hydrotreated Renewable Jet (HRJ). This class of fuel uses triglycerides and free fatty acids from plant oils and animal fats as the feedstock that is processed to create a hydrocarbon aviation fuel.
To meet its energy plan, the USAF plans to use a blend that combines military-grade fuel known as JP-8 with up to 50 percent HRJ. The Air Force also has certified a 50:50 blend of Fisher-Tropsch synthetic kerosene and conventional JP-8 jet fuel across its fleet.
The Air Force Civil Engineer Support Agency (AFCESA), headquartered at Tyndall Air Force Base, Florida is responsible for certifying the USAF aviation fuel infrastructure to ensure its readiness to deploy blended JP-8/bio-fuel.


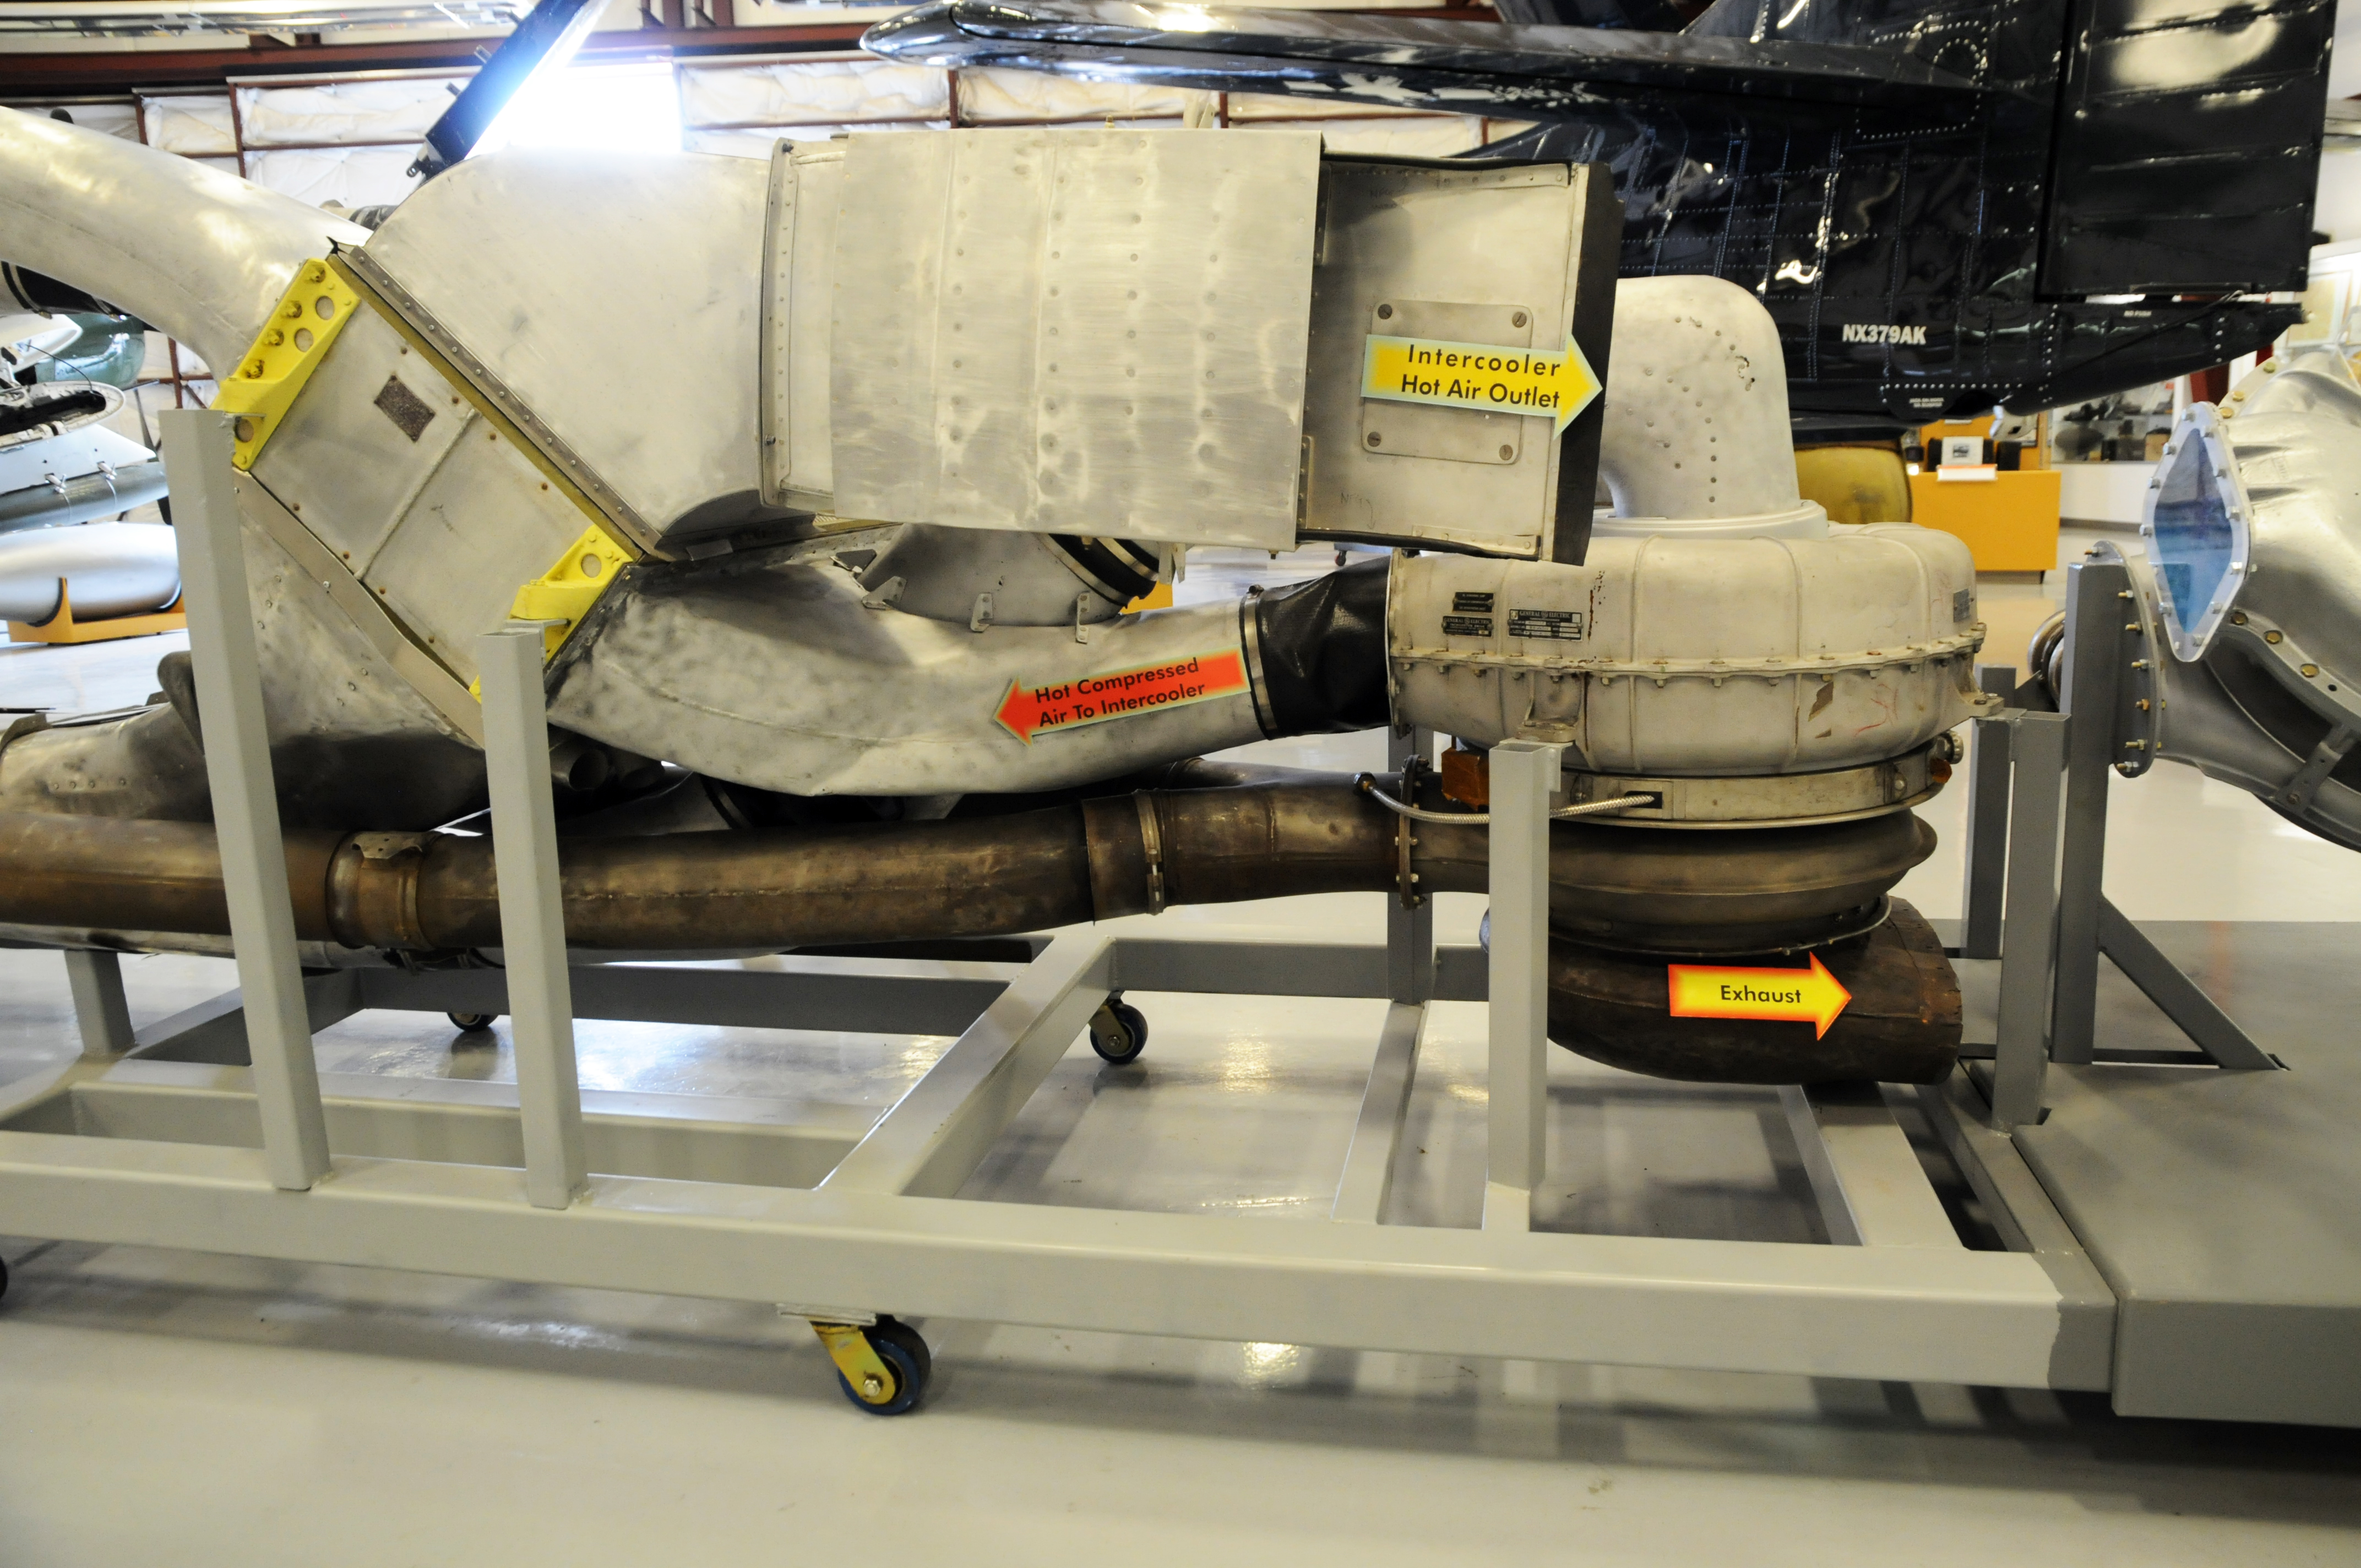
 Source: Author photo
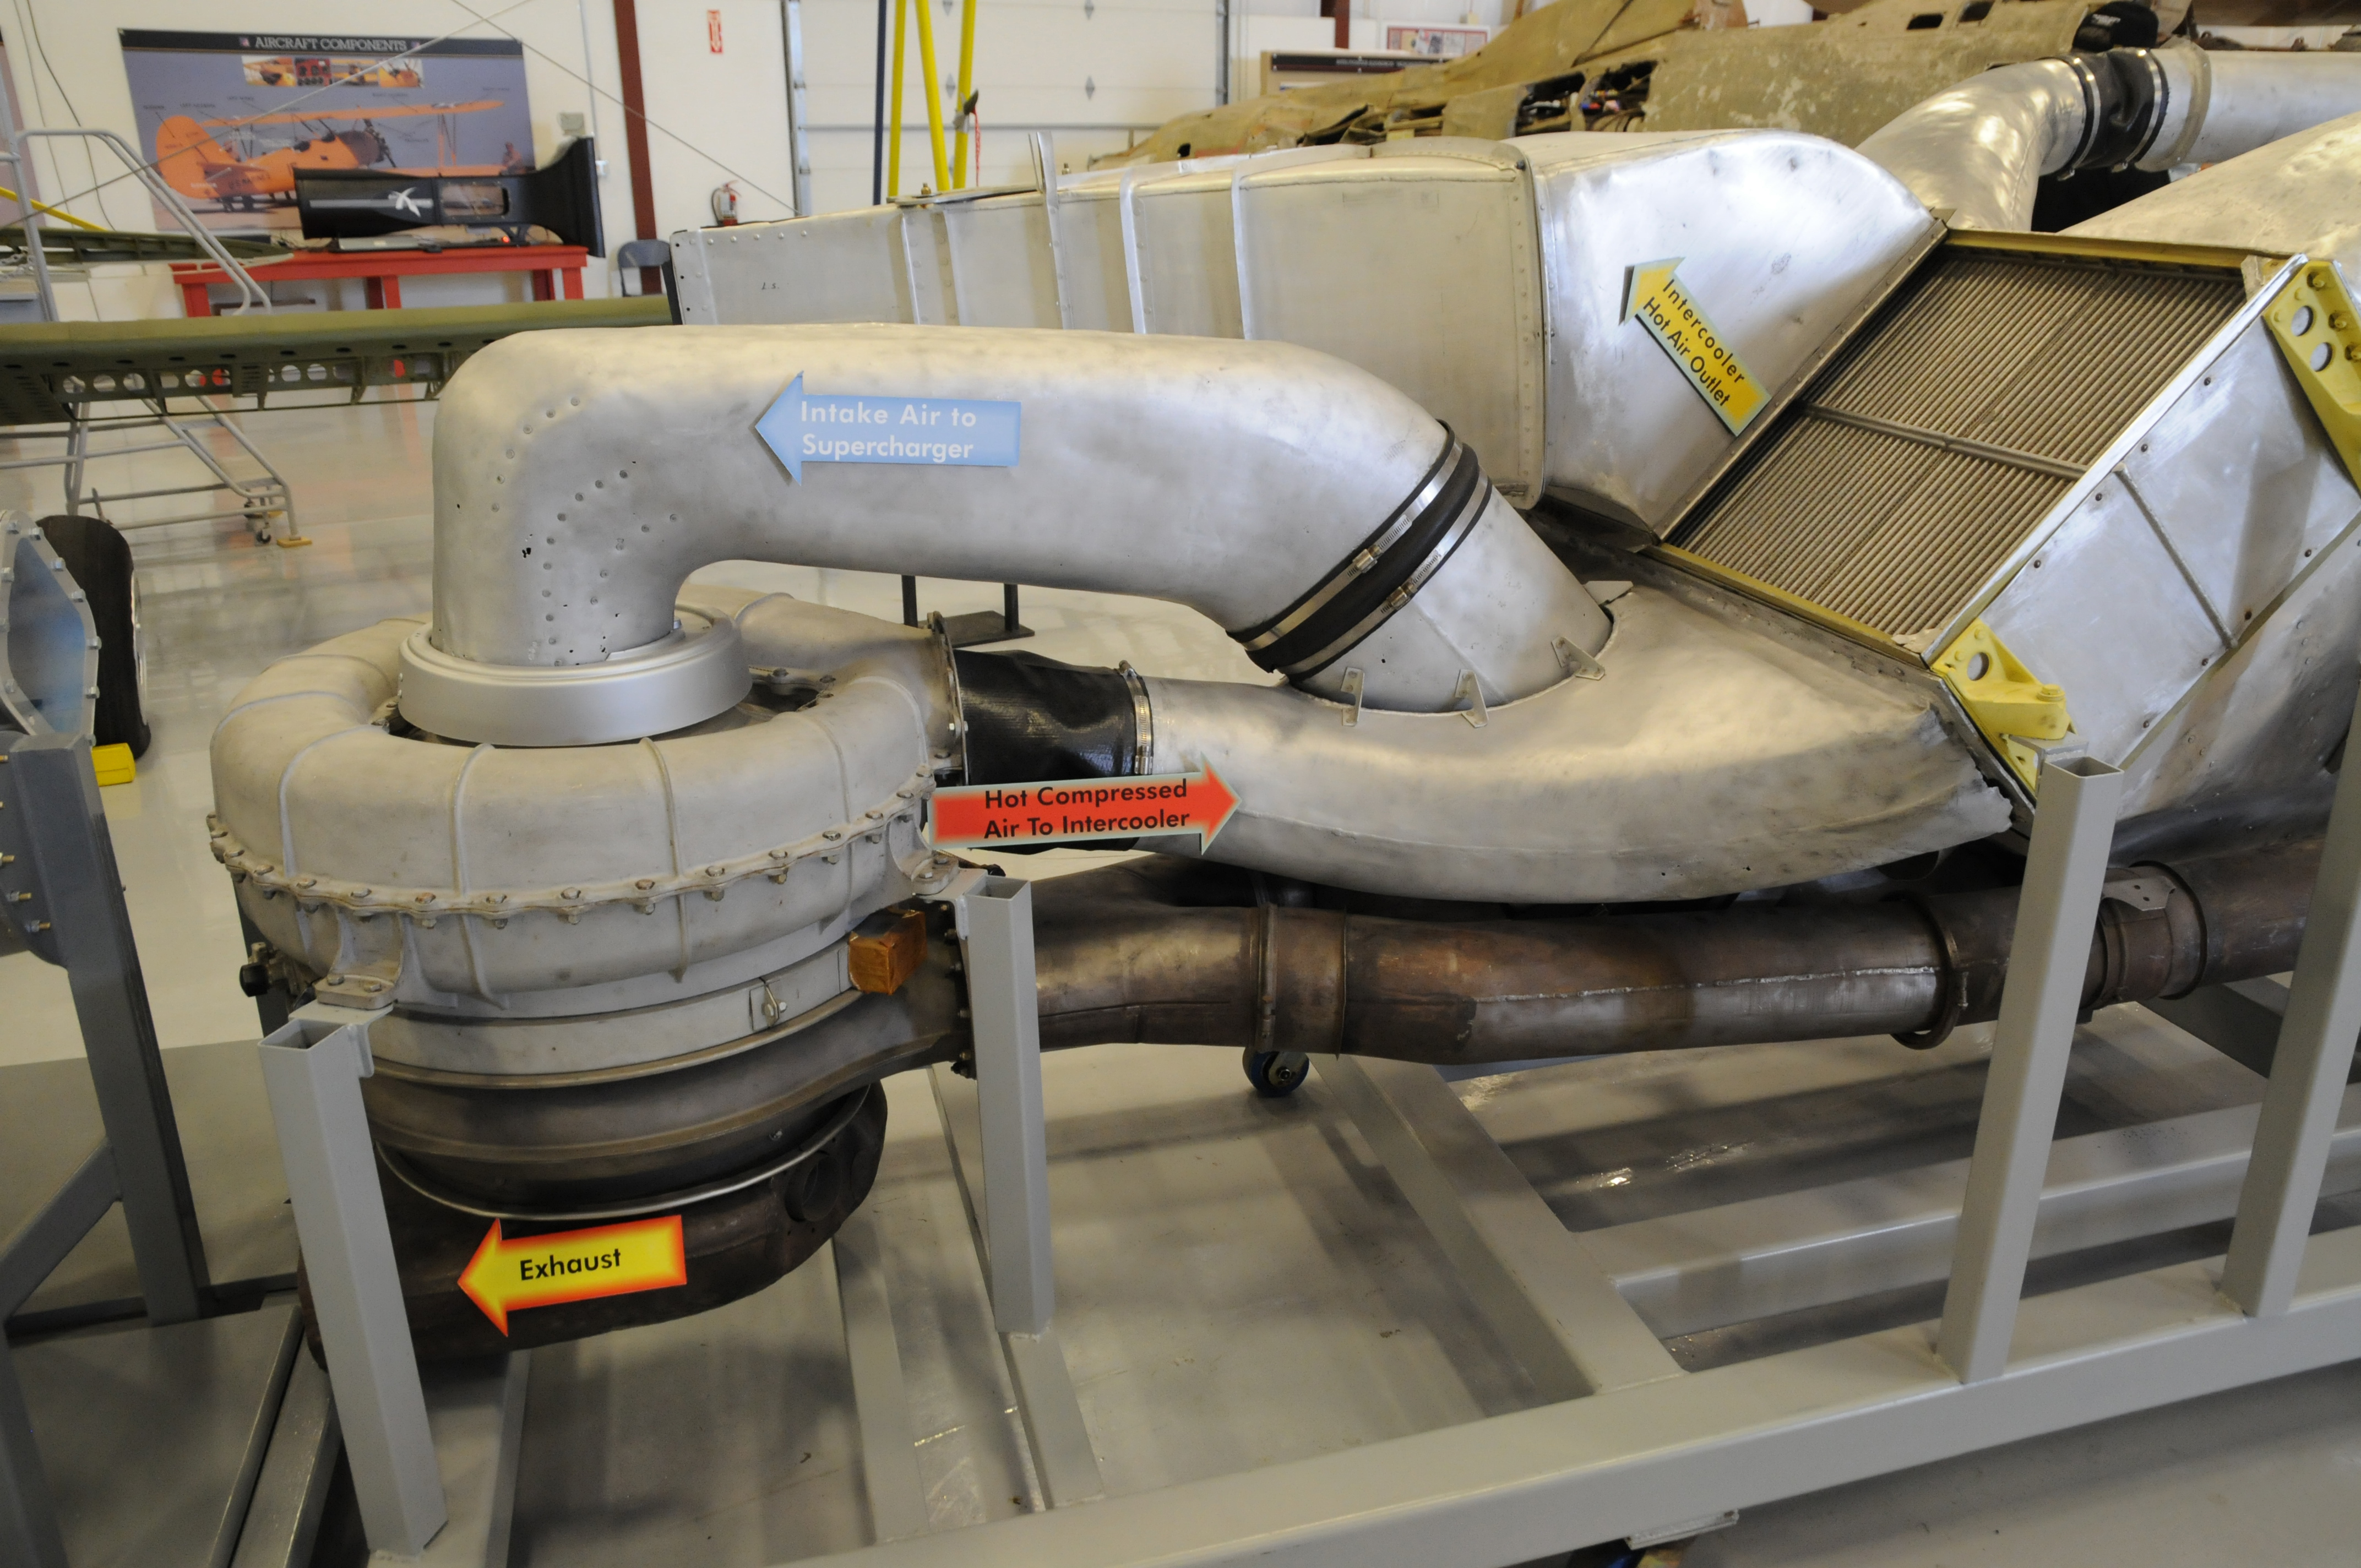