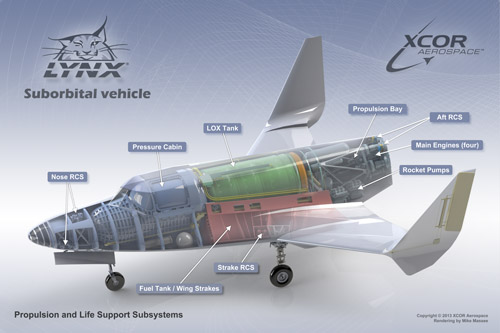
This program should be near and dear to all Lynceans because we share a common mascot with XCOR. The Lynx two-seat, piloted space transport vehicle was intended to take humans and payloads on a half-hour suborbital flight to 100 km (330,000 feet) and then return to a landing at the takeoff runway. Lynx was designed as a horizontal takeoff and horizontal landing vehicle, using its own fully-reusable rocket propulsion system to depart a runway and return safely.
Lynx was designed for aircraft-like operations, with plans for up to four flights per day from any suitable, licensed spaceport. The spacecraft was being designed for 40 flights before planned maintenance actions are needed.
Source: XCOR AerospaceSource: XCOR Aerospace
See details about the planned XCOR commercial space program at the following link:
XCOR Update April 2018: XCOR filed for bankruptcy on 8 November 2017 after it was unable to line up partners or new investors to enable it to complete development of the Lynx spaceplane. A nonprofit organization called Build A Plane purchased XCOR’s assets at auction for just under $1.1 million.
Build A Plane founder Lyn Freeman with unfinished Lynx prototype. Source: Douglas Messier/Space.com
You can read more about the bankruptcy filing here:
SpaceShipTwo is Virgin Galactic’s vehicle for commercial, suborbital, human spaceflight. The spacecraft is carried to high-altitude by the White Knight 2 carrier aircraft, and then released to fly under rocket power to more than 100 km altitude and return for a landing at the takeoff runway.
Source: Virgin Galactic
You can read more about this spacecraft at the following link:
After an in-flight accident during testing on 31 October 2014, Virgin Galactic’s first SpaceShipTwo was destroyed and the crew was killed. You can read details on the accident and the post-crash investigation at the following link:
The second SpaceShipTwo is being built and was introduced in January 2015. You can read the latest news on Virgin Galactic’s commercial space program at the following link:
When commercial spaceflight operations begin, they will take place at Spaceport America, which is located about 180 miles south of Albuquerque, NM. Below is a photo of the main building at the spaceport and the White Knight 2 carrier aircraft.
Source: Virgin Galactic
Blue Origin and the New Shepard spacecraft
Blue Origin’s New Shepard system will take astronauts to space on suborbital journeys using rocket-powered Vertical Take-off and Vertical Landing (VTVL) technology. The New Shepard vehicle includes a Crew Capsule carrying three or more astronauts atop a separate rocket-powered Propulsion Module, to be launched from a West Texas Launch Site. After descent and reentry into Earth’s atmosphere, the Crew Capsule will separate from the Propulsion Module and land under parachutes near the launch site. Meanwhile, the Propulsion Module will make a vertical, powered landing at the launch site and then be made ready for reuse on a later flight. An early design of this vehicle is shown below.
Source: Blue Origin
Blue Origin reported on 7 April 2015 that it had completed acceptance flight tests of its cryogenic BE-3 “deep-throttle” rocket engine that will power the reusable New Shepard spacecraft. “Deep throttle” means that the 110,000-lb.-thrust rocker engine can be throttled down to 20,000 lb. thrust, which is needed for a vertical landing. Autonomous flight tests of the spacecraft are scheduled to occur later in 2015. Engine development will continue into 2017.
Visit the Blue Origin website to read more on their commercial space program and BE-3 engine testing at the following link:
Radioisotope Thermoelectric Generators (RTG), also called Radioisotope Power Systems (RTS), commonly use non-weapons grade Plutonium 238 (Pu-238) to generate electric power and heat for National Aeronautics and Space Administration (NASA) spacecraft when solar energy and batteries are not adequate for the intended mission. In comparison to other RTG heat sources (Strontium-90, Cesium-137), Pu-238 has a relatively long half-life of 87.75 years, which is a desirable property for a long-life RTG.
Approximately 300 kg (661 lb) of Pu-238 was produced by the Department of Energy (DOE) at the Savannah River Site between 1959 – 1988. After U.S production stopped, the U.S. purchased Pu-238 from Russia until that source of supply ended in 2010.
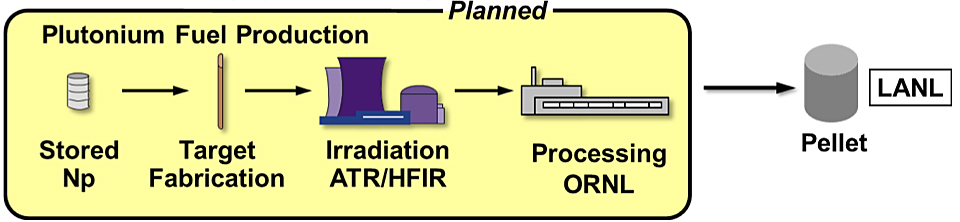
Limited production of new Pu-238 in the U.S re-started in 2013 using the process shown below. This effort is partially funded by NASA. Eventually, production capacity will be about 1.5 kg (3.3 lb) Pu-238 per year. The roles of the DOE national laboratories involved in this production process are as follows:
Idaho National Engineering Lab (INEL):
Store the Neptunium dioxide (NpO2) feed stock
Deliver feed stock as needed to ORNL
Irradiate targets provided by ORNL in the Advanced Test Reactor (ATR)
Return irradiated targets to ORNL for processing
Oak Ridge National Lab (ORNL):
Manufacture targets
Ship some targets to INEL for irradiation
Irradiate the remaining targets in the High Flux Isotope Reactor (HFIR)
Process all irradiated targets to recover and purify Pu-238
Convert Pu-238 to oxide and deliver as needed to LANL
Los Alamos National Lab (LANL):
Manufacture the Pu-238 fuel pellets for use in RTGs
Source: Ralph L McNutt, Jr, Johns Hopkins University APL, 2014
In 2015, the U.S. had an existing inventory of about 35 kg (77 lb) of Pu-238 of various ages. About half was young enough to meet the power specifications of planned NASA spacecraft. The remaining stock was more than 20 years old, has decayed significantly since it was produced, and did not meet specifications. The existing inventory will be blended with newly produced Pu-238 to extend the usable inventory. To get the energy density needed for space missions while extending the supply of Pu-238, DOE and NASA plan to blend “old” Pu-238 with newly produced Pu-238 in 2:1 proportions.
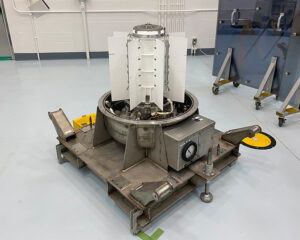
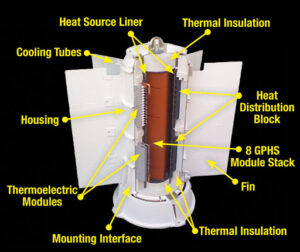
Since 2010, NASA’s RTG for spacecraft missions has been the Multi-Mission Radioisotope Thermoelectric Generator (MMRTG), which It is based on the SNAP-19 RTG flown on the two Viking Mars landers (circa 1975) and the Pioneer 10 and 11 deep space probes (circa 1972). At beginning of life, the current MMRTG can provide about 2,000 watts of thermal power and 110 watts of electrical power from eight General Purpose Heat Source (GPHS) modules that contain a total of 10.6 pounds (4.8 kilograms) of plutonium dioxide fuel. Electric conversion efficiency is about 6%.
Assembled MMRTG on a transport dolly. Source: NASA
NASA had a program to develop an Advanced Stirling Radioisotope Generator (ASRG), which was designed to produce about four times the power of the MMRTG per unit of Pu-238. Electric conversion efficiency was about 26%. The ASRG required a total of 2.7 pounds (1.2 kilograms) of plutonium dioxide in two GPHS modules. However, the ASRG would produce less waste heat, which can be used productively to warm electronics in the interior of a spacecraft, such as the Mars rover Curiosity. In November 2013, NASA announced that ASRG development had been discontinued because of budget cuts. You’ll find a NASA ASRG Fact Sheet at the following link: https://rps.nasa.gov/resources/65/advanced-stirling-radioisotope-generator-asrg/
On 22 December 2015, DOE reported the first U.S. production in nearly 30 years of Pu-238. This production demonstration, which was partially funded by the NASA, was performed at ORNL and yielded 50 grams of Pu-238. The last U.S. production of Pu-238 occurred in the late 1980s at the Savannah River Plant in South Carolina.
DOE reported that it plans to set an initial production target of 300 – 400 grams (about 12 ounces) of Pu-238 per year. After implementing greater automation and scaling up the process, ORNL expects to reach the the production target of 1.5 kg (3.3 lb) Pu-238 per year.
The next NASA mission that will use an RTG is the Mars 2020 rover, which will use an MMRTG, as used on NASA’s Mars rover Curiosity.
In the past three years, ORNL has made scant progress in producing Pu-238. In a 13 December 2018 article, “NASA Doesn’t Have Enough Nuclear Fuel For Its Deep Space Missions,”author Ethan Siegel reports: “Although current production (at ORNL) yields only a few hundred grams per year (less than a pound), the laboratory has the eventual goal of ramping up to 1.5 kilograms (3.3 pounds) per year by 2023, at the earliest. Ontario Power Generation in Canada has also begun producing Pu-238, with the goal of using it as a supplemental source for NASA.” You can read the complete article on the Forbes website at the following link: https://www.forbes.com/sites/startswithabang/2018/12/13/nasa-doesnt-have-enough-nuclear-fuel-for-its-deep-space-missions/#1a73d47e1c18
The Canadian plans for becoming a source of Pu-238 was announced on 1 March 2017: “Ontario Power Generation (OPG) and its venture arm, Canadian Nuclear Partners, are participating in a project to produce isotopes in support of deep space exploration. Under the agreement, OPG would help create isotopes at the Darlington nuclear station east of Toronto that will help power space probes.” You can read the complete OPG press release here: https://www.opg.com/news-and-media/news-releases/Documents/20170301_DeepSpace.pdf
The NASA Mars rover, Perseverance, was launched from Cape Canaveral on 30 July 2020, with an expected landing date of 18 February 2021 in the Jezero crater on Mars. Once on the surface, Perseverance will be powered by an MMRTG.
The Pu-238 and some other special materials for the Perseverence MMRTG were produced in the U.S. at ORNL, as described in the following short (2:03 minutes) video, “ORNL-produced tech fuels NASA’s Perseverance mission to Mars”:
In a 20 July 2020 news release, ORNL provided more information on the U.S. production process for Pu-238 and reported that, “the lab has been consistently increasing its Pu-238 production capabilities, aiming to produce 1.5 kilograms per year by 2026.” You can read this ORNL press release here: https://www.ornl.gov/news/ornl-produced-plutonium-238-help-power-perseverance-mars
At the planned U.S. production rate for Pu-238, NASA should be able to conduct an MMRTG mission at about four-year intervals. If NASA MMRTG missions will be more frequent than this, the U.S. will need to purchase additional Pu-238 from another source, perhaps Canada.
5 March 2021 Update:
The Perseverance rover landed on Mars on 18 February2021, in the planned target area in Jezero Crater. Power from the MMRTG was nominal after landing. Perseverance will spend at least one Mars year (two Earth years) exploring the landing site region.
The next NASA mission with an MMRTG-powered spacecraft is the Dragonfly mission to Saturn’s moon Titan, which will launch in 2026 and arrive on Titan in 2034.
The Voyager 1 and 2 spacecraft were launched in 1977, each with three RTGs delivering a maximum of 470 watts of electrical power at the beginning of the mission. Both spacecraft have left the solar system (Voyager 1 in 2013 and Voyager 2 in 2018) and continue to transmit from interstellar space in 2021 with their RTGs operating at a reduced power level of about 331 watts after 44 years of Pu-238 decay during the mission. NASA plans to continue the Voyager missions until at least 2025.
Mammoths lived from the Pliocene epoch, about 5 million years ago, into the current Holocene epoch; dying out about four thousand years ago. Many lived in Arctic tundra regions in Siberia and northern Canada, where many frozen, relatively well-preserved mammoth “mummies” have been found in permafrost. Scientists have been able to extract mammoth DNA from these remains. Unfortunately, the mammoth DNA samples have been degraded by the long-term actions of water and oxygen and have been contaminated with DNA from other sources, such as: (1) bacteria that lived symbiotically in or on the mammoth, or (2) bacteria and fungi that existed in the environment where the mammoth was found. Techniques exist to discriminate original mammoth DNA fragments from these other DNA sources. Genetically, the mammoth is more closely related to the modern Asian elephant than the African elephant. Scientists are working to complete the mapping of the mammoth genome and identify all the differences with the Asian elephant genome. In the not too distant future, it appears that it will be possible to splice mammoth DNA fragments into the complete DNA sequence of an Asian elephant. If this work is successful, we may have the opportunity to visit a living mammoth in a “Pliocene Park” somewhere in the Arctic.
Read more details and see some very interesting embedded videos at the following link:
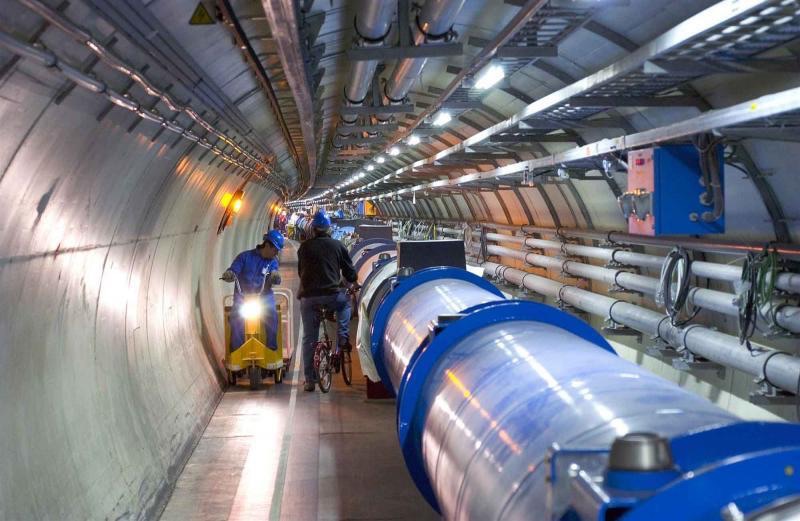
After a two-year shutdown for modifications that are expected to nearly double the maximum energy of LHC to 13 TeV, CERN has completed a long re-test process and restored LHC to operation. You can read about the restart process at the following link:
Re-start was delayed by an intermittent short circuit that had to be resolved after the superconducting machine had already been cooled down. Maintenance and repair is time-consuming when a superconducting component or system is involved, since the equipment must be warmed up before it can be serviced, and then cooled down again to 1.9 degrees Celsius before LHC operation can resume.
With the LHC back in operation, the search for more Higgs Bosons and signs of supersymmetry continues. Read more about LHC operations at the following link:
You also might want to review Maria Spiropulo’s 27 August 2014 Lyncean presentation: “The Future of the Higgs Boson.” You can find this presentation in the Past Meetings section of this Lyncean website.
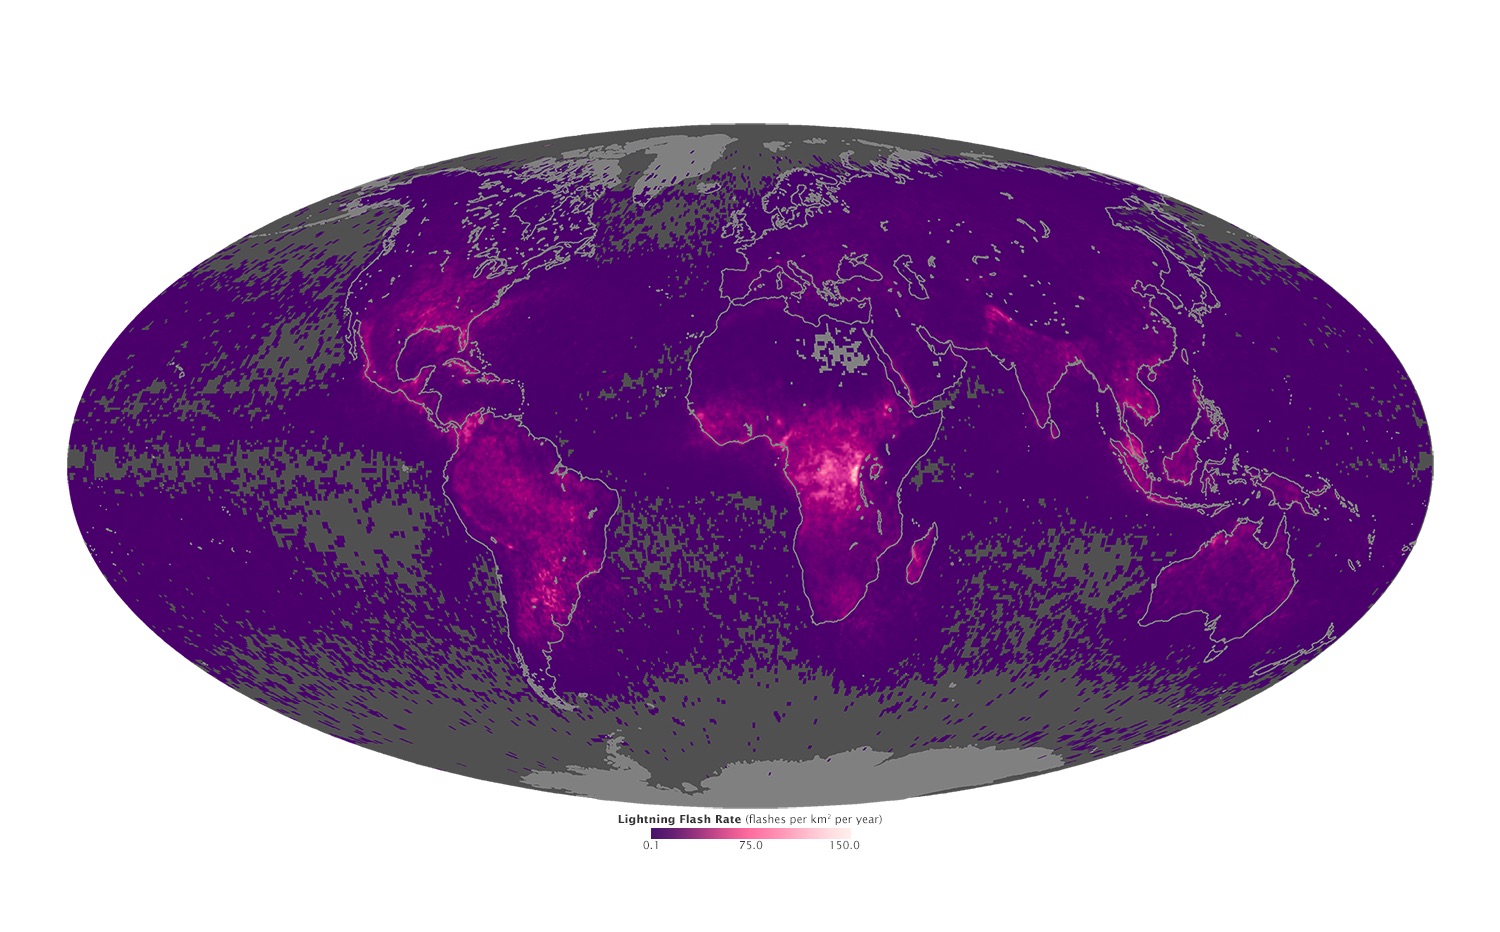
According to satellite observations summarized in the following map, lightning occurs more often over land than over the oceans and more often closer to the equator.
Source: NASA
The map above shows the average yearly counts of lightning flashes per square kilometer from 1995 to 2013. The map was created using data collected from 1998–2013 by the Lightning Imaging Sensor (LIS) on NASA’s Tropical Rainfall Measuring Mission satellite, and from 1995–2000 by the Optical Transient Detector (OTD) on the OrbView 1/Microlab satellite. Flashes above 38 degrees North were observed by OTD only, as the satellite flew to higher latitudes.
Areas with the fewest number of flashes each year are gray or purple; areas with the largest number of lightning flashes—as many as 150 per year per square kilometer—are bright pink. Be careful where you pitch your tent if you go on safari in central Africa.
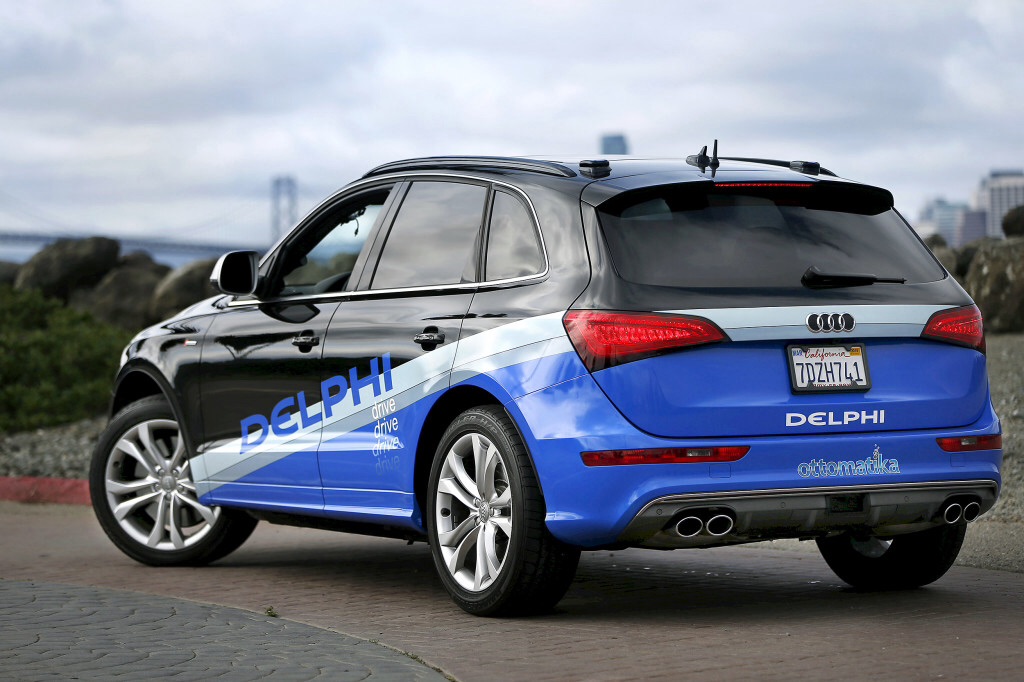
American automotive supplier Delphi modified a 2014 Audi SQ5 to make it capable of driving autonomously and then had it drive 3,400 miles on highways from San Francisco to New York City. The human “co-pilot” took control for about 1% of the distance on city streets.
Source: www.wired.com
Read the story, including details on the car’s autonomous driving features, at the following link:
An important point made in this article is the great speed with which autonomous vehicle technology has advanced. In the first DARPA Grand Challenge in March 2004, all 15 competing autonomous vehicles failed to complete a very difficult 142 mile off-road course from Barstow, CA to Primm, NV. The greatest distance completed by the “winner” was 7.32 miles. In September 2005, five vehicles completed a 132 mile Grand Challenge course in southern Nevada. The third Grand Challenge in 2007 was held in an urban street environment in Victorville, CA. Six of 11 competing teams completed the course. SAIC supported a team in all three Grand Challenges.
For more information, check out the 2014 article, “The DARPA Grand Challenge – 10 Years Later,” at the following link:
That modern high-definition (HD) digital versions of movies can be created from the original film stock is a real testament to the very high-resolution available in movie film, even older film stock if it has been well preserved. Details on the process are described in the article at the following link:
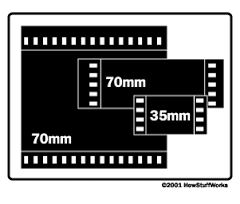
The most common film used in traditional movie theaters is 35 mm film, which is available in several variations for Cinemascope, widescreen, etc. A 35 mm film frame measures 22 mm wide by 16 mm high and more or less of that frame is used depending on the aspect ratio of the image being captured. For example, a wide-screen (high aspect ratio) image does not use the full height of the 35 mm film frame. In effect, this is optical image compression.
Source: Wikipedia Commons
The large format film stock discussed in the article is 65 mm film, which was used to film the 1959 movie Ben Hur and many other wide-screen movies. The resolution is higher than for 35 mm film because of the greater film area available for an “uncompressed” wide-screen image. As used in cameras, each film frame is 48.5 mm wide by 22.1 mm high. For projection, the original 65 mm film is printed on 70 mm film. The additional 5 mm in film width are used for four magnetic strips holding six tracks of sound.
Source: HowStuffWorks.com
The article doesn’t mention IMAX film, which is a horizontal variant of 70 mm film, in which the film roll is turned on its side with 15 perforations per frame. The above figure shows the relative sizes of 35 mm, standard 70 mm and IMAX 70 mm film. An IMAX frame is more than three times the size of a standard 70 mm frame and almost nine times greater than a 35 mm film frame. No wonder IMAX film movies look so impressive.
The 1st-generation U.S. photographic spy satellites, Corona, used special Kodak 70 mm film.
As noted in the article, the resolution of 35mm film is comparable to that of a 20 megapixel digital image. The large format 65-70mm film has roughly double the potential resolution of 35mm film, comparable to a 30-40 megapixel digital image. This means an IMAX film image would be comparable to a 90 – 120 megapixel digital image.
Many new movies are being filmed in 8K digital (7680 x 4320 pixel frame = about 33.2 megapixels per frame), which has about 4 times the resolution of the latest 4K (3840 x 2160 pixel frame = about 8.2 megapixels per frame) HDTVs. Even 8K digital doesn’t match the image quality from the original film version of the movie Ben Hur or a modern IMAX film.
The company Shodan (https://www.shodan.io) makes a search engine for Internet connected devices, which commonly is referred to as the “Internet of things”. The Shodan website explains that the intent of this search engine is to provide the following services:
Explore the Internet of Things
Use Shodan to discover which of your devices are connected to the Internet, where they are located, and who is using them.
Monitor Network Security
Keep track of all the computers on your network that are directly accessible from the Internet. Shodan lets you understand your digital footprint.
Get a Competitive Advantage
Who is using your product? Where are they located? Use Shodan to develop empirical market intelligence.
See the Big Picture
Websites are just one part of the Internet. There are power plants, smart TVs, smart appliances, and much more that can be found with Shodan.
From a security point-of-view, the last point, above, should seem a bit unsettling to the owners / operators of the power plants, smart TVs and smart appliances.
Shodan founder, John Matherly, claims to have “pinged” all devices on the internet. Not surprisingly, the results, which are reproduced below, show that internet-connected devices are concentrated in developed nations and metropolitan areas. These results were reported on Twitter at the following link:
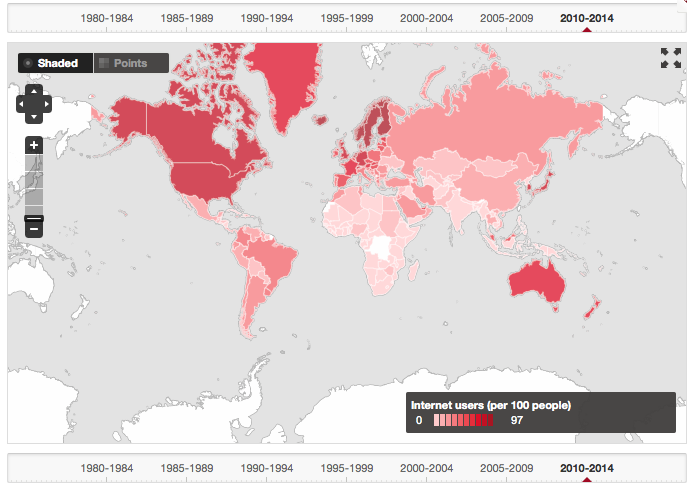
As an example of what you can find, I selected the “Indicators” tab, then looked under the “Infrastructure” heading and found that data on “Internet users (per 100 people)” were available. These data are viewable in different formats (tabular, map, graph). The map results for the period 2010 – 2014 are shown below:
Resolution is at the country level, so the country-wide average values are not representative of usage in remote areas of the country (i.e., the Canadian northern territories). Nonetheless, the map of the global distribution of Internet users is an interesting result that is quickly available from World Bank data.
The World Bank website look like an interesting site to explore at your leisure.
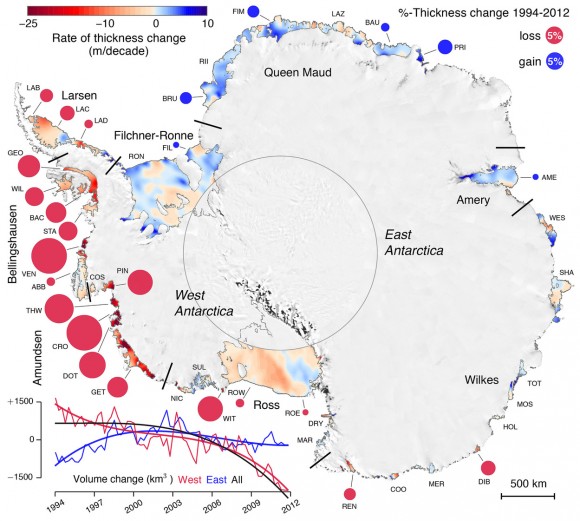
A new study of the Antarctic ice shelf by Scripps Institution of Oceanography and University of California San Diego presents, for the first time, high-resolution maps (about 30 km by 30 km) of ice thickness changes at three-month time steps during the 18-year period from 1994 – 2012. This data set has allowed scientists to quantify how the rate of thinning varies at different parts of the same ice shelf during a given year, and between different years.
The report was accepted on 11 March 2015 for publication in Science. The abstract reads as follows:
The floating ice shelves surrounding the Antarctic Ice Sheet restrain the grounded ice-sheet flow. Thinning of an ice shelf reduces this effect, leading to an increase in ice discharge to the ocean. Using eighteen years of continuous satellite radar altimeter observations we have computed decadal-scale changes in ice-shelf thickness around the Antarctic continent. Overall, average ice-shelf volume change accelerated from negligible loss at 25 ± 64 km3 per year for 1994-2003 to rapid loss of 310 ± 74 km3 per year for 2003-2012. West Antarctic losses increased by 70% in the last decade, and earlier volume gain by East Antarctic ice shelves ceased. In the Amundsen and Bellingshausen regions, some ice shelves have lost up to 18% of their thickness in less than two decades.
An overview of the results of this study is shown in the following map by Scripps Institution of Oceanography and UCSD.
You can read more about this study at the following link:
To see what’s happening to the Arctic ice sheet, check out the 23 March 2015 Pete’s Lynx posting, “2014 – 2015 Arctic sea ice maximum extent was lowest yet recorded.”
 Source: XCOR Aerospace
 Source: XCOR Aerospace
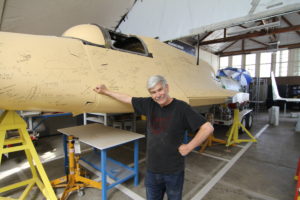 Build A Plane founder Lyn Freeman with unfinished Lynx prototype. Source: Douglas Messier/Space.com
 Source: Virgin Galactic
 Source: Virgin Galactic
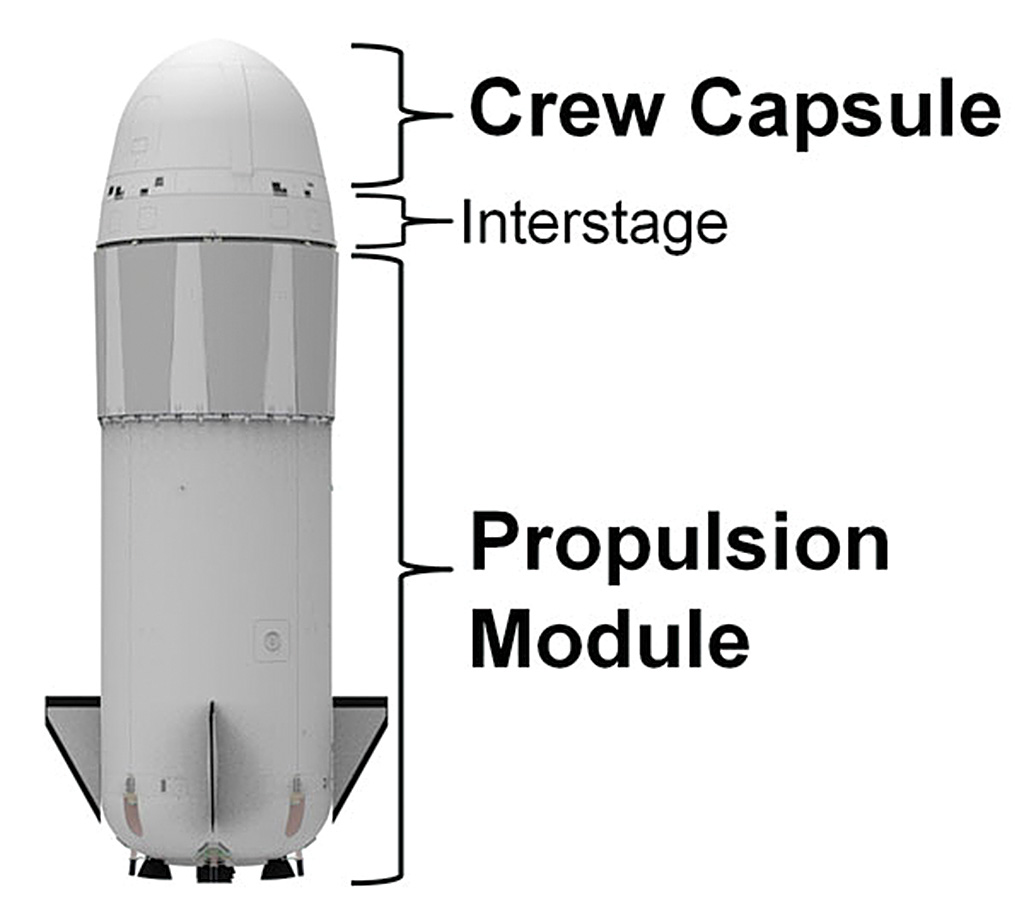 Source: Blue Origin