Category Archives: Power Generating Technology – Nuclear

IAEA’s Nuclear Technology Review 2016

Peter Lobner

In June 2016, the International Atomic Energy Agency (IAEA) published a report by the Director General entitled, “Nuclear Technology Review 2016,” which highlights notable developments in 2015 in the following segments of the worldwide nuclear industry.

  • Power applications
    • Generation
    • Fuel cycle
    • Safety
  • Advanced fission
    • Gen III large water cooled reactors
    • Fast reactors
    • Gas-cooled reactors
    • Small & medium size reactors (SMRs)
    • Gen IV advanced reactors
  • Fusion
  • Accelerator and research reactor applications
  • Other applications
    • Emerging industrial applications of radiation technologies
    • Advances in medical imaging technology
    • Use of radiation in connection with managing mosquito disease vectors
    • Use of isotopic techniques for soil management

The following chart from the IAEA report shows the age distribution (years of operation) of the worldwide fleet of 441 operating power reactors. The median age of this fleet is about 26 years, and you can see a bow wave of aging nuclear power plants, followed by far fewer younger plants already in operation.

IAEA distribution of reactor age 2015

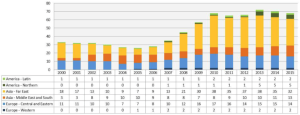
The following chart from the IAEA report shows the number of new plants under construction by region. As of the end of 2015, a total of 68 nuclear power plants were in various stages of their decade-long construction cycles. This chart clearly shows that Western Europe and the Americas are minor players in the construction of new reactors. Most of the new power reactor construction is occurring in Asia and Central / Eastern Europe.

IAEA reactors under construction 2015

IAEA reported that, in 2015, worldwide nuclear power generation reached 381.7 GWe. Projections for the future growth of nuclear power generation thru 2050 were given for two cases:

  • Low case: In this case, new plants just make up for the generating capacity lost from retiring plants. Projected 2050 worldwide generation: 371 GWe.
  • High case: This is a much more optimistic case, yielding about 964 GWe worldwide generation by 2050.

IAEA noted that, “The 21st Conference of the Parties to the United Nations Framework Convention on Climate Change (COP21) resulted in the Paris Agreement that neither identifies nor excludes any particular form of energy.” The Paris Agreement does not discriminate against nuclear power as a means for reaching lower carbon emission goals. In contrast, the U.S. Environmental Protection Agency’s (EPA) euphemistically named “Clean Power Plan” fails to give appropriate credit to nuclear power as a means for utilities and states to reduce the carbon emissions from their portfolio of power plants. (See my 3 July 2015 and 27 November 2015 posts for more on CPP).

IAEA further noted the contribution of nuclear power to meeting lower carbon emission goals:

“Nuclear power has significantly contributed to climate change mitigation by avoiding nearly 2 billion tonnes (metric tons) of carbon dioxide per year. For nuclear power to help limit global warming to 2o C by 2100, its capacity would need to match the high projection to avoid nearly 6.5 billion tonnes of greenhouse gas emissions by 2050.”

Among the small and medium size reactors (SMRs), IAEA noted that the following three were under construction in 2015: Argentina’s CAREM-25, Russia’s KLT-40S, and China’s HTR-PM. Another dozen SMRs were considered to be in the advanced design stage and potentially deployable in the near-term.

IAEA maintains its Advanced Reactors Information System (ARIS), as I reported in my 13 February 2015 post. This is a very comprehensive source of information on all types of advanced reactors. You can directly access ARIS at the following link:

https://aris.iaea.org

The “Nuclear Technology Review 2016” provides a useful overview of worldwide nuclear fuel cycle activities:

  • Worldwide uranium mining in more than 15 countries produced about 57,000 tonnes of Uranium (U) in 2015. Kazakhstan is the leading producer, followed by Canada.
  • Worldwide annual capacity for conversion of U to UF6 was about 60,000 tonnes in 2015, approximately matching annual demand. Canada, China, France, Russia, UK and U.S. operate conversion facilities.
  • Worldwide annual enriched light water reactor (LWR) fuel fabrication capacity is about 13,500 tonnes vs. an annual demand of about 7,000 tonnes. In addition, the fuel fabrication capacity for natural uranium fuel for pressurized heavy water reactors (PHWRs) is about 4,000 tonnes vs. a demand of 3,000 tonnes. Thirteen nations produce LWR fuel, and five produce PHWR fuel.
  • Spent fuel reprocessing is being carried out in 5 nations: China, France, India, Russia and UK; with France and Russia offering reprocessing services to international customers. France and UK have the greatest capacity, reprocessing about 1,000 t HM/year.
  • IAEA reported that, “by the end of 2015, (worldwide) spent fuel in storage amounted to around 266,000 tonnes of heavy metal (t HM) and is accumulating at a rate of around 7,000 t HM/year.
  • Several nations are planning or developing their own geologic disposal facilities for spent nuclear fuel

There’s a lot more information in the IAEA report, including information on fusion, accelerators, research reactors, and industrial and medical applications of nuclear technologies. You can download this IAEA report at the following link:

https://www.iaea.org/About/Policy/GC/GC60/GC60InfDocuments/English/gc60inf-2_en.pdf

The Nuclear Renaissance is Over in the U.S.

Peter Lobner

The nuclear renaissance seemed to offer a path forward to deploy new generations of safer, more efficient power reactors to replace existing fleets of large power reactors. In the U.S., that transition is captured in the following diagram.
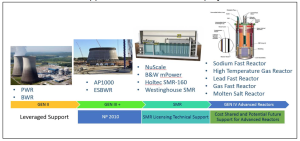
Nuc renaissance roadmapSource: Department of Energy

The current issues plaguing the U.S. nuclear power industry are largely financial, driven primarily by the low price of natural gas and the correspondingly low price of electricity generated by fossil power plants fueled by natural gas.

The recently implemented EPA Clean Power Plan (CPP) also is having an impact by failing to give appropriate credit to nuclear power plants as a means for minimizing greenhouse gas (GHG) emissions. This leaves renewable power generators (primarily hydro, wind and solar) to meet GHG emission targets in state and utility electric power portfolios.  See my 27 November 2015, 8 July 2015 and 2 July 2015 posts for more information on the CPP.

Together, these issues have derailed the U.S. nuclear renaissance, which seemed to be gaining momentum more than a decade ago. Frankly, I think the nuclear renaissance in the U.S. is over because of the following factors:

  • Successfully operating nuclear power plants are being retired early for financial reasons.
  • Fewer large, new Generation III (Gen III) advanced light water reactor plants are being built than expected.
  • The prospects for small, modular reactors (SMRs) and advanced Generation IV (Gen IV) reactors will not be realized for a long time.
  • Important infrastructure facilities in the U.S. commercial reactor fuel cycle have been cancelled.

These issues are discussed in the following text.

1.  Early retirement of successfully operating nuclear power plants for financial reasons

In a merchant energy market, nuclear power plants, even those operating at very high capacity factors, are undercut by natural gas generators, which can deliver electricity to market at lower prices. During the period from 2013 to 2015, the U.S. fleet of 99 power reactors (all considered to be “Generation II”) operated at an average net capacity factor of 90.41% (net capacity factor = actual power delivered / design electrical rating). This fleet of reactors has a combined generating capacity of about 100 GW, which represents about 20% of the total U.S. generating capacity.

Nuclear power plants do not currently receive subsidies commonly given to solar and wind power generators. For many U.S. utility executives, nuclear power plants are becoming financial liabilities in their generating portfolios. While some states are discussing ways to deliver financial relief for nuclear power plants operating within their borders, other states appear willing to let the plants close in spite of their real contributions to GHG reduction, grid stability, and the state and local economy.

Following are several examples of nuclear plant early retirements.

1.1. Exelon announced planned closure dates for Clinton and Quad Cities

The current operating license for the Clinton nuclear plant expires 29 September 2026 and the licenses for Quad Cities 1 & 2 expire on 14 December 2032. For the period 2013 – 2015, these nuclear power plants operated at very high capacity factors:

  • Quad Cities 1:     964 MWe @ 101.27%
  • Quad Cities 2:     957 MWe @ 92.68%
  • Clinton:              1,062 MWe @ 91.39%

On 2 June 2016, Exelon announced plans to retire the Clinton and Quad Cities nuclear plants on 1 June 2017 and 1 June 2018, respectively. This action was taken after the state failed to pass comprehensive energy legislation that would have offered financial relief to the utility. Also, Quad Cities was not selected in a reserve capacity auction that would have provided some needed future revenue. If the plants are closed as currently scheduled, Exelon will walk away from about 33 GW-years of carbon-free electric power generation.

You can read the Exelon press release at the following link:

http://www.exeloncorp.com/newsroom/clinton-and-quad-cities-retirement

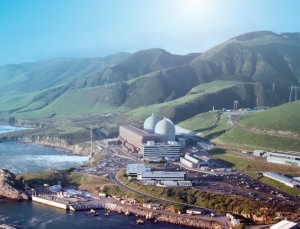
1.2. PGE announced Diablo Canyon 1 & 2 closure

The two-unit Diablo Canyon nuclear power plant is the last operating nuclear power station in California. In the three-year period from 2013 – 2015, unit performance was as follows:

  • Diablo Canyon 1:     1,138 MWe @ 90.29%
  • Diablo Canyon 2:     1,151 MWe @ 88.19%

Diablo-Canyon-aerial-c-PGESource: PGE

On 21 June 2016, PGE issued a press release announcing that they will withdraw their application to the NRC for a 20-year license extension for the Diablo Canyon 1 & 2 nuclear power plants and will close these plants by 2025 when their current operating licenses expire.  PGE will walk away from about 41 GW-years of carbon-free electric power generation.

You can read the PGE press release at the following link:

https://www.pge.com/en/about/newsroom/newsdetails/index.page?title=20160621_in_step_with_californias_evolving_energy_policy_pge_labor_and_environmental_groups_announce_proposal_to_increase_energy_efficiency_renewables_and_storage_while_phasing_out_nuclear_power_over_the_next_decade

1.3. Omaha Public Power District (OPPD) decided to close Fort Calhoun

With a net output of about 476 MWe, Fort Calhoun is the smallest power reactor operating in the U.S. In 2006, the Fort Calhoun operating license was extended to 2033. This plant operates as part of a power cooperative and is not subject to the same market forces as merchant plants. Nonetheless, the price of electricity delivered to customers is still an important factor.

On 16 June 2016, the OPPD Board announced their decision to close Fort Calhoun by the end of 2016 and stated that the closure was based simply on economic factors: it was much cheaper to buy electricity on the wholesale market than to continue operating Fort Calhoun. It cost OPPD about $71 per megawatt-hour in 2015 to generate power at Fort Calhoun. This is double the national industry average of $35.50 and much more than the open market price of about $20 per megawatt-hour.

You can read more about the Fort Calhoun closure in the OPPD press release at the following link:

http://www.oppd.com/news-resources/news-releases/2016/june/oppd-board-votes-to-decommission-fort-calhoun-station/

1.4. Entergy announced plans to close the James A. FitzPatrick nuclear power plant

The license extension process for the 838 MWe James A. FitzPatrick nuclear power plant in upstate New York was completed in 2008 and the current operating license expires in October 2032. On 2 November 2015, Entergy announced plans to close the plant in late 2016 or early 2017 for economic reasons, primarily:

  • Sustained low current and long-term wholesale energy prices, driven by record low natural gas prices due to the plant’s proximity to the Marcellus shale formation, have reduced the plant’s revenues.
  • Flawed market design fails to recognize or adequately compensate nuclear generators for their benefits (i.e., large-scale 24/7 generation, contribution to grid reliability, carbon-free generation)
  • The plant carries a high cost structure because it is a single unit.
  • The region has excess power supply and low demand.

You can read the Entergy press release at the following link:

http://www.entergynewsroom.com/latest-news/entergy-close-jamesfitzpatrick-nuclear-power-plant-central-new-york/

1.5. New Your state is considering operating subsidies for nuclear power plants

Finally, here’s some good news. In July 2016, the New York Public Services Commission (PSC) announced that it was considering subsidies for nuclear power plants operating in the state:

“The Public Service Commission is considering a proposed component of the Clean Energy Standard (CES) to encourage the preservation of the environmental values or attributes of zero-emission nuclear-powered electric generating facilities for the benefit of the electric system, its customers and the environment.”

This proposal offers to award zero-emissions credits (ZEC) in six 2-year tranches, beginning 1 April 2017. The price to be paid for ZECs would be determined by a formula that includes published estimates of the social cost of carbon (SCC). Under the PSC staff’s approach, “the zero-emission attribute payments will never exceed the calculated value they produce.”

Details of the PSC staff’s proposed methodology for determining subsidies for nuclear power plants are in a document entitled “Staff’s Responsive Proposal for Preserving Zero-Emissions Attributes,” which you can download at the following link:

https://www.google.com/?gws_rd=ssl#q=“Staff’s+Responsive+Proposal+for+Preserving+Zero-Emissions+Attributes%2C

A short article on the proposed subsidies was published on 12 July 2016 on the Power magazine website at the following link:

http://www.powermag.com/subsidies-proposed-for-new-yorks-upstate-nuclear-power-plants/

No doubt this approach to establishing zero-emissions credits for nuclear power plants will be closely watched by other states that are faced with this same issue of nuclear power plant early retirement for economic reasons. Hopefully, Entergy will reconsider its planned closure of the James A. FitzPatrick nuclear power plant.

2.  Fewer large, new Generation III advanced light water reactor plants are being built than expected

Since the start of the nuclear renaissance, 27 combined license (COL) applications were submitted to the NRC for construction and operation of new Gen III advanced light water reactor plants. You can see the current status of COLs for new reactors in the U.S. on the NRC’s website at the following link:

http://www.nrc.gov/reactors/new-reactors/col.html

A summary of the current COL status is as follows:

  • 7 withdrawn
  • 6 NRC review suspended
  • 7 under review
  • 7 issued (Fermi 3, South Texas Project 3 & 4, V. C. Summer 2 & 3, and Vogtle 3 & 4)

Recent actions are highlighted below.

2.1 Entergy withdrew its NRC license application for the River Bend unit 3 nuclear power plant

The NRC confirmed that, effective 21 June 2016, Entergy had withdrawn its application for a COL for a single unit of the General Electric Economic Simplified Boiling Water Reactor (ESBWR) at the River Bend site in Louisiana. This is the end of a series of delays initiated by Entergy. On 9 June 2009, Entergy requested that the NRC temporarily suspend the COL application review, including any supporting reviews by external agencies, until further notice.   The NRC granted this suspension. On 4 December 2015, Entergy Operations, Inc., filed to have their COL application withdrawn.

2.2 Three of the seven approved Gen III plants may never be built: Fermi-3 and STP 3 & 4.

  • Fermi 3: On 7 May 2015, NRC announced that the Fermi-3 COL had been issued. After the COL was issued, DTE Energy is reported to have said it has no immediate plans to build Fermi 3, and sought the approval as a long-term planning option. If built, Fermi 3 will be a GE-Hitachi ESBWR.
  • South Texas Project (STP) 3 & 4: In April 2015, NRG shelved plans to finance STP 3 & 4. NRG spokesman David Knox said, “The economics of new nuclear just don’t permit the construction of those units today.” Nonetheless, NRG continued the NRC review process and NRC issued the COLs for STP Units 3 and 4 on 12 February 2016. If built, STP 3 & 4 will be Toshiba Advanced Boiling Water Reactors (ABWRs).

2.3 Only four of the seven approved Gen III plants are actually under construction: V. C. Summer 2 & 3, and Vogtle 3 & 4.

So far, the net results of the nuclear renaissance in the U.S. are these four new Gen III plants, plus the resurrected Watts Bar 2 Gen II nuclear plant (construction stopped in 1980; not completed and operational until 2015).

  • C. Summer 2 & 3: Both units are under construction. These are Westinghouse AP-1000 PWR plants. In February 2016, South Carolina Electric and Gas Co. (SCE&G) reported that 85% of the major equipment necessary to build Units 2 and 3 was onsite. Most of the remaining equipment has been manufactured and was awaiting transport to the site.
  • Vogtle 3 & 4: Both units are both under construction. These are Westinghouse AP-1000 PWR plants. Southern Company provides an overview of their construction status at the following link:

http://www.southerncompany.com/what-doing/energy-innovation/nuclear-energy/photos.cshtml
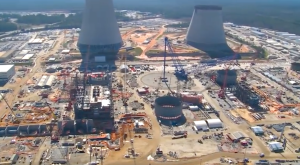
 Vogtle constructionVogtle 3 & 4 under construction. Source: Southern Company

2.4. Good news: Blue Castle Holdings is planning a 2-unit AP-1000 plant in Utah

Blue Castle Holdings conducted a project overview “webinar” on July 21, 2016 to kickoff its contractor selection process for this new plant. The preliminary schedule calls for the start of work in 2020, “as permitted by the NRC.” This will be an important project to watch, since it may become the first new nuclear power plant project since the first round of applications at the start of the nuclear renaissance. You can read more about the Blue Castle plant at the following link:

http://www.bluecastleproject.com

3.  The prospects for small, modular reactors (SMRs) and advanced Generation IV reactors will not be realized for a long time

Currently there are no SMRs or Gen IV reactors in any stage of a licensing process that could lead to a generic design certification or a combined license (COL) for a specific plant.

On 7 – 8 June 2016, the DOE and NRC co-hosted a second workshop on advanced non-light water reactors, which was a follow-on to a similar workshop held in September 2015. You can read the summary report and access all of the presentation material from the June 2016 workshop at the following link:

http://www.nrc.gov/public-involve/conference-symposia/adv-rx-non-lwr-ws/2016-06.html

The DOE presentation by John E. Kelly entitled, “Vision and Strategy for the Development and Deployment of Advanced Reactors,” includes the following timeline that shows projected U.S. nuclear generating capacity for four scenarios.

  • The declining blue, brown and green curves show the generating capacity available from the existing fleet of power reactors depending on the length of their operating licenses (40, 60, or 80 years), and of course, assuming that there are few early plant closures for economic reasons.
  • The upper purple line represents total nuclear generating capacity needed to maintain nuclear at about 20% of the total U.S. generating capacity. Significant growth in demand is expected due to electrification of transportation and other factors, creating a demand for 200 GW of nuclear generated electricity by about 2050. This is double the current U.S. nuclear generating capacity!!
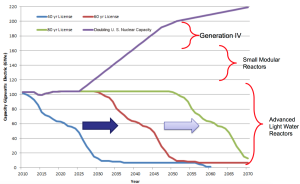
DOE addvanced reactor timelineSource: DOE

Among all the presentations in the 2016 workshop, there is no mention of where the capital comes from to build all of the new nuclear power plants needed to meet the expectation of 200 GW of nuclear generating capacity by 2050. If the expected economic advantages of SMRs and Gen IV plants fail to materialize, then construction cost per gigawatt of electrical generating capacity could be similar to current Gen III construction costs, which are on the order of $5 to 6 billion per gigawatt. This puts a price tag of $1.0 to 1.2 trillion on the deployment of 200 GW of new nuclear generating capacity. The actual amount isn’t particularly important. Just be aware that it’s a very big number. This leads me to believe that the above timeline is quite optimistic.

3.1. mPower SMR program has faltered

There was considerable optimism when the mPower program was launched more than a decade ago. This program probably is further along in its design and development processes than other U.S. SMR candidates. Unfortunately, mPower has been in decline for the past two years, during which time the mPower team head count fell from about 600 to less than 200 people. That reduction in force and slowdown in development occurred after the B&W board of directors (parent of BWXT) decided to reduce spending on mPower from about $100 million per year to a maximum of $15 million per year. The official explanation was that the company had failed in its effort to find additional major investors to participate in the project.

On 4 March 2016, there was good news to report when Bechtel and BWXT issued a press release announcing that they had reached an agreement to accelerate the development of the mPower SMR. No timeline was given for submitting an application for design certification to the NRC. You can read this press release at the following link:

http://www.prnewswire.com/news-releases/bechtel-bwxt-to-pursue-acceleration-of-small-modular-nuclear-reactor-project-300231048.html

On 13 May 2016, Tennessee Valley Authority (TVA) applied to the NRC for an early site permit for SMRs at the Clinch River site in Tennessee. In its application, TVA did not specify the reactor type, but previously had considered mPower for that site. The NRC is expected to decide in July 2016 if the application contains sufficient information to start the early site permit review process.

3.2. Other U.S. SMR candidates have not gotten beyond pre-application meetings with the NRC

The other U.S. SMR candidates are:

  • NuScale (NuScale Power, LLC)
  • SMR-160 (SMR Inventec, a Holtec International Company)
  • Integrated PWR (Westinghouse)

None have submitted an application for design certification to the NRC.

3.3. The DOE Generation IV (Gen IV) reactor program continues to slip

Gen IV reactors are intended to be the next generation of commercial power reactors, incorporating a variety of advanced technologies to deliver improved safety, reliability and economics.

The Generation IV International Forum (GIF) was created in January 2000 by 9 countries, and today has 13 members, all of which are signatories of the founding document, the GIF Charter. For basic information, you can download DOE’s Gen IV fact sheet at the following Argonne National Laboratory link:

http://www.ne.anl.gov/research/genIV/

On this fact sheet, you will find the following claim:

“Generation IV nuclear energy systems target significant advances over current-generation and evolutionary systems in the areas of sustainability, safety and reliability, and economics. These systems are to be deployable by 2030 in both industrialized and developing countries.”

You can view a more detailed 2014 presentation by the GIF at the following link:

https://www.gen-4.org/gif/upload/docs/application/pdf/2014-03/gif-tru2014.pdf

In this GIF presentation, you can see the significant schedule slip that has occurred between their 2002 and the 2013 roadmaps.
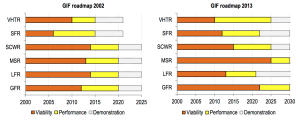
GIF Gen IV roadmap

Source: Gen IV International Forum

At the slow rate that DOE and its international GIF partners are actually making progress, I suspect that there will not even be a working Gen IV demonstration plant of any type before 2030, and certainly none in the U.S.

4. Important infrastructure facilities in the U.S. commercial reactor fuel cycle have been cancelled

Nuclear power plants are part of a fuel cycle, which for the U.S. has been a once-through (“throw-away”) fuel cycle since President Carter’s 7 April 1977 decision to discontinue work on a closed fuel cycle with nuclear fuel reprocessing. “Head-end” fuel cycle facilities include mining, milling, conversion, enrichment, and fuel manufacturing. These are the facilities that take uranium and/or plutonium from various sources and produce the desired nuclear fuel that is incorporated into the fuel elements that ultimately are installed in a reactor. “Back-end” fuel cycle facilities deal with the spent fuel elements and nuclear waste generated from reactor operation and other fuel cycle activities. In the once-through fuel cycle, the spent fuel is stored at the nuclear reactor where it was used until it can be transported to a nuclear waste repository for final disposition.

Two important nuclear fuel cycle facilities have been cancelled by the Obama administration: the Yucca Mountain Nuclear Waste Repository and the Savannah River Mixed-oxide Fuel Fabrication Facility. These cancellations have the effect of adding cost and uncertainty for the utilities operating commercial power reactors.

4.1. DOE has not developed plans for a replacement for the Yucca Mountain Nuclear Waster Repository

As is well known by now, the DOE abrogated its responsibility to develop a deep geologic site as the national commercial nuclear waste repository. Congress established this DOE role in the Nuclear Waste Policy Act of 1982. Yucca Mountain in Nevada was designated as the national repository site in the Nuclear Waste Policy Act amendments of 1987. Congress approved the Yucca Mountain project in 2002, and the project was docketed for licensing by the NRC in 2008, as Docket 63-001.

Yucca Mountain effectively was terminated in 2011 when the Obama administration removed funding for the project from the DOE budget. The NRC licensing process was suspended at the same time.

In August 2013, the U.S. Court of Appeals (Wash DC) ruled that the NRC was obligated to continue their Yucca Mountain licensing process and either “approve or reject the Energy Department’s application for [the] never-completed waste storage site at Nevada’s Yucca Mountain.” Finally, in January 2015, the NRC staff completed the Safety Evaluation Report (SER) for Yucca Mountain, which is available at the following link:

http://www.nrc.gov/reading-rm/doc-collections/nuregs/staff/sr1949/

Here are the basis conclusions presented in the SER:

  • NRC staff finds that DOE’s application meets most, but not all, of the applicable NRC regulatory requirements.
    • Requirements not met are related to certain conditions of land ownership and water rights.
  • NRC staff therefore does not recommend issuance of a construction authorization at this time.

The current status of Yucca Mountain licensing is summarized in a January 2016 NRC presentation, “NRC Review Activities for the Proposed High-level Radioactive Waste Repository at Yucca Mountain, Nevada,” which is available at the following link:

https://www.inmm.org/Content/NavigationMenu/Events/PastEvents/31stSpentFuelSeminar/W2-Rubenstone_INMM_DC_Jan2016.pdf

In this presentation, the author, James Rubenstone, identifies licensing actions still to be completed for the Yucca Mountain site and notes that, “Further progress of the review and licensing activities requires further appropriations.”   In March 2015, the NRC reported that completing its Yucca Mountain licensing process would cost an additional $330 million.

On 5 May 2016, the NRC issued the final Environmental Impact Statement (EIS) supplement for Yucca Mountain. This is not the end of the EIS process. There still remain about 300 contentions against the project that must be adjudicated. However, the adjudicatory process remains suspended.

In his January 2016 presentation, James Rubenstone also noted that, “New approaches for waste management and disposal have been proposed, but require dedicated funding and (in some cases) changes to existing law.”

So the bottom line is simply that this nation is very far, probably several decades, from having a national repository for commercial nuclear waste and spent nuclear fuel.

The burden for managing spent nuclear fuel remains with the U.S. nuclear utilities, which had been paying DOE for decades to develop the national nuclear waste repository. The current utility approach involves on-site management of spent fuel, initially in the spent fuel storage pool, and later in dry storage in canisters or casks that provide radiation shielding and protect the spent fuel from external hazards. These dry storage facilities typically are called Independent Spent Fuel Storage Installations (ISFSI). Nuclear utilities have added ISFSIs specifically to cope with the failure of DOE to complete the national nuclear waste repository as required by Nuclear Waste Policy Act of 1982.

You can find a good overview of ISFSI design and deployment at commercial power reactor sites on the NRC website at the following link:

http://www.nrc.gov/waste/spent-fuel-storage/dry-cask-storage.html

For those of you wanting more information on the Yucca Mountain project, I refer you to the recently published a two-volume, 920-page book entitled, “Waste of a Mountain,” by Michael Voegele and Donald Vieth. The book is on sale at the Pahrump Valley Museum with the proceeds going to the museum.  You’ll find the book at the following link:

http://pahrumpvalleymuseum.org/index.html

Waste of a MountainSource: Pahrump Valley Museum

4.2. DOE plans to halt construction of the Savannah River mixed-oxide (MOX) fuel fabrication facility (MFFF)
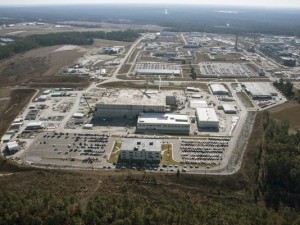
MFFFSource: DOE

The commitment to build the MOX facility is part of a 2000 agreement between the U.S. and Russia known as the amended U.S.-Russia Plutonium Management and Disposition Agreement (PMDA). The goal of PDMA is to neutralize 34 metric tons of weapons-grade plutonium by using it in MOX fuel for commercial power reactors. In its FY-2017 budget proposal, DOE makes clear that MFFF will be terminated:

“Aerospace Corporation completed two reports documenting its assessment of the April 2014 analysis. Additionally, in June 2015 the Secretary of Energy assembled a Red Team to assess options for the disposition of surplus weapon-grade plutonium. These analyses confirm that the MOX fuel approach will be significantly more expensive than anticipated and will require approximately $800 million to $1 billion annually for decades. As a result, the FY 2017 budget proposes that the MOX project be terminated.”

Final termination is scheduled to be complete in fiscal year 2019.

Instead of MFFF, DOE will develop a “dilute and dispose” (D&D) process that involves storage of diluted plutonium in metal containers placed in the Waste Isolation Pilot Plant (WIPP) in Carlsbad, NM. This process will derive no economic value from the energy content of the weapons-grade plutonium.   You will find the complete DOE budget proposal at the following link:

http://energy.gov/cfo/downloads/fy-2017-budget-justification

Senator Tim Scott (R-S.C.) said, “The reality of it is that without the MOX facility we cannot honor our agreement with the Russians.’’

4. In conclusion

The nuclear renaissance is over in the U.S. The expected long-term availability of low-price natural gas makes it difficult or impossible for nuclear power plants to generate electricity at a competitive price.

A future nuclear renaissance could be enabled if many states in this nation take the bold steps proposed by the New York Public Services Commission (PSC) to recognize the importance of nuclear power in the state’s generation portfolio and provide adequate financial incentives to nuclear utilities so they can operate profitably, extend the lives of existing nuclear plants, and build new nuclear plants.



Farewell Magnox: 1956 – 2015

Peter Lobner

Magnox reactors were the first generation of nuclear power plants developed in the UK. They were CO2-cooled, graphite moderated power reactors with natural uranium metal fuel. The name Magnox refers to the magnesium-aluminum alloy cladding on the metal fuel rods.

The first two Magnox sites, Calder Hall and Chapelcross, each had four dual-purpose reactors primarily intended to produce nuclear material for the UK nuclear weapons program, with the secondary role of generating electricity for UK’s national grid. The first unit at Calder Hall went critical in May 1956 and, on 27 August 1956, became the first UK nuclear power plant to connect to the national power grid. All subsequent Magnox plants were larger, two-unit commercial nuclear power plants. The UK’s fleet of Magnox plants reached a total of 26 units at 11 sites. On 30 December 2015, the final Magnox plant, Wylfa unit 1, ceased generation after operating for 44 years. This milestone ended 59 years of Magnox reactor operation in the UK.

The only remaining CO2-cooled, graphite moderated commercial power reactor in the world are the UK’s Advanced Gas-cooled Reactors (AGRs). Other commercial operators of CO2-cooled, graphite-moderated reactors have retired their units: Italy in 1987, Spain in 1990, France in 1994, and Japan in 1998. North Korea operates a small CO2-cooled, graphite-moderated reactor that likely has been used for nuclear material production.

Following is a brief overview of this pioneering reactor type.

Overview of Magnox reactors:

A Magnox reactor has a large reactor core that operated at low power density (< 1 kW/liter) and relatively temperatures, which enabled the use of uranium metal fuel and Magnox cladding. The relatively low operating pressure (typically 130 – 150 psig) of the primary circuit enabled the use mild steel for the primary pressure boundary.

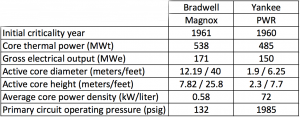
Here’s a comparison of some key parameters for the early Bradwell Magnox reactor and the similar vintage early U.S. pressurized water reactor (PWR), Yankee.

Magnox-PWR comparison

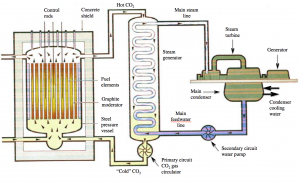
The basic gas and fluid flow paths in the earlier Magnox plants are shown in the following diagram, which shows one of four steam generators. In the closed-loop steel primary circuit, forced circulation of CO2 transfers heat from the reactor core to the steam generators, which in turn transfer heat into the secondary circuit. In the closed-loop secondary circuit, water delivered to the steam generators is heated and converted to steam, which drives turbine generators to produce electricity. The steam exhausted from the turbines is condensed in the main condensers and returned to the steam generators. An open- or closed-loop circulating water system transfers waste heat from the main condensers to a heat sink (i.e., cooling towers or a body of water).

Magnox reactor 1_IEE adapted

Image credit: adapted from The Institution of Electrical Engineers, London, ISBN 0 85296 581 8

The first two 4-unit Magnox sites, Calder Hall and Chapelcross, were dual-use sites producing nuclear material for the military and electric power for the UK power grid. Calder Hall was the world’s first nuclear power plant capable of delivering “industrial scale“ electric power (initially 35 MWe net per reactor, 140 MWe total), which far exceeded the generating capacities of the two nuclear plants that previously had connected to their local grids in Russia (Obninsk, 27 June 1954, 6 MWe) and the USA (Borax III, 17 July 1955, 500 kWe).

Calder Hall operated from 1956 to 2003 and produced weapons-grade plutonium until about 1995, when the UK government announced that the production of plutonium for weapons purposes had ceased. Chapelcross operated from 1959 to 2004. Two Chapelcross units produced tritium for the UK nuclear weapons program and required enriched uranium fuel.

The first two 2-unit Magnox commercial power stations were Berkeley and Bradwell, which were followed by seven more 2-unit Magnox stations in the UK. The physical arrangement of Magnox plants varied significantly from plant to plant, as designers revised gas circuit designs, refueling schemes (top or bottom refueling), and other features. The following diagrams show the differences between the Hinkley Point and later Sizewell gas circuits.

Magnox gas circuit-Hinkley Point

Hinkley Point with separate CO2 gas blower and steam generator.  Image credit: Nuclear Engineering, April 1965

Magnox gas circuit-Sizewell

Sizewell with CO2 gas blower integral with the steam generator. Image credit: Nuclear Engineering, April 1965

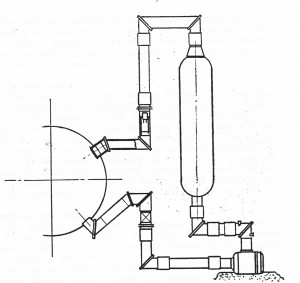
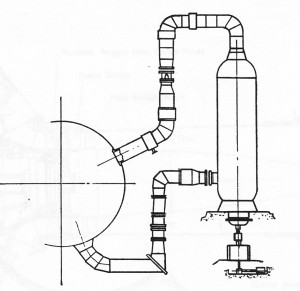
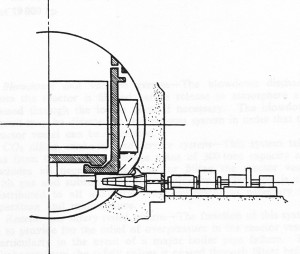
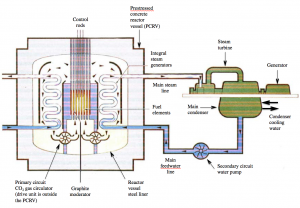
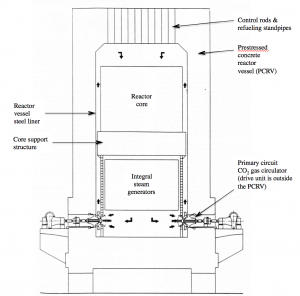
In the last two Magnox plants, Oldbury and Wylfa, the steel primary circuit pressure vessel, piping and external steam generators were replaced by an integral primary circuit housed inside a prestressed concrete reactor vessel (PCRV) with integral steam generators. The Oldbury PCRV was cylindrical and Wylfa’s was spherical. The physical arrangement for Wylfa’s primary circuit is shown in the following diagram, which shows a CO

In the last two Magnox plants, Oldbury and Wylfa, the steel primary circuit pressure vessel, piping and external steam generators were replaced by an integral primary circuit housed inside a prestressed concrete reactor vessel (PCRV) with integral steam generators. The Oldbury PCRV was cylindrical and Wylfa’s was spherical. The physical arrangement for Wylfa’s primary circuit is shown in the following diagram, which shows a CO2 blower drive unit outside the PCRV.

Magnox gas circuit - Wylfa

Wylfa integral primary circuit.  Image credit: Nuclear Engineering, April 1965

The basic gas and fluid flow paths in the Oldbury and Wylfa Magnox plants are shown in the following diagram. Note that steam generator modules surrounding the reactor core inside the PCRV.

Magnox reactor 2_IEE adapted

Image credit: adapted from The Institution of Electrical Engineers, London, ISBN 0 85296 581 8

A generic issue for all Magnox plants was the corrosion of mild steel components by the high temperature CO2 coolant. To manage this issue, the average core outlet gas temperature was reduced from the original design temperature of 414 °C to 360 – 380 °C, with a corresponding decrease in net power output and thermal efficiency.

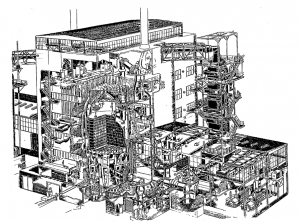
None of the Magnox reactors are enclosed in a pressure-retaining containment building, as is common practice for most other types of power reactors. In the early Magnox plants, only the reactor was inside an industrial-style building , while the steam generators and parts of the primary circuit piping were outside the building, as shown in the following diagram of a single unit at Calder Hall. The steam generators were enclosed in later plants, primarily to protect them from the weather.

Calder Hall

Image source: NKS-2, ISBN 87-7893-050-2

Accident conditions in a Magnox reactor are very different than in a water-cooled reactor. Magnox reactors do not encounter coolant phase change during an accident or have a risk of the core becoming “uncovered” because of a loss of coolant through a breach in the primary circuit. The low core power density, the large heat capacity of the graphite moderator, and the availability of natural circulation flow paths for core cooling limit post-accident core temperatures. On this basis, Magnox reactors were permitted to operate with three barriers to the release of fission products to the atmosphere: the metal fuel matrix, the Magnox fuel cladding, and the mild steel primary circuit pressure boundary.

Export Magnox plants:

The following two single-unit Magnox nuclear power plants were exported to Italy and Japan.

Latina:       Operated from 1963 to 1987; originally rated at 210 MWe, derated to 160 MWe

Tōkai 1:     Operated from 1966 to 1998; 166 MWe

UK’s successor to the Magnox:

The UK’s second generation commercial power reactor is the Advanced Gas-cooled Reactor (AGR), which is a more advanced, higher-temperature, CO2-cooled, graphite moderated reactor with stainless steel clad, enriched UO2 fuel. The UK’s fleet of AGRs totals 14 units at 6 sites. All are currently operating. Retirement of the oldest units is expected to start in about 2023.

French CO2-cooled, graphite moderated reactors:

In the early 1950s, the UK and France arrived at the same basic fuel / coolant / moderator selection for their first generation power reactors:

  • Natural uranium metal fuel
  • CO2 coolant
  • Graphite moderator

This choice was driven largely by the desire for nuclear independence and the unavailability of enriched uranium, which the U.S. refused to export, and heavy water (moderator), which was not available in significant quantities.

In France, these reactors were known as UNGG (Uranium Naturel Graphite Gaz), which were developed independently of the UK Magnox reactors. All UNGGs used magnesium-zirconium alloy fuel cladding instead of the Magnox magnesium-aluminum alloy.

The first UNGGs were the dual-use Marcoule G2 and G3 reactors, which produced nuclear material for the French nuclear weapons programs and also had a net electric power output of about 27 MWe. The horizontal reactor core was housed in a steel-lined PCRV with external steam generators.

Initial criticality of Marcoule G2 occurred on 21 July 1958, and it first generated electricity in April 1959. Marcoule G3 began operation in 1960. G2 was retired in 1980 and G3 in 1984.

Electricité de France (EDF) built six larger UNGG commercial nuclear power plants in three basic configurations:

  • The early Chinon A1 and A2 plants had a vertical reactor core in a steel primary circuit. These plants had net electrical outputs of 70 MWe (A1) and 200 MWe (A2). A1 operated for 10 years from 1963 to 1973. A2 operated longer, from 1965 to 1985.
  • The later 480 MWe Chinon A3 plant adopted a different design, with a vertical reactor core in a PCRV with external steam generators. A3 operated for 24 years, from 1966 to 1990.
  • The 480 – 515 MWe A1 and A2 plants at Saint Laurent-des-Eaux and the 540 MWe Bugey 1 plant adopted a more advanced and compact design, with an integral primary circuit in a steel-lined PCRV. Unlike the Wylfa Magnox plant, the steam generators were placed under the reactor core in a tall PCRV, as shown in the following diagram. This basic arrangement is similar to the U.S. Fort St. Vrain helium-cooled high-temperature gas-cooled reactor (HTGR) built in the 1970s. Saint Laurent A1 operated from 1969 to 1990, A2 from 1971 to 1994, and Bugey 1 from 1972 to 1994.

St Laurent gas circuit adapted

Image credit: adapted from Nuclear Engineering, Feb 1968

Export UNGG:

France exported to Spain one UNGG similar to the Saint Laurent-des-Eaux plant. This became the 508 MWe Vandellos unit 1 power plant, which operated from 1972 to 1990.

French successor to the UNGG:

After Bugey 1, France abandoned gas-cooled reactor technology for commercial nuclear power plants. Pressurized water reactor (PWR) technology was chosen for the next generation of French commercial power reactors: the CP0 900 MW PWR.

North Korean CO2-cooled, graphite moderated reactor:

North Korea’s Yongbyon nuclear plant is a CO2-cooled, graphite-moderated reactor with natural uranium fuel. This is a logical choice of reactor type because natural uranium and graphite are domestically available in North Korea. Yongbyon is believed to be a dual-use production reactor that is modeled after the UK’s Calder Hall Magnox reactor.

Yongbyon is believed to have a thermal power in the 20 – 25 MWt range and a net electrical output of about 5 MWe. Reactor operation began in 1986. In 2007, operation of Yongbyon was disabled when the cooling towers were demolished to comply with an international agreement related to preventing North Korean production of nuclear material. On 2 April 2013, North Korea announced it would restart Yongbyon. NTI reported that Yongbyon has been operating since September 2013. See details at the following link:

http://www.nti.org/learn/facilities/766/

Fukushima Daiichi Current Status and Lessons Learned

Peter Lobner

The International Atomic Energy Agency (IAEA) presents a great volume of information related to the 12 March 2011 Fukushima Daiichi accident and the current status of planning and recovery actions on their website at the following link:

https://www.iaea.org/newscenter/focus/fukushima

From this web page, you can navigate to many resources, including: Fukushima Daiichi Status Updates, 6 September 2013 – Present. Here is the direct link to the status updates:

https://www.iaea.org/newscenter/focus/fukushima/status-update

The IAEA’s voluminous 2015 report, The Fukushima Daiichi Accident, consists of the Report by the IAEA Director General and five technical volumes. The IAEA states that this report is the result of an extensive international collaborative effort involving five working groups with about 180 experts from 42 Member States with and without nuclear power programs and several international bodies. It provides a description of the accident and its causes, evolution and consequences based on the evaluation of data and information from a large number of sources.

IAEA Fukushima  Source: IAEA

You can download all or part of this report and its technical annexes at the following link to the IAEA website:

http://www-pub.iaea.org/books/IAEABooks/10962/The-Fukushima-Daiichi-Accident

There have been many reports on the Fukushima Daiichi accident and lessons learned. A few of the more recent notable documents are identified briefly below along with the web links from which you can download these documents.

Japan’s Nuclear Regulatory Authority (NRA):

A summary of the NRA’s perspective on Fukushima accident and lessons learned is the subject of the March 2014 presentation, “Lessons Learned from the Fukushima Dai-ichi Accident and Responses in New Regulatory Requirements.” You can download this presentation at the following link:

http://www-pub.iaea.org/iaeameetings/cn233p/OpeningSession/1Fuketa.pdf

 National Academy of Sciences:

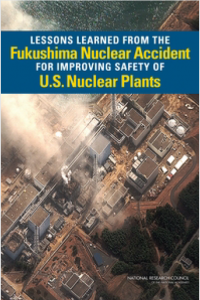
The U.S. Congress asked the National Academy of Sciences to conduct a technical study on lessons learned from the Fukushima Daiichi accident for improving safety and security of commercial nuclear power plants in the U.S. This study was carried out in two phases. The Phase 1 report, Lessons Learned from the Fukushima Nuclear Accident for Improving Safety of U.S. Nuclear Plants, was issued in 2014, and focused on the causes of the Fukushima Daiichi accident and safety-related lessons learned for improving nuclear plant systems, operations, and regulations exclusive of spent fuel storage.

NAP Fukushima Phase 1  Source: NAP

If you have a MyNAP account, you can download the Phase 1 report at the following link to the National Academies Press website:

http://www.nap.edu/catalog/18294/lessons-learned-from-the-fukushima-nuclear-accident-for-improving-safety-of-us-nuclear-plants

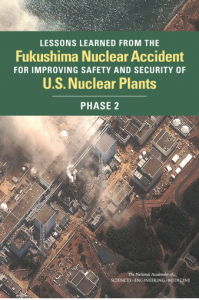
The Phase 2 report, Lessons Learned from the Fukushima Accident for Improving Safety and Security of U.S. Nuclear Plants: Phase 2, recently issued in 2016, focuses on three issues: (1) lessons learned from the accident for nuclear plant security, (2) lessons learned for spent fuel storage, and (3) reevaluation of conclusions from previous Academies studies on spent fuel storage.

NAP Fukushima Phase 2  Source: NAP

If you have a MyNAP account, you can download the Phase 2 report at the following link:

http://www.nap.edu/catalog/21874/lessons-learned-from-the-fukushima-nuclear-accident-for-improving-safety-and-security-of-us-nuclear-plants

U.S. Nuclear Regulatory Commission (NRC):

A summary of the U.S. NRC’s response to the Fukushima accident is contained in the May 2014 presentation, “NRC Update, Fukushima Lessons Learned.” You can download this presentation at the following link:

http://nnsa.energy.gov/sites/default/files/nnsa/07-14-multiplefiles/May%2013%20-%208_LAUREN%20GIBSON%20NRC%20Update%20-%20Fukushima%20Lessons%20Learned.pdf

U.S. Energy Information Administration’s (EIA) Early Release of a Summary of its Annual Energy Outlook (AEO) Provides a Disturbing View of Our Nation’s Energy Future

Peter Lobner

Each year, the EIA issues an Annual Energy Outlook that provides energy industry recent year data and projections for future years. The 2016 AEO includes actual data of 2014 and 2015, and projections to 2040. These data include:

  • Total energy supply and disposition demand
  • Energy consumption by sector and source
  • Energy prices by sector and source
  • Key indicators and consumption by sector (Residential, Commercial, Industrial, Transportation)
  • Electricity supply, disposition, prices and emissions
  • Electricity generating capacity
  • Electricity trade

On 17 May, EIA released a PowerPoint summary of AEO2016 along with the data tables used in this Outlook.   The full version of AEO2016 is scheduled for release on 7 July 2016.

You can download EIA’s Early Release PowerPoint summary and any of the data tables at the following link:

http://www.eia.gov/forecasts/aeo/er/index.cfm

EIA explains that this Summary features two cases: the Reference case and a case excluding implementation of the Clean Power Plan (CPP).

  • Reference case: A business-as-usual trend estimate, given known technology and technological and demographic trends. The Reference case assumes Clean Power Plan (CPP) compliance through mass-based standards (emissions reduction in metric tones of carbon dioxide) modeled using allowances with cooperation across states at the regional level, with all allowance revenues rebated to ratepayers.
  • No CPP case: A business-as-usual trend estimate, but assumes that CPP is not implemented.

You can find a good industry assessment of the AEO2016 Summary on the Global Energy World website at the following link:

http://www.globalenergyworld.com/news/24141/Obama_Administration_s_Electricity_Policies_Follow_the_Failed_European_Model.htm

A related EIA document that is worth reviewing is, Assumptions to the Annual Energy Outlook 2015, which you will find at the following link:

http://www.eia.gov/forecasts/aeo/assumptions/

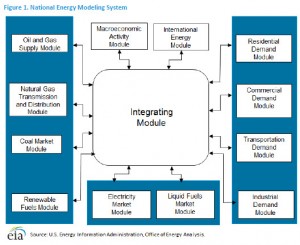
This report presents the major assumptions of the National Energy Modeling System (NEMS) used to generate the projections in AE02015. A 2016 edition of Assumptions is not yet available. The functional organization of NEMS is shown below.

EIA NEMS

The renewable fuels module in NEMS addresses solar (thermal and photovoltaic), wind (on-shore and off-shore), geothermal, biomass, landfill gas, and conventional hydroelectric.

The predominant renewable sources are solar and wind, both of which are intermittent sources of electric power generation. Except for the following statements, the EIA assumptions are silent on the matter of energy storage systems that will be needed to manage electric power quality and grid stability as the projected use of intermittent renewable generators grows.

  • All technologies except for storage, intermittents and distributed generation can be used to meet spinning reserves
  • The representative solar thermal technology assumed for cost estimation is a 100-megawatt central-receiver tower without integrated energy storage
  • Pumped storage hydroelectric, considered a nonrenewable storage medium for fossil and nuclear power, is not included in the supply

In my 4 March 2016 post, “Dispatchable Power from Energy Storage Systems Help Maintain Grid Stability,” I addressed the growing importance of such storage systems as intermittent power generators are added to the grid. In the context of the AEO, the EIA fails to address the need for these costly energy storage systems and they fail to allocate the cost of energy storage systems to the intermittent generators that are the source of the growing demand for the energy storage systems. As a result, the projected price of energy from intermittent renewable generators is unrealistically low in the AEO.

Oddly, NEMS does not include a “Nuclear Fuel Module.” Nuclear power is represented in the Electric Market Module, but receives no credit as a non-carbon producing source of electric power. As I reported in my posts on the Clean Power Plan, the CPP gives utilities no incentives to continue operating nuclear power plants or to build new nuclear power plants (see my 27 November 2015 post, “Is EPA Fudging the Numbers for its Carbon Regulation,” and my 2 July 2015 post, “EPA Clean Power Plan Proposed Rule Does Not Adequately Recognize the Role of Nuclear Power in Greenhouse Gas Reduction.”). With the current and expected future low price of natural gas, nuclear power operators are at a financial disadvantage relative to operators of large central station fossil power plants. This is the driving factor in the industry trend of early retirement of existing nuclear power plants.

The following 6 May 2016 announcement by Exelon highlights the current predicament of a high-performing nuclear power operator:

“Exelon deferred decisions on the future of its Clinton and Quad Cities plants last fall to give policymakers more time to consider energy market and legislative reforms. Since then, energy prices have continued to decline. Despite being two of Exelon’s highest-performing plants, Clinton and Quad Cities have been experiencing significant losses. In the past six years, Clinton and Quad Cities have lost more than $800 million, combined.“

“Exelon announced today that it will need to move forward with the early retirements of its Clinton and Quad Cities nuclear facilities if adequate legislation is not passed during the spring Illinois legislative session, scheduled to end on May 31 and if, for Quad Cities, adequate legislation is not passed and the plant does not clear the upcoming PJM capacity auction later this month.”

“Without these results, Exelon would plan to retire Clinton Power Station in Clinton, Ill., on June 1, 2017, and Quad Cities Generating Station in Cordova, Ill., on June 1, 2018.”

You can read Exelon’s entire announcement at the following link:

http://www.exeloncorp.com/newsroom/exelon-statement-on-early-retirement-of-clinton-and-quad-cities-nuclear-facilities

Together the Clinton and Quad Cities nuclear power plants have a combined Design Electrical Rating of 2,983 MWe from a non-carbon producing source. For the period 2013 – 2015, the U.S. nuclear power industry as a whole had a net capacity factor of 90.41. That means that the nuclear power industry delivered 90.41% of the DER of the aggregate of all U.S. nuclear power plants. The three Exelon plants being considered for early retirement exceeded this industry average performance with the following net capacity factors: Quad Cities 1 @ 101.27; Quad Cities 2 @ 92.68, and Clinton @ 91.26.

For the same 2013 – 2015 period, EIA reported the following net capacity factors for wind (32.96), solar photovoltaic (27.25), and solar thermal (21.25).  Using the EIA capacity factor for wind generators, the largest Siemens D7 wind turbine, which is rated at 7.0 MWe, delivers an average output of about 2.3 MWe. We would need more than 1,200 of these large wind turbines just to make up for the electric power delivered by the Clinton and Quad Cities nuclear power plants. Imagine the stability of that regional grid.

CPP continues subsidies to renewable power generators. In time, the intermittent generators will reduce power quality and destabilize the electric power grid unless industrial-scale energy storage systems are deployed to enable the grid operators to match electricity supply and demand with reliable, dispatchable power.

As a nation, I believe we’re trending toward more costly electricity with lower power quality and reliability.

I hope you share my concerns about this trend.

Is EPA Fudging the Numbers for its Carbon Regulation?

Peter Lobner

In my 2 July 2015 post, I commented on significant deficiencies in the U.S. Environmental Protection Agency (EPA) Clean Power Plan proposed rule. On 3 August 2015, the EPA announced the final rule. You can read the final rule for existing power plants, the EPA’s regulatory impact analysis, and associated fact sheets at the following link:

http://www2.epa.gov/cleanpowerplan/clean-power-plan-existing-power-plants

The Institute for Energy Research (IER) is a not-for-profit organization that conducts research and analysis on the functions, operations, and government regulation of global energy markets. The IER home page is at the following link:

http://instituteforenergyresearch.org

On 24 November 2015, the IER published an insightful article entitled, Is EPA Fudging the Numbers for its Carbon Regulation?, which I believe is worth your attention. The IER’s main points are:

  1. U.S. Energy Information Agency’s (EIA) Annual Energy Outlook (AEO) is the data source usually used by federal government agencies in their analysis of energy issues.
  2. EPA stands out as an exception. It frequently chooses not to use EIA data, and instead develops it’s own duplicative, different data.
  3. In the case of the Clean Power Plan, the EPA’s own data significantly underestimates the number of coal plants that need to be retired to comply with the Plan. The result is a much lower estimate of the economic impact of the Plan than if EIA data had been used.

It appears to me that the EPA created and used data skewed to produce a more favorable, but likely unrealistic, estimate of the economic impact that will borne by the U.S. power industry and power customers as the Clean Power Plan is implemented. Form your own opinion after reading the full IER article at the following link:

http://instituteforenergyresearch.org/analysis/is-epa-fudging-the-numbers-for-its-carbon-regulation/

Update 19 Feb 2016

On 8 February 2016, the American Nuclear Society (ANS) released their, “Nuclear in the States Toolkit Version 1.0 – Policy Options for States Considering the Role of Nuclear Power in Their Energy Mix.” The toolkit catalogs policies related to new and existing nuclear reactors for state policymakers to consider as they draft their Clean Power Plan compliance strategies.   The Toolkit identifies a range of policy options that individually or in aggregate can make nuclear generation a more attractive generation alternative for states and utilities.

You can download this document at the following link:

http://nuclearconnect.org/wp-content/uploads/2016/02/ANS-NIS-Toolkit-download.pdf

On 9 February 2016, the U.S. Supreme Court issues a stay on implementation of the EPA’s Clean Power Plan (CPP) pending the resolution of legal challenges to the program in court.

The ANS noted that, “….the stay provides them (the states) an opportunity to take a new look at the carbon offsets that existing nuclear plants provide, which they weren’t encouraged to do under the CPP rules.”

What are the Sources of Electric Power in the USA?

Peter Lobner

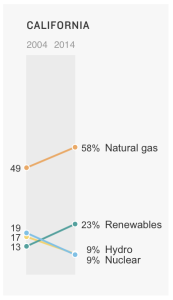
The sources of electric power used in California have changed significantly between 2004 and 2014. The distribution of California’s energy sources, among natural gas, renewables (wind & solar), hydroelectric, and nuclear is shown in the following chart. California does not use coal or petroleum to generate electric power.

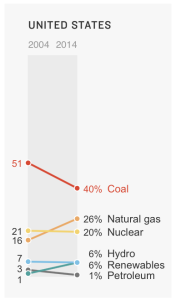
CA energy use 2004 - 2014  USA energy use 2004 - 2014

Nationally, on a percentage basis, coal use is on the decline and use of natural gas and renewables is on the increase in most states.

Check out the following NPR website, which is the source of the above charts, to see similar charts for all 50 states.

http://www.npr.org/2015/09/10/319535020/coal-gas-nuclear-hydro-how-your-state-generates-power?utm_source=howtogeek&utm_medium=email&utm_campaign=newsletter

New Report Quantifies the Value of Nuclear Power Plants to the U.S. Economy and Their Contribution to Limiting Greenhouse Gas (GHG) Emissions

Peter Lobner

On 2 July 2015, I made a long post entitled, “EPA Clean Power Plan Proposed Rule Does Not Adequately Recognize the Role of Nuclear Power in Greenhouse Gas Reduction.”

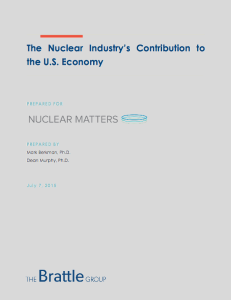
On 7 July 2015, Nuclear Matters (http://www.nuclearmatters.com) issued a related,  comprehensive report, prepared by economists from The Brattle Group (http://www.brattle.com), that quantifies the significant value of nuclear power plants to the U.S. economy and the contribution made to limiting greenhouse gas (GHG) emissions. Their report’s findings include:

  • U.S. nuclear energy plants contribute $60 billion annually to gross domestic product (GDP), in addition to other economic and societal benefits.
  • The nuclear industry accounts for about 475,000 full-time jobs (direct and secondary).
  • Energy generated from nuclear plants avoids emissions that otherwise would have been generated by fossil power plants.
    • 573 million tons of carbon dioxide (CO2) emissions, worth an additional $25 billion annually if valued at the U.S. government’s estimate for the social cost of carbon.
    • 650,000 tons of nitrogen oxides (NOX) and over one million tons of sulfur dioxide (SO2) emissions annually, together valued at $8.4 billion using the National Academy of Science’s externality estimates.
  • Nuclear power helps keep electricity prices low. Without nuclear power, retail electricity rates could increase by about 6% on average. Keeping electricity prices low is the primary means by which nuclear power boosts the economy.
  • Provides $10 billion in federal tax revenues and $2.2 billion in state tax revenues annually.

You can download the report, entitled, The Nuclear Industry’s Contribution to the U.S. Economy” at the link below.  The report also describes the modeling techniques used to estimate economic value with and without the contributions from nuclear power.

http://www.brattle.com/system/news/pdfs/000/000/895/original/The_Nuclear_Industry’s_Contribution_to_the_U.S._Economy.pdf?1436280444

Brattle-Group-nuc-power-economics-report-7-Jul-15 R1

EPA Clean Power Plan Proposed Rule Does Not Adequately Recognize the Role of Nuclear Power in Greenhouse Gas Reduction

Peter Lobner

On June 2, 2014, the U.S. Environmental Protection Agency (EPA) proposed what they called, “a common sense plan to cut carbon pollution from power plants.”  You can access the Clean Power Plan Proposed Rule and many related documents at the following EPA link:

http://www2.epa.gov/carbon-pollution-standards/clean-power-plan-proposed-rule

This Plan proposes to limit carbon emissions from existing fossil fuel fired electric generating units, including steam generating, integrated gasification combined cycle, or stationary combustion turbines (in either simple-cycle or combined-cycle configuration) operating or under construction by January 8, 2014. Main points of the Clean Power Plan include:

  • Wind and solar power are the preferred EPA options.
  • Natural gas is an interim solution.
  • New nuclear capacity is not a compliance option.
  • The EPA allows compliance credit for:
    • New nuclear plants currently under construction, and
    • Preservation of existing nuclear plants that might otherwise be retired

I’ve already formed my opinion on the Clean Power Plan. To help you form your opinion, I recommend that you refer to the following recent analyses by four respected government and industry organizations that have reviewed the Clean Power Plan.

Institute for Energy Research (IER)

On 15 June 2015, the IER issued the results of their analysis entitled, EPA’s Clean Power Plan Ignores New Nuclear as a Compliance Option. IER concluded that the compliance formulae in the Clean Power Plan are biased toward new wind and solar power development. Deployment of these technologies, which currently are not capable of delivering reliable capacity, will decrease the reliability of the electric grid. IER also concluded that the Clean Power Plan will result in much higher electricity prices for all American consumers, while having only a marginal impact on global temperature based on EPA’s computer models.

You can read the IER analysis at the following link:

http://instituteforenergyresearch.org/analysis/epas-clean-power-plan-ignores-new-nuclear-as-a-compliance-option/

National Association of Clean Air Agencies (NACAA)

On 21 May 2015, the NACAA issued a report entitled, Implementing EPA’s Clean Power Plan: A Menu of Options, containing 25 chapters, each of which explores a particular approach to greenhouse gas (GHG) reduction in the electric power sector.  NACAA is a nonpartisan, nonprofit association of air pollution control agencies in 41 states, the District of Columbia, four territories and 116 metropolitan areas.  Each chapter of their Menu of Options includes a brief descriptions of: (1) the option and it’s pros and cons; (2) the regulatory backdrop, policy underpinnings, implementation experience, and GHG reduction potential associated with the option; and (3) benefits of the option to society and the utility system, including costs and cost-effectiveness. In the last chapter, a variety of emerging technologies and other policy options for reducing GHG emissions are addressed.

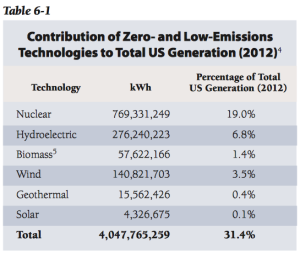
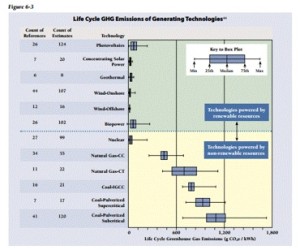
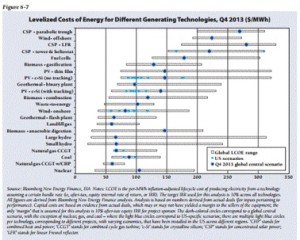
An interesting table and two figures included in Chapter 6 of the Menu of Options are reproduced below.

NACAA Table 6-1 Source: NACAA

In 2012, electric power generation technologies with zero or low GHG emissions accounted for 31.4% of the USA’s total generating capacity. The data in Table 6-1 shows that 82.2% of the zero or low GHG emission generating capacity came from nuclear and hydroelectric power plants. The remaining low-emission generation capacity came from biomass, wind, geothermal, and solar power plants.

NACAA Figure 6-3Source: NACAA

In Figure 6-3, “life cycle GHG emissions” include those associated with operation as well as construction, fabrication, and fuel processing.  While nuclear power is not included among the “technologies powered by renewable resources”, it’s clear in Figure 6-3 that nuclear power meets the GHG reduction performance of the other technologies using renewable resources.

NACAA Figure 6-7  Source: NACAA

In Figure 6-7, note the relative cost-of-energy differential between nuclear power and fossil power. This difference makes it difficult for nuclear power plants to compete head-to-head with coal and natural gas merchant power plants and encourages the early retirement of some nuclear power plants on economic grounds.  While most renewable power sources have even higher costs-of-energy, various financial schemes subsidize their power generation.

You can download individual chapters or the entire NACAA Menu of Options at the following link:

http://www.4cleanair.org/NACAA_Menu_of_Options

U.S. Energy Information Administration (EIA)

On 22 May 2015, the EIA released their analysis of the Clean Power Plan. The EIA analysis supports the IER finding that the Clean Power Plan will result in much higher electricity prices for all American consumers, even in a scenario that allows GHG reduction credit for new nuclear generation.

You can read the EIA press release at the following link:

http://www.eia.gov/analysis/requests/powerplants/cleanplan/

You also can download a PDFs copy of the May 2015 EIA report, Analysis of the Impacts of the Clean Power Plan, at the following link:

http://www.eia.gov/analysis/requests/powerplants/cleanplan/pdf/powerplant.pdf

Nuclear Energy Institute’s (NEI)

To address the “clean power” attributes of nuclear power, I refer you to an NEI Knowledge Center webpage: Environment: Emissions Prevented, which you will find at the following link:

http://www.nei.org/Knowledge-Center/Nuclear-Statistics/Environment-Emissions-Prevented

Here you’ll find a link to data on the amount of sulfur dioxide, nitrogen oxides, and carbon dioxide emissions avoided in the U.S. during the years 1995 to 2014 by virtue of having about 20% of U.S. electric power generated by nuclear power plants instead of fossil power plants. NEI reports the total avoided emissions for this period as follows:

  • Sulfur dioxide: 57.75 million short tons (52.4 million metric tons)
  • Nitrogen oxides: 22.92 million short tons (20.8 million metric tons)
  • Carbon dioxide: 13,063.6 million short tons (11,851 million metric tons)

On this website, NEI states:

“Nuclear energy facilities avoided 595 million metric tons of carbon dioxide in 2014 across the U.S. This is nearly as much carbon dioxide as is released from nearly 135 million cars, which is more than all U.S. passenger cars. The U.S. produces more than five billion metric tons of carbon dioxide each year.

Without the emission avoidances from nuclear generation, required reductions in the U.S. would increase by more than 50 percent to achieve targets under the Kyoto Protocol.”

2013 paper, “Prevented Mortality and Greenhouse Gas Emissions from Historical and Projected Nuclear Power”.

Supporting the above NEI position on the GHG reduction merits of nuclear power, there is a related 2013 article by NASA scientists from Goddard Institute for Space Studies and Columbia University entitled, “Prevented Mortality and Greenhouse Gas Emissions from Historical and Projected Nuclear Power”.  You can read a short article on this paper on the Scientific American website at the following link:

http://blogs.scientificamerican.com/the-curious-wavefunction/nuclear-power-may-have-saved-1-8-million-lives-otherwise-lost-to-fossil-fuels-may-save-up-to-7-million-more/

You also can read the complete paper at the following link:

http://pubs.acs.org/doi/pdf/10.1021/es3051197

In their study, authors Pushker A. Kharecha and James E. Hansen used historical production data from 1971 to 2009 and calculated that global nuclear power has prevented an average of 1.84 million air pollution-related deaths and 64 gigatonnes of CO2-equivalent (GtCO2-eq) greenhouse gas (GHG) emissions that would have resulted from fossil fuel burning. From their analysis, the authors drew the following conclusion:

“In conclusion, it is clear that nuclear power has provided a large contribution to the reduction of global mortality and GHG emissions due to fossil fuel use. If the role of nuclear power significantly declines in the next few decades, the International Energy Agency asserts that achieving a target atmospheric GHG level of 450 ppm CO2-eq would require “heroic achievements in the deployment of emerging low- carbon technologies, which have yet to be proven. Countries that rely heavily on nuclear power would find it particularly challenging and significantly more costly to meet their targeted levels of emissions.”

So, what do you think about the EPA’s proposed Clean Power Plan? Is this the “common sense plan to cut carbon pollution from power plants” promised by EPA; a politically motivated piece of crap designed to kill the nuclear and coal power industries; or something in between?

Kurzgesagt Explains the Fermi Paradox: Where are all the aliens?

Peter Lobner, updated 17 November 2022

Kurzgesagt (German for “in a nutshell“) is a Munich-based design studio with a distinctive perspective on design and animation in the fields of education, science and commerce.  For background information on Kurzgesagt, visit their website here: https://kurzgesagt.org/agency/

You’ll find their YouTube channel with a library of briefings at the following link: https://www.youtube.com/channel/UCsXVk37bltHxD1rDPwtNM8Q

From here you can navigate to many intriguing and entertaining animated briefings.  Four Kurzgesagt briefings address the following questions regarding extraterrestrial life:

“The universe is unbelievably big – trillions of stars and even more planets. Soo… there just has to be life out there, right? But where is it? Why don’t we see any aliens? Where are they? And more importantly, what does this tell us about our own fate in this gigantic and scary universe?”

I hope you’ll enjoy these Kurzgesagt briefings:

The Fermi Paradox — Where Are All The Aliens? Part 1:  https://www.youtube.com/watch?v=sNhhvQGsMEc

The Fermi Paradox — Where Are All The Aliens? Part 2:  https://www.youtube.com/watch?v=1fQkVqno-uI

The Great Filter:  Why Alien Life Would be our Doom:  https://www.youtube.com/watch?v=UjtOGPJ0URM

What Do Alien Civilizations Look Like? The Kardashev Scale:  https://www.youtube.com/watch?v=rhFK5_Nx9xY

Aliens under the Ice – Life on Rogue Planets:  https://www.youtube.com/watch?v=M7CkdB5z9PY

For more information