Another Record-setting Year for Global Temperature

Peter Lobner

The National Aeronautics and Space Administration’s (NASA) Goddard Institute for Space Studies (GISS) released the results of an analysis by NASA and National Oceanic and Atmospheric Administration (NOAA) that showed that globally-averaged temperature in 2015 was the highest since modern record keeping began in 1880. You can read the NOAA / NASA press release at the following link:

http://www.giss.nasa.gov/research/news/20160120/

You can download a copy of the more detailed NOAA / NASA briefing at the following link:

http://www.giss.nasa.gov/research/news/20160120/noaa_nasa_global_analysis_2015.pdf

The analysis shows that globally-averaged temperature in 2015 exceeded the previous mark set in 2014 by 0.23 degrees Fahrenheit (0.13 degrees Celsius) and continued a warming trend, as shown in the following graph.

gistemp_graph_2015Source: NASA Goddard

In this graph, the zero on the y-axis is the average temperature for a 30-year period from 1951 to 1980. The trend lines show results for El Niño years (orange), La Niña years (blue), and all years (dashed line). The 2015 globally-averaged temperature was:

  • 57° F (0.87° C) above the 1951 to 1980 30-year (baseline) average, and
  • 62° F (0.90° C) above the 1901 to 2000 100-year (20th century) average

The distribution of global temperatures relative to the 1951 – 80 baseline is shown in the following charts.

NOAA:NASA briefing_1_Jan2016

NOAA:NASA briefing_2_Jan2016Source, both graphics: NOAA / NASA Annual Global Analysis for 2015

The NOAA / NASA press release cited above includes an animation that helps visualize Earth’s long-term warming trend based on data from 1880 to 2015. NOAA / NASA note that phenomena such as El Niño or La Niña, which warm or cool the tropical Pacific Ocean, can contribute to short-term variations in global average temperature. A warming El Niño was in effect for most of 2015

The full 2015 surface temperature data set and the complete methodology used by NOAA / NASA in their analysis are available to the public on the GISS Surface Temperature Analysis (GISTEMP) webpage at the following link:

http://data.giss.nasa.gov/gistemp/

The availability of the data and the analytical methodology allows the NOAA / NASA results to be subject to independent scrutiny. I commend NOAA and NASA for their openness in this matter, which will aid in reaching scientific consensus on the NOAA / NASA results.

This behavior by NOAA / NASA is a stark contrast to the United Nations (UN) Intergovernmental Panel on Climate Change (IPCC), which has failed to provide full public access to their underlying data and analytical methodologies and has been criticized for failing to rigorously apply the scientific method in their work. To help understand why the IPCC claim of “scientific consensus” is without merit, the Nongovernmental International Panel on Climate Change (NIPCC) published the book, “Why Scientists Disagree About Global Warming,” on 30 November 2015. You can download this document for free at the following link:

https://www.heartland.org/policy-documents/why-scientists-disagree-about-global-warming

To help put this in perspective, I thank cartoonist Wiley Miller for the following timely and insightful cartoon published on 20 January 2016. I challenge you to apply this cartoon to your understanding of the climate change debate.

Cartoon Science_Jan2016Source: San Diego Union Tribune

Relax, the Planetary Defense Officer has the Watch

Peter Lobner

On 7 January 2016, NASA formalized its ongoing program for detecting and tracking Near-Earth Objects (NEOs) by establishing the Planetary Defense Coordination Office (PDCO). You can read the NASA announcement at the following link:

https://www.nasa.gov/feature/nasa-office-to-coordinate-asteroid-detection-hazard-mitigation

PDCO is responsible for supervision of all NASA-funded projects to find and characterize asteroids and comets that pass near Earth’s orbit around the sun. PDCO also will take a leading role in coordinating interagency and intergovernmental efforts in response to any potential impact threats. Specific assigned responsibilities are:

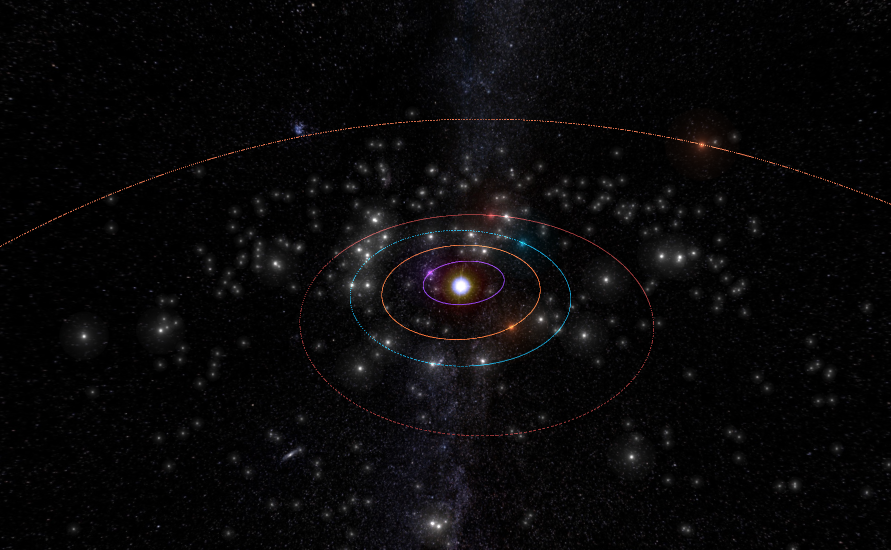
  • Ensuring the early detection of potentially hazardous objects (PHOs), which are defined as asteroids and comets whose orbits are predicted to bring them within 0.05 Astronomical Units (AUs) of Earth (7.48 million km, 4.65 million miles); and of a size large enough to reach Earth’s surface – that is, greater than 30 to 50 meters (98.4 to 164.0 feet);
  • Tracking and characterizing PHOs and issuing warnings about potential impacts;
  • Providing timely and accurate communications about PHOs; and
  • Performing as a lead coordination node in U.S. Government planning for response to an actual impact threat.

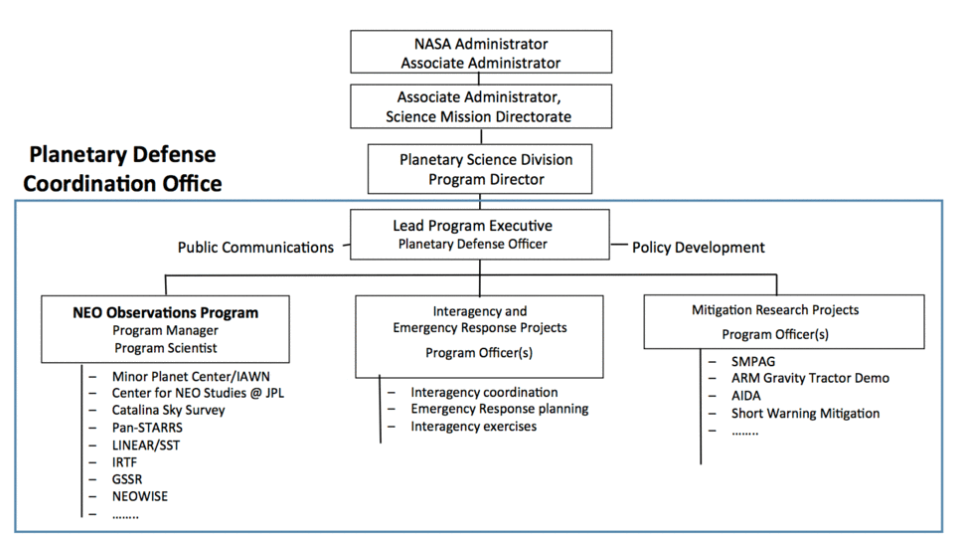
As you can see in the following organization chart, PDCO is part of NASA’s Planetary Science Division, in the agency’s Science Mission Directorate in Washington D.C.  PDCO is led by Lindley Johnson, longtime NEO program executive, who now has the very impressive title of “Planetary Defense Officer”.
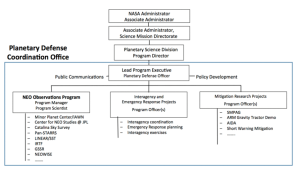
Planetary Defense Coordination OfficeSource: NASA PDCO

You can find out more at the PDCO website at the following link:

https://www.nasa.gov/planetarydefense

The PDCO includes the Near Earth Object (NEO) Observation Program, which was established in 1998 in response to a request from the House Committee on Science that NASA find at least 90% of 1 km (0.62 mile) and larger NEOs. That goal was achieved by end of 2010.

The NASA Authorization Act of 2005 increased the scope of NEO objectives by amending the National Aeronautics and Space Act of 1958 (“NASA Charter”) by adding the following new functional requirement:

 ‘‘The Congress declares that the general welfare and security of the United States require that the unique competence of the National Aeronautics and Space Administration be directed to detecting, tracking, cataloging, and characterizing near-Earth asteroids and comets in order to provide warning and mitigation of the potential hazard of such near-Earth objects to the Earth.’’

 This was further clarified by stating that NASA will:

“…plan, develop, and implement a Near-Earth Object Survey program to detect, track, catalogue, and characterize the physical characteristics of near-Earth objects equal to or greater than 140 meters (459 feet) in diameter in order to assess the threat of such near-Earth objects to the Earth. It shall be the goal of the Survey program to achieve 90 percent completion of its near-Earth object catalog within fifteen years (by 2020)”

The contractors supporting the NASA NEO Observation Program are Jet propulsion Laboratory (JPL), Massachusetts Institute of Technology (MIT) / Lincoln laboratory, Smithsonian Astrophysical Observatory, University Space Research Association, University of Arizona, and University of Hawaii / Institute of Astronomy.

Once detected, NEO orbits are precisely predicted and monitored by the Center for NEO Studies (CNEOS) at JPL. Their website is at the following link:

http://neo.jpl.nasa.gov/neo/

The catalog of known NEOs as of 3 November 2015 included 13,206 objects. NASA reports that new NEOs are being identified at a rate of about 1,500 per year. Roughly half of the known NEOs – about 6,800 – are objects larger than 140 meters (459 feet) in diameter. The estimated population of NEOs of this size is about 25,000. Current surveys are finding NEOs of this size at a rate of about 500 per year.  Recent encounters with NEOs include:

  • Asteroid 2015 TB145, the “Halloween Pumpkin”
    • Roughly spherical, about 610 meters (2,000 feet) in diameter
    • Detected 10 October 2015, approaching from the outer solar system, 21 days before closest approach
    • Closest approach occurred on 31 October 2015 at a distance of 310,000 miles (1.3 times the distance to the Moon) at a speed of about 78,000 miles an hour.
  • Asteroid airburst near Chelyabinsk, Russia
    • Airburst occurred 15 February 2013
    • Object estimated to be about 19 meters in diameter
    • Approached from the inner solar system; not detected before airburst
    • Peter Brown at the University of Western Ontario, estimated the energy of the Chelyabinsk airbust at 400 to 600 kilotons of TNT.  You can read this analysis in at the following link:

http://www.nature.com/articles/nature12741.epdf?referrer_access_token=OvLha95ujqCh0k4maNPuFNRgN0jAjWel9jnR3ZoTv0PyqszVJsMboh07BaZDfmONEget5lbJtDTXTwE2VvrDWIEgk5iXkd1EFvngsntJFeC1wOg4ASyku1lPPrkWlAPvoRMkxnjovQe0UYqFmFkZ6v9qqq9DL9_3CwYPmTWA6e-sweRQPIyrDHMUaAQYWA9H4TNSsZGN662UcGxlW5d1GA%3D%3D&tracking_referrer=www.theguardian.com

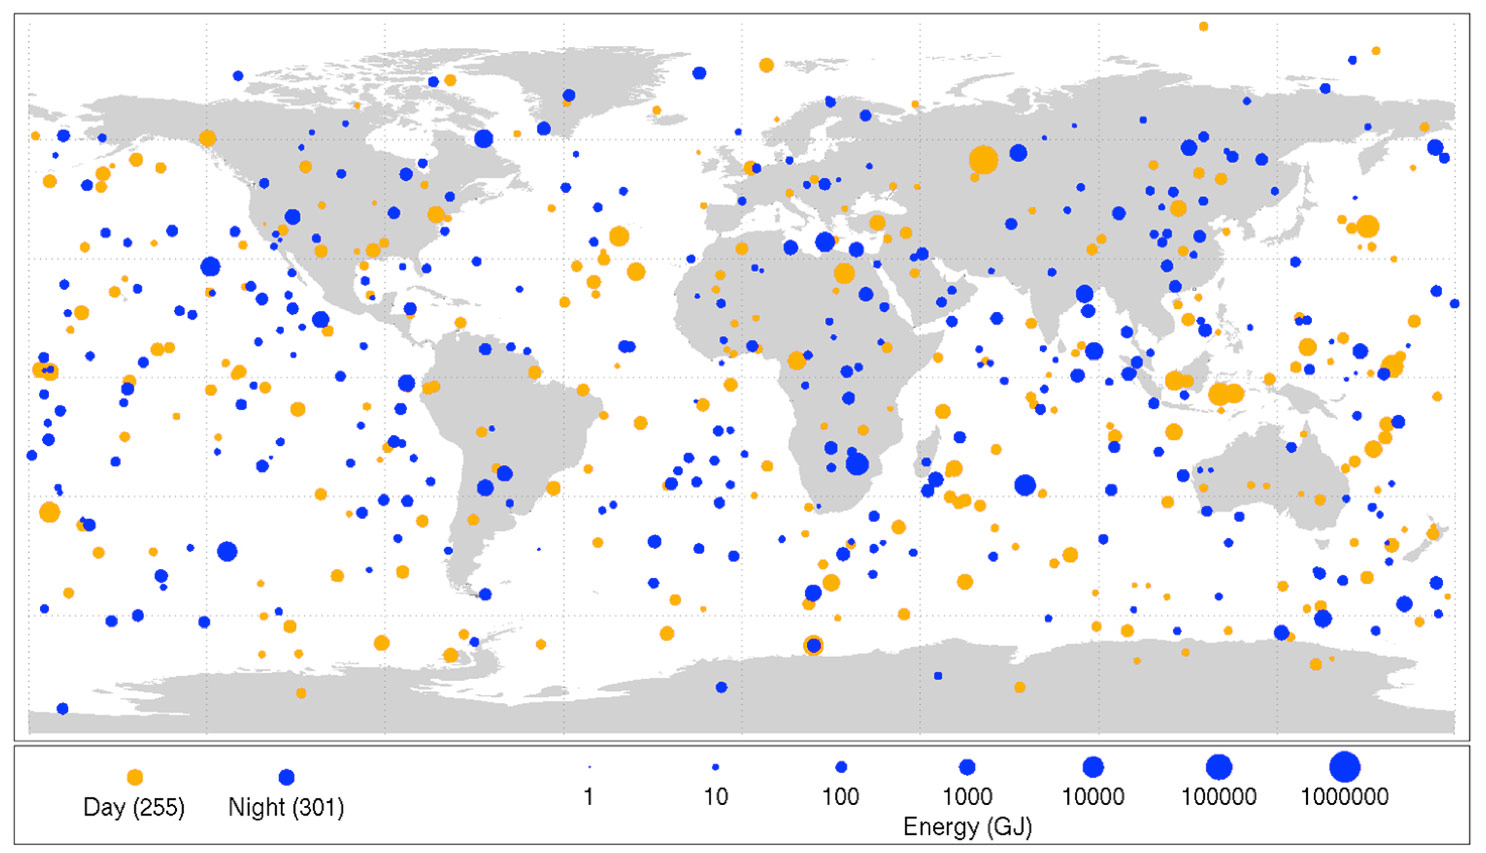
Another result of the NEO Observation Program is the following map of data gathered from 1994-2013 on small asteroids impacting Earth’s atmosphere and disintegrating to create very bright meteors, technically called “bolides” and commonly referred to as “fireballs”.  Sizes of orange dots (daytime impacts) and blue dots (nighttime impacts) are proportional to the optical radiated energy of impacts measured in billions of Joules (GJ) of energy, and show the location of impacts from objects about 1 meter (3 feet) to almost 20 meters (60 feet) in size.  You can see a rather uniform distribution of these fireballs over the surface of the Earth.

bolide_events_1994-2013 
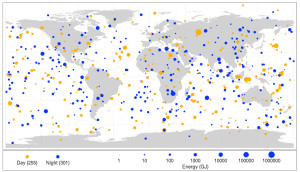
Source: NASA NEO Observation Program

In September 2014, the NASA Inspector General published the report, “NASA’s Efforts to Identify Near-Earth Objects and Mitigate Hazards,” which you can download for free at the following link:

https://oig.nasa.gov/audits/reports/FY14/IG-14-030.pdf

Key findings were the following:

  • Even though the Program has discovered, categorized, and plotted the orbits of more than 11,000 NEOs since 1998, NASA will fall short of meeting the 2005 Authorization Act goal of finding 90 percent of NEOs larger than 140 meters (459 feet) in diameter by 2020.
  • ….we believe the Program would be more efficient, effective, and transparent were it organized and managed in accordance with standard NASA research program requirements

You will find an NEO Program update, including a reference to the new Planetary Defense Coordination Office, presented by Lindley Johnson on 8 November 2915 at the following link:

http://www.minorplanetcenter.net/IAWN/2015_national_harbor/NEO_Program_update.pdf

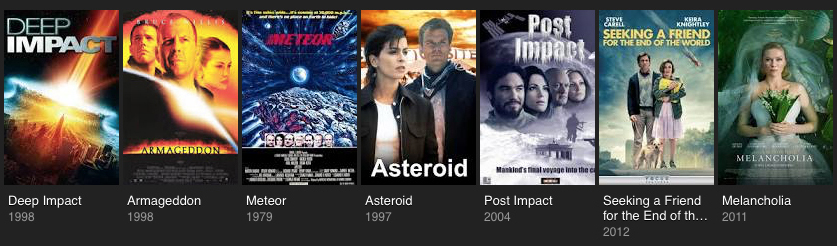
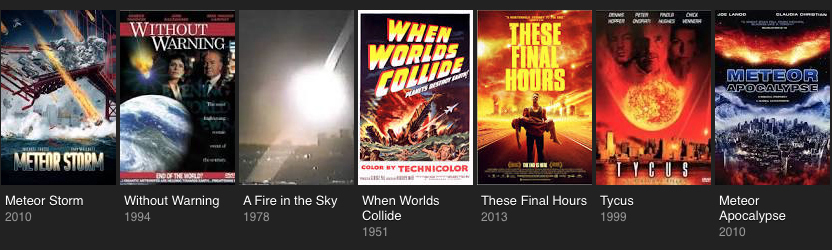
So, what will we see in the years ahead as technology is explored and techniques are developed to defend Earth against a significant NEO impact? There have been many movies that have tried to answer that question, but none offered a particularly good answer.

Asteroid movies 2Asteroid movies 1 Source: Google

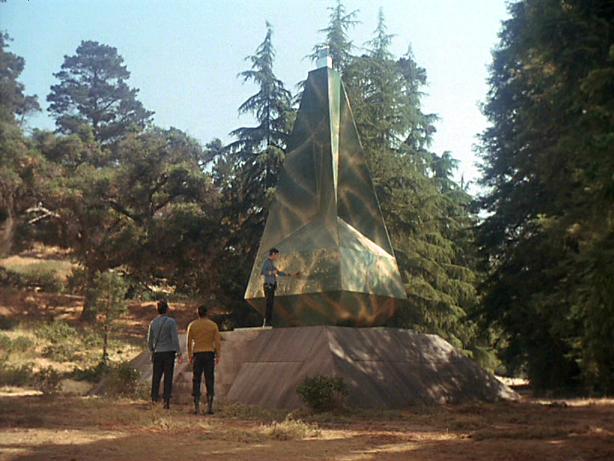
In 1968, Star Trek explored this issue in Season 3, Episode 3, “The Paradise Syndrome”. Ancient aliens had left a planetary defense device to protect a primitive civilization against their equivalent of NEOs. Only the intervention of Capt. James T. Kirk restored the device to operation in time to deflect an incoming asteroid and save the indigenous civilization.

Star Trek - The Paradise Syndrome 1 Source: memory-alpha.wiki.comStar Trek - The Paradise Syndrome 2 
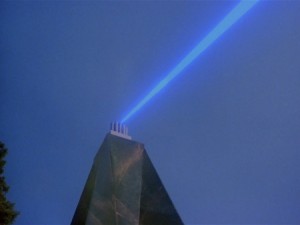
Source: technovelgy.com

Our new Planetary Defense Officer has a comparable responsibility on Earth, but without the benefits of special effects.

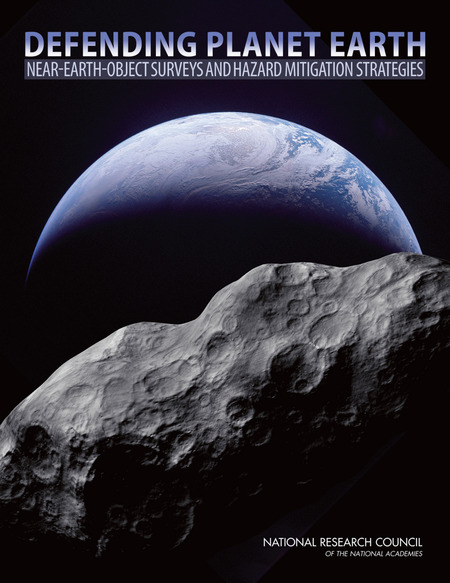
In 2010, National Academies Press published, “Defending Planet Earth: Near-Earth Object Surveys and Hazard Mitigation Strategies.” This report explores civil defense mitigation action and three basic defense techniques:

  • Slow push-pull methods
  • Kinetic impact methods
  • Nuclear methods

If you have a MyNAP account, you can download this report for free at the following link:

http://www.nap.edu/catalog/12842/defending-planet-earth-near-earth-object-surveys-and-hazard-mitigation

NAP Defending Planet Earth Source: NAP

A Brief History of Fireworks

Peter Lobner

There is a good history of fireworks by Joe Carmichael posted on the INVERSE website at the following link:

https://www.inverse.com/article/9731-fireworks-a-brief-history-of-things-exploding-attractively

Here, you can scroll through an illustrated timeline (see screenshot, below) from the advent of bamboo firecrackers in 200 BCE to modern day fireworks.

Tiimeline of fireworks  Source: INVERSE

Of local interest, the timeline includes the July 4th 2012 San Diego Big Bay Boom (aka Big Bay Bust), when a technical malfunction caused all fireworks on multiple barges in the bay to be fired prematurely in a spectacular 30 second pyrotechnic display.

San Diego 2012 Big Bay Bust  Source: YouTube

In case you missed the actual event, you can see a (short) video at the following link:

http://www.nydailynews.com/news/national/san-diego-fireworks-big-bay-boom-ruined-video-article-1.1108259

My personal favorite is the Sydney, Australia New Year’s fireworks display, which begins with what looks like an explosive demolition of the Harbor Bridge and then continues with the spectacular main event seen in the photos below.

2016 New-Years-Eve-Sydney-Fireworks2016 sydney-fireworks-ceremonySource: http://www.inewyearsevequotes.com/happy-new-years-eve-sydney-fireworks-2016/

You can see a short video of the start of Sydney’s 2016 New Year’s fireworks at the following link:

http://www.theguardian.com/world/video/2015/dec/31/sydney-harbour-new-year-fireworks-2016-video

First Ever 3D Printed Object Made From Asteroid / Meteorite Metals

Peter Lobner

In a 31 December 2015 post, I discussed the “U.S. Commercial Space Launch Competitiveness Act,” which was signed into law on 25 November 2015 and established, among other things, the legal basis for asteroid mining. I also identified the firm Planetary Resources (http://www.planetaryresources.com/ – home-intro) as one of the firms having a business interest in asteroid prospecting.

Today, at the Consumer Electronics Show (CES) today in Las Vegas, Planetary Resources announced that they, in collaboration with their partner firm, 3D Systems (http://www.3dsystems.com), have produced the first ever direct metal print of an object using metals recovered from an asteroid (or meteorite) that impacted Earth.

PlanetaryResources_3DSystems_Meteorite2_LOW-680x355 Source: Planetary Resources

In the Planetary Resources announcement, they stated that the material used for 3D printing:

  • “…was sourced from the Campo Del Cielo impact near Argentina, and is composed of iron, nickel and cobalt – similar materials to refinery grade steel.”
  • “ …was pulverized, powdered and (then) processed on the new 3D Systems ProX DMP 320 metals 3D printer.”

You can read the announcement at the following link:

http://www.planetaryresources.com/2016/01/planetary-resources-and-3d-systems-reveal-first-ever-3d-printed-object-from-asteroid-metals/

You can read more about the ProX DMP 320 3D printer at the following link:

http://www.3dsystems.com/3d-printers/production/prox-dmp-320

The milestone announced today demonstrates a key capability needed for building research bases and commercial facilities in space using raw materials found on another body in our solar system.

Imagine what the cargo manifest will be on future space missions to destinations that have useful natural resources that can be mined and prepared on site for use in various 3D printing (additive manufacturing) activities. The early missions will need to carry pre-fabricated structures for an initial base, tools for initial mining and manufacturing work, other items manufactured on Earth, and consumables. Once the on-site mining and manufacturing facilities reach an initial operating capability, the extended supply chain from Earth can be reduced commensurate with the capabilities of the local supply chain.

For more background information on this subject, National Academies Press published the  report, “3D Printing in Space”, which you can download for free at the following link if you have set up a MyNAP account:

http://www.nap.edu/catalog/18871/3d-printing-in-space

18871-0309310083-450  Source:  NAP

Opportunities for 3D printing in space addressed in this NAP report include: manufacturing new or replacement parts needed on a space vehicle or off-Earth facility; creating structures that are difficult to produce on, or transport from, Earth; creating a fully-printed spacecraft; using resources available on planetary surfaces; recycling materials in space; and establishing a free-flying fabrication facility.  The report also includes roadmaps for NASA and the U.S. Air Force deployment of 3D printing capabilities in space.

This is just the start. Manufacturing in space using locally sourced materials will revolutionize our approach for building a permanent human presence off the planet Earth.

Just What are Those U.S. Scientists Doing in the Antarctic and the Southern Ocean?

Peter Lobner

The National Academies Press (NAP) recently published the report, “A Strategic Vision for NSF Investments in Antarctic and Southern Ocean Research”, which you can download for free at the following link if you have established a MyNAP account:

http://www.nap.edu/catalog/21741/a-strategic-vision-for-nsf-investments-in-antarctic-and-southern-ocean-research

Print Source: NAP

NSF states that research on the Southern Ocean and the Antarctic ice sheets is becoming increasingly urgent not only for understanding the future of the region but also its interconnections with and impacts on many other parts of the globe. The research priorities for the next decade, as recommended by the Committee on the Development of a Strategic Vision for the U.S. Antarctic Program; Polar Research Board; Division on Earth and Life Studies; National Academies of Sciences, Engineering, and Medicine, are summarized below:

  • Core Program: Investigator-driven basic research across a broad range of disciplines
    • NSF gives the following rationale: “…it is impossible to predict where the next major breakthroughs or advances will happen. Thus to ensure that the nation is well positioned to take advantage of such breakthroughs, it is important to be engaged in all core areas of scientific research.”
      • NSF notes, “…discoveries are often made by single or small groups of PIs thinking outside the box, or with a crazy new idea, or even just making the first observations from a new place.”
    • Examples of basic research that have led to important findings include:
      • Ross Sea food chain is affected by a high abundance of predator species (whales, penguins and toothfish) all competing for the same limited resource: krill. Decline or recovery of one predator population can be seen in an inverse effect on the other predator populations.  This food chain response is not seen in other areas of the Antarctic ice shelf where predator populations are lower, allowing a larger krill population that adequately supports all predators.
      • Basic research into “curious” very-low frequency (VLF) radio emissions produced by lightning discharges led to a larger program (with a 21.2-km-long VLF antenna) and ultimately to a better understanding of the behavior of plasma in the magnetosphere.
  • Strategic, Large Research Initiatives –  selection criteria:
    • Primary filter: compelling science – research that has the potential for important, transformative steps forward in understanding and discovery
    • Subsequent filters: potential for societal impact; time-sensitive in nature; readiness / feasibility; and key area for U.S. and NSF leadership.
    • Additional factors: partnership potential; impact on program balance; potential to help bridge existing disciplinary divides
  • Strategic, Large Research Initiative – recommendations::
    • Priority I: The Changing Antarctic Ice Sheets Initiative to determine how fast and by how much will sea level rise?
      • A multidisciplinary initiative to understand why the Antarctic ice sheets is changing now and how they will change in the future.
      • Will use multiple records of past ice sheet change to understand rates and processes.
    • Priority II: How do Antarctic biota evolve and adapt to the changing environment?
      • Decoding the genomic (DNA) and transcriptomic (messenger RNA molecules) bases of biological adaptation and response across Antarctic organisms and ecosystems.
    • Priority III: How did the universe begin and what are the underlying physical laws that govern its evolution and ultimate fate?
      • A next-generation cosmic microwave background (CBM) program that builds on the current successful CMB program using telescopes at the South Pole and the high Atacama Plateau in Chile and possibly will add a new site in the Northern Hemisphere to allow observations of the full sky

You will find detailed descriptions of the Priority I to III strategic programs in the Strategic Vision report.

Heritage Foundation’s 2016 Index of U.S. Military Strength

Peter Lobner

Heritage Foundation recently released the subject report, which assesses the current ability of the U.S. military to provide for the common defense. Heritage Foundation notes: “This …. Index of U.S. Military Strength gauges the ability of the U.S. military to perform its missions in today’s world, and each sub­sequent edition will provide the basis for measuring the improvement or weakening of that ability.”

Heritage Foundation 2016 index cover  Source: Heritage Foundation

The report, edited by Dakota L. Wood, is organized as follows:

  • Introduction.
  • Executive Summary
  • The Role of a Strong National Defense
  • The Contemporary Spectrum of Conflict: Protracted, Gray Zone, Ambiguous, and Hybrid Modes of War
  • Preempting Further Russian Aggression Against Europe
  • Intelligence and National Defense
  • America’s Reserve and National Guard Components: Key Contributors to U.S. Military Strength
  • Assessing the Global Operating Environment
  • Assessing Threats to U.S. Vital Interests
  • An Assessment of U.S. Military Power
  • Glossary of Terms and Abbreviations
  • Methodology
  • Appendix: Military Capabilities and Corresponding Modernization Programs

The Heritage Foundation notes that the, “2016 Index of U.S. Mil­itary Strength concludes that America’s ‘hard power’ has deteriorated still further over the past year, pri­marily as a result of inadequate funding that has led to a shrinking force that possesses aging equipment and modest levels of readiness for combat.”

You can download the complete report, or just individual sections or chapters, at the following link:

http://index.heritage.org/military/2016/resources/download/

I hope you will read this report and draw your own conclusions.

Legal Basis Established for U.S. Commercial Space Launch Industry Self-regulation and Commercial Asteroid Mining

Peter Lobner

On 25 November 2015, the “U.S. Commercial Space Launch Competitiveness Act” was signed into law, and fundamentally changed the commercial U.S. space industry. The law consists of four parts:

  • Title I: “Spurring Private Aerospace Competitiveness and Entrepreneurship Act of 2015,” or, “SPACE Act of 2015”
    • Limits regulation of the commercial space launch industry for the next decade.
    • Rather than increasing government regulations now, the U.S. commercial space transportation industry is charged with developing, “voluntary consensus standards or any other construction that promotes best practices.”
    • Beginning on December 31, 2025, DOT may propose new regulations
  • Title II addresses DOT’s authority to license private sector parties to operate private remote sensing space systems.
  • Title III renames the Office of Space Commercialization as the Office of Space Commerce and specifies the roles of this office.
  • Title IV: “Space Resource Exploration and Utilization Act of 2015,” specifies:
    • “Any asteroid resources obtained in outer space are the property of the entity that obtained them, which shall be entitled to all property rights to them, consistent with applicable federal law and existing international obligations.”
    • “A U.S. commercial space resource utilization entity:
      • Shall avoid causing harmful interference in outer space, and
      • May bring a civil action in a U.S. district court for any action by another entity subject to U.S. jurisdiction causing harmful interference to its operations with respect to an asteroid resource utilization activity in outer space.”
    • This Act includes a “Disclaimer of Extraterritorial Sovereignty”
      • While commercial rights are specified in the Act, the U.S. “does not thereby assert sovereignty or sovereign or exclusive rights or jurisdiction over, or the ownership of, any celestial body.”

You can read a summary and the entire Act at the following link:

https://www.congress.gov/bill/114th-congress/house-bill/2262

To get a perspective on potential opportunities for asteroid mining, check out Asterank, which is a database on over 600,000 asteroids at the following link:

http://www.asterank.com

Many are “near-Earth” asteroids, with orbits that approach or cross Earth’s orbit.

Asterank screenshotSource: Asterank

Asterank includes important data such as asteroid mass, composition, and estimates of the costs and rewards of mining specific asteroids. Asterank was created and is maintained by Ian Webster. The firm Planetary Resources acquired Asterank in May 2013.

Once you’ve determined your target asteroid, you can plan to fetch it with the help of the 2012 “Asteroid Retrieval Feasibility Study” by the Keck Institute for Space Studies, which you can download from the following link:

http://www.kiss.caltech.edu/study/asteroid/asteroid_final_report.pdf

Planetary Resources’ business focus is on Earth observation and asteroid prospecting. You can read about the technologies they currently are developing to support asteroid prospecting at the following link:

http://www.planetaryresources.com/asteroids/#asteroids-intro

As noted by Planetary Resources, “near-Earth asteroids are the “low hanging fruit of the Solar System.” Their website identified eight candidate targets of interest.

With the reduced regulatory risk offered by the U.S. Commercial Space Launch Competitiveness Act, investors are certain to take a more favorable view toward making long-term investments in commercial launch vehicles and asteroid mining technologies. It will be years before commercial asteroid prospecting missions become a reality and much longer before the real economics of asteroid mining are known. Asteroid mining will require very large, long-term investments, but this isn’t science fiction any more.

The Story Behind the Apollo 8 Earthrise Photo

Peter Lobner

You’ve all seen the iconic, first-ever photo of Earthrise as seen from lunar orbit.

NASA Earthrise Source: NASA

This photo was taken during the first lunar orbital mission, Apollo 8, on 24 December 1968 by astronaut Bill Anders, with help from the other Apollo 8 crew members, Frank Borman and Jim Lovell.

NASA Goddard Spaceflight Center has reconstructed the events surrounding that historic photo using detailed lunar maps prepared from current Lunar Reconnaissance Orbiter (LRO) data, along with the photos taken by the Apollo 8 astronauts, data on the orientation and maneuvers of the Apollo 8 spacecraft, and the actual recorded conversations among the astronauts.

I think you will enjoy NASA Goddard’s 7-minute video reconstruction, which you can view at the following link:

https://www.youtube.com/embed/dE-vOscpiNc

Now, 47 years later, that photo is no less inspirational than it was the day it was first published. Thank you, Apollo 8, for a enduring Christmas present.

100th Meeting of the Lyncean Group

Peter Lobner

Congratulations to the Lyncean Group founders who had the vision in November 2002 to create the Group as a forum for retired and semi-retired technical professionals to meet regularly to discuss subjects associated with science and technology, to learn from one another, to share thoughts and ideas, and to enjoy their mutual interest in science, technology and related fields.

Coin Front         Coin Back

Bill Hagan reported that Lyncean Group membership now stands at 122, and this week’s meeting was the 100th meeting of the Lyncean Group. To commemorate this milestone, Dr. Lorenz (Larry) Kull was recognized as the chief instigator behind the formation of the Lyncean Group. Larry was presented with a Lyncean clock made by Bill Hagan’s Dad.

Larry Kull 100th meeting

Larry noted that it really was the founder’s wives who were the driving force for forming the Lyncean Group because it would give the founders a reason to get out of the house more often.

Starting with meeting #2 in February 2003, each meeting has included a presentation by a Lyncean Group member or an invited guest speaker. You can access the list of past meetings from the Lyncean Group home page or directly from the following link:

https://lynceans.org/pastmeetings/

In most cases, the list of past meetings includes links to the presentation material also available on the Lyncean Group website. For the 100th meeting, guest speaker, Dr. Hosseni Eslambolchi, made an outstanding presentation on, “The Power of Technology to Transform the Future.”

Top 10 tech trends crop

Dr. Eslambolchi’s presentation slides have been posted on the Lyncean Group website and are available to view or download.

Future meetings already are scheduled well into 2016. Our next meeting will be on 27 January 2016. To see the list of planned speakers and topics, you can access the schedule from the Lyncean Group home page or directly from the following link:

https://lynceans.org/upcoming/

As of today, there are 100 posts on the Lyncean technical blog site, Pete’s Lynx; the last being, “100th Anniversary of Einstein’s General Theory of Relativity and the Advent of a New Generation of Gravity Wave Detectors.” You can access the blog site from the Lyncean Group home page or directly from the following link:

https://lynceans.org/petes-lynx/

If you have comments on this blog, please use the Contacts page on the Lyncean Group website to send Pete a message. The following link will take you to that page.

https://lynceans.org/contact/

Thanks to all Lyncean Group members for helping to make the Group a success through your participation in the group’s meetings. Just try to imagine the technical topics we will be addressing in the next 100 meetings. Our mutual interest in the rapidly changing technologies affecting our world should make for lively discussions and engaging meetings.

Happy holidays to all!

100th Anniversary of Einstein’s General Theory of Relativity and the Advent of a New Generation of Gravity Wave Detectors

Peter Lobner

One hundred years ago, Albert Einstein presented his General Theory of Relativity in November 1915, at the Prussian Academy of Science. Happy Anniversary, Dr. Einstein!

Today, general relativity is being tested with unprecedented accuracy with a new generation of gravity-wave “telescopes” in the U.S., Italy, Germany, and Japan. All are attempting to directly detect gravity waves, which are the long-predicted quakes in space-time arising from cataclysmic cosmic sources.

The status of four gravity-wave telescopes is summarized below.

USA: Laser Interferometer Gravitational-Wave Observatory (LIGO)

LIGO is a multi-kilometer-scale gravitational wave detector that uses laser interferometry to, hopefully, measure the minute ripples in space-time caused by passing gravitational waves. LIGO consists of two widely separated interferometers within the United States; one in Hanford, WA and the other in Livingston, LA. These facilities are operated in unison to detect gravitational waves. The Livingston and Hanford LIGO sites are shown in the following photos (Hanford above, Livingston below):

ligo-hanford-aerial-02Source LIGO Caltechligo-livingston-aerial-03Source: LIGO Caltech

LIGO is operated by Caltech and MIT and is supported by the National Academy of Sciences. For more information, visit the LIGO website at the following link:

https://ligo.caltech.edu/page/about

Basically, LIGO is similar to the traditional interferometer used in 1887 in the famous Michelson-Morley experiment (https://en.wikipedia.org/wiki/Michelson–Morley_experiment). However, the LIGO interferometer incorporates novel features to greatly increase its sensitivity. The basic arrangement of the interferometer is shown in the following diagram.

LIGO experiment setupSource: LIGO Caltech

Each leg of the interferometer has a physical length of 4 km and is a resonant Fabry-Perot cavity that uses a complex set of mirrors to extend the effective arm length by a factor of 400 to 1,600 km.

On 18 September 2015, the first official “observing run” using LIGO’s advanced detectors began. This “observing run” is planned to last three months. LIGO’s advanced detectors are already three times more sensitive than Initial LIGO was by the end of its observational lifetime in 2007. You can read about this milestone event at the following link:

https://ligo.caltech.edu/news/ligo20150918

You also can find much more information on the LIGO Scientific Collaboration (LSC) at the following link:

http://www.ligo.org

Italy: VIRGO

VIRGO is installed near Pisa, Italy, at the site of the European Gravitational Observatory (http://www.ego-gw.it/public/virgo/virgo.aspx). VIRGO is intended to directly observe gravitational waves using a Michelson interferometer with arms that are 3 km long, with resonant Fabry-Perot cavities that increase the effective arm length by a factor of 50 to 150 km. The initial version of VIRGO operated from 2007 to 2011 and the facility currently is being upgraded with a new, more sensitive detector. VIRGO is expected to return to operation in 2018.

You can find much more information on VIRGO at the following link:

http://www.virgo-gw.eu

Germany: GEO600

GEO600 is installed near Hanover, Germany. It, too, uses a Michelson interferometer with arms that are 600 meters long, with resonant Fabry-Perot cavities that double the effective arm length to 1,200 meters.

You can find much more information on the GEO600 portal at the following link:

http://www.geo600.org

Japan: KAGRA Large-scale Cryogenic Gravitational Wave Telescope

The KAGRA telescope is installed deep underground, in tunnels of Kamioka mine, as shown in the following diagram.

img_abt_lcgtSource: KAGARA

Like the other facilities described previously, KAGRA is a Michelson interferometer with resonant Fabry-Perot cavities. The physical length of each arm is of 3 km (1.9 mi). KAGRA is expected to be in operation in 2018.

You can find much more information on KAGARA at the following links:

http://www.astro.umd.edu/~miller/Compact/lcgt.pdf

and,

http://gwcenter.icrr.u-tokyo.ac.jp/en/