2015 DARPA Robotics Challenge Results

Peter Lobner

Twenty-three teams competed in the 2015 DARPA Robotics Challenge, which was held June 5-6, 2015, at Fairplex in Pomona, CA.  The winner was Team KAIST from the Republic of Korea, and its robot DRC-Hubo.

drc-hubo-standing-rolling-1433820657680 Source: DARPA

An assessment of how DRC-Hubo won the 2015 DARPA Robotics Challenge appears on the IEEE Spectrum website, which you can read at the following link:

http://spectrum.ieee.org/automaton/robotics/humanoids/how-kaist-drc-hubo-won-darpa-robotics-challenge

The results of the 2015 DARPA Robotics Challenge are listed in the following table:

2015 DARPA Robotics Challenge results  Source: DARPA

You can view information on all of these teams and their robots on the DARPA website at the following link:

http://www.theroboticschallenge.org/teams

Congratulations to all teams for their efforts in advancing robotics technology and special congratulations to Team KAIST for winning the 2015 DARPA Robotics Challenge.

28 July 2016 Update:  What was the outcome of DRC?

I looked for a good explanation of the outcome of the 2015 DARPA Robotics Challenge and didn’t find much of an answer until I came across the 6 July 2015 article entitled, “The DARPA Robotics Challenge was a Bust,” posted on the Popular Science website at the following link:

http://www.popsci.com/darpa-robotics-challenge-was-bust-why-darpa-needs-try-again

The author, Erik Sofge, noted that, in 2012, DARPA originally proposed the following tasks for the DRC:

  1. Get into a standard human vehicle and drive it to a specified location.
  2. Get out of the vehicle and travel across rubble.
  3. Clear obstacles from a doorway.
  4. Open the door, and enter the building.
  5. Find a leaking pipe and close the associated valve.
  6. Reconnect a hose or cable.
  7. Climb a ladder.
  8. Grab a tool from the site, break through a concrete wall and exit.

At the 2013 DRC Trials in Miami, poor robot performance indicated the need to redefine most of these tasks. For the DRC Finals, all but one of the eight tasks had been greatly simplified. In his article, Eric Sofge provides a task-by-task breakdown of the DRC Finals, which I think you will find quite revealing.

Eric Sofge suggests a logical follow-on to DRC, which would be another competition with the following attributes:

  • Robots are required to demonstrate that they can fall, recover on their own, and demonstrate durability.
  • New tasks, including tasks closer in complexity to the originally proposed DRC tasks, should significantly raise the bar for expected robot performance.

It’s interesting to note that the NASA / JPL robot Valkyrie, which earned zero points in the 2013 DRC Trials, did not compete in the 2015 DRC Finals. However, Valkyrie was present at the DRC Finals to promote the new NASA Space Robotics Challenge (SRC). Valkyrie (aka R5) and another NASA robot, Robonaut 2, are being groomed to support space exploration. See my 6 July 2016 post for more information on the NASA SRC.

Solar Impulse 2 Completes Record Solo, Non-Stop, Solar-Powered Flight from Nagoya, Japan to Oahu, Hawaii

Peter Lobner

After a 118 hour solo, non-stop, solar-powered flight from Nagoya, Japan, pilot Andre Borschberg landed the Solar Impulse 2 aircraft at Kalaeloa, a small airport outside Honolulu, Hawaii.  During this flight,  Borschberg broke the world records for longest distance and duration for solar aviation, and the world record for the longest solo flight ever.  Solar Impulse 2 remained airborne for 5 consecutive days and nights, producing its own power with solar energy.

2015_07_03_Solar_Impulse_2_RTW_7th_Flight_Nagoya_to_Hawaii_landing_revillard_05706-7

Photo source: Solarimpulse.com

Key parameters of this remarkable, record-breaking flight is listed below:

Time of departure: 26 June 2015 18:03 UTC
Time of arrival: 3 July 2015 15:55 UTC
Flight time: 4 Days, 21 Hours, 52 Minutes
Distance: 7,212 km (4,481 miles)
Maximum altitude: 8,634 m (28,326 ft)
Average ground speed: 61.19 km/h (38.03 mph)

Each day (solar cycle), Solar Impulse 2 was flown on a trajectory that entailed: (1) using solar power during the day to run the engines, gain altitude, and charge the batteries, and then (2) using batteries to run the engines while gradually gliding down to lower altitudes at night.

This flight was Leg 8 of a planned around-the-world solar-powered journey that began in Abu Dhabi. The preceding seven legs are listed below:

The next planned legs are:

  •  Leg 9: Hawaii to Phoenix, AZ
  • Leg 10: Phoenix to mid-USA
  • Leg 11: mid-USA to New York
  • Leg 12: New York to Europe
  • Leg 13: Europe to Abu Dhabi

Refer to my 10 March 2015 post for a quick look at the Solar Impulse 2 aircraft and a link to more design details on the Solar Impulse website. Visit the website below for a detailed look at this remarkable effort, including an index to the website.

http://www.solarimpulse.com/multimedia-leg-12

I hope you will follow the remainder of the Solar Impulse team’s efforts to complete this pioneering journey around the world on solar power.

EPA Clean Power Plan Proposed Rule Does Not Adequately Recognize the Role of Nuclear Power in Greenhouse Gas Reduction

Peter Lobner

On June 2, 2014, the U.S. Environmental Protection Agency (EPA) proposed what they called, “a common sense plan to cut carbon pollution from power plants.”  You can access the Clean Power Plan Proposed Rule and many related documents at the following EPA link:

http://www2.epa.gov/carbon-pollution-standards/clean-power-plan-proposed-rule

This Plan proposes to limit carbon emissions from existing fossil fuel fired electric generating units, including steam generating, integrated gasification combined cycle, or stationary combustion turbines (in either simple-cycle or combined-cycle configuration) operating or under construction by January 8, 2014. Main points of the Clean Power Plan include:

  • Wind and solar power are the preferred EPA options.
  • Natural gas is an interim solution.
  • New nuclear capacity is not a compliance option.
  • The EPA allows compliance credit for:
    • New nuclear plants currently under construction, and
    • Preservation of existing nuclear plants that might otherwise be retired

I’ve already formed my opinion on the Clean Power Plan. To help you form your opinion, I recommend that you refer to the following recent analyses by four respected government and industry organizations that have reviewed the Clean Power Plan.

Institute for Energy Research (IER)

On 15 June 2015, the IER issued the results of their analysis entitled, EPA’s Clean Power Plan Ignores New Nuclear as a Compliance Option. IER concluded that the compliance formulae in the Clean Power Plan are biased toward new wind and solar power development. Deployment of these technologies, which currently are not capable of delivering reliable capacity, will decrease the reliability of the electric grid. IER also concluded that the Clean Power Plan will result in much higher electricity prices for all American consumers, while having only a marginal impact on global temperature based on EPA’s computer models.

You can read the IER analysis at the following link:

http://instituteforenergyresearch.org/analysis/epas-clean-power-plan-ignores-new-nuclear-as-a-compliance-option/

National Association of Clean Air Agencies (NACAA)

On 21 May 2015, the NACAA issued a report entitled, Implementing EPA’s Clean Power Plan: A Menu of Options, containing 25 chapters, each of which explores a particular approach to greenhouse gas (GHG) reduction in the electric power sector.  NACAA is a nonpartisan, nonprofit association of air pollution control agencies in 41 states, the District of Columbia, four territories and 116 metropolitan areas.  Each chapter of their Menu of Options includes a brief descriptions of: (1) the option and it’s pros and cons; (2) the regulatory backdrop, policy underpinnings, implementation experience, and GHG reduction potential associated with the option; and (3) benefits of the option to society and the utility system, including costs and cost-effectiveness. In the last chapter, a variety of emerging technologies and other policy options for reducing GHG emissions are addressed.

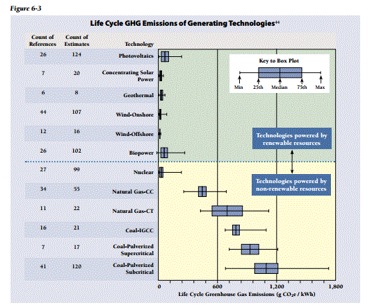
An interesting table and two figures included in Chapter 6 of the Menu of Options are reproduced below.
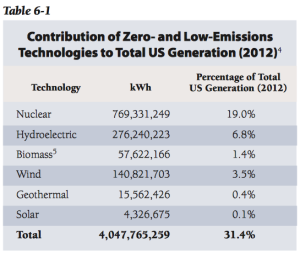
NACAA Table 6-1 Source: NACAA

In 2012, electric power generation technologies with zero or low GHG emissions accounted for 31.4% of the USA’s total generating capacity. The data in Table 6-1 shows that 82.2% of the zero or low GHG emission generating capacity came from nuclear and hydroelectric power plants. The remaining low-emission generation capacity came from biomass, wind, geothermal, and solar power plants.

NACAA Figure 6-3Source: NACAA

In Figure 6-3, “life cycle GHG emissions” include those associated with operation as well as construction, fabrication, and fuel processing.  While nuclear power is not included among the “technologies powered by renewable resources”, it’s clear in Figure 6-3 that nuclear power meets the GHG reduction performance of the other technologies using renewable resources.

NACAA Figure 6-7  Source: NACAA

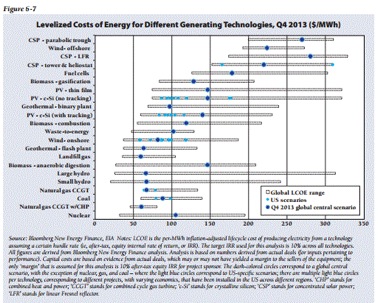
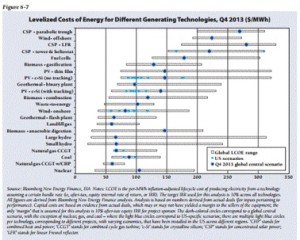
In Figure 6-7, note the relative cost-of-energy differential between nuclear power and fossil power. This difference makes it difficult for nuclear power plants to compete head-to-head with coal and natural gas merchant power plants and encourages the early retirement of some nuclear power plants on economic grounds.  While most renewable power sources have even higher costs-of-energy, various financial schemes subsidize their power generation.

You can download individual chapters or the entire NACAA Menu of Options at the following link:

http://www.4cleanair.org/NACAA_Menu_of_Options

U.S. Energy Information Administration (EIA)

On 22 May 2015, the EIA released their analysis of the Clean Power Plan. The EIA analysis supports the IER finding that the Clean Power Plan will result in much higher electricity prices for all American consumers, even in a scenario that allows GHG reduction credit for new nuclear generation.

You can read the EIA press release at the following link:

http://www.eia.gov/analysis/requests/powerplants/cleanplan/

You also can download a PDFs copy of the May 2015 EIA report, Analysis of the Impacts of the Clean Power Plan, at the following link:

http://www.eia.gov/analysis/requests/powerplants/cleanplan/pdf/powerplant.pdf

Nuclear Energy Institute’s (NEI)

To address the “clean power” attributes of nuclear power, I refer you to an NEI Knowledge Center webpage: Environment: Emissions Prevented, which you will find at the following link:

http://www.nei.org/Knowledge-Center/Nuclear-Statistics/Environment-Emissions-Prevented

Here you’ll find a link to data on the amount of sulfur dioxide, nitrogen oxides, and carbon dioxide emissions avoided in the U.S. during the years 1995 to 2014 by virtue of having about 20% of U.S. electric power generated by nuclear power plants instead of fossil power plants. NEI reports the total avoided emissions for this period as follows:

  • Sulfur dioxide: 57.75 million short tons (52.4 million metric tons)
  • Nitrogen oxides: 22.92 million short tons (20.8 million metric tons)
  • Carbon dioxide: 13,063.6 million short tons (11,851 million metric tons)

On this website, NEI states:

“Nuclear energy facilities avoided 595 million metric tons of carbon dioxide in 2014 across the U.S. This is nearly as much carbon dioxide as is released from nearly 135 million cars, which is more than all U.S. passenger cars. The U.S. produces more than five billion metric tons of carbon dioxide each year.

Without the emission avoidances from nuclear generation, required reductions in the U.S. would increase by more than 50 percent to achieve targets under the Kyoto Protocol.”

2013 paper, “Prevented Mortality and Greenhouse Gas Emissions from Historical and Projected Nuclear Power”.

Supporting the above NEI position on the GHG reduction merits of nuclear power, there is a related 2013 article by NASA scientists from Goddard Institute for Space Studies and Columbia University entitled, “Prevented Mortality and Greenhouse Gas Emissions from Historical and Projected Nuclear Power”.  You can read a short article on this paper on the Scientific American website at the following link:

http://blogs.scientificamerican.com/the-curious-wavefunction/nuclear-power-may-have-saved-1-8-million-lives-otherwise-lost-to-fossil-fuels-may-save-up-to-7-million-more/

You also can read the complete paper at the following link:

http://pubs.acs.org/doi/pdf/10.1021/es3051197

In their study, authors Pushker A. Kharecha and James E. Hansen used historical production data from 1971 to 2009 and calculated that global nuclear power has prevented an average of 1.84 million air pollution-related deaths and 64 gigatonnes of CO2-equivalent (GtCO2-eq) greenhouse gas (GHG) emissions that would have resulted from fossil fuel burning. From their analysis, the authors drew the following conclusion:

“In conclusion, it is clear that nuclear power has provided a large contribution to the reduction of global mortality and GHG emissions due to fossil fuel use. If the role of nuclear power significantly declines in the next few decades, the International Energy Agency asserts that achieving a target atmospheric GHG level of 450 ppm CO2-eq would require “heroic achievements in the deployment of emerging low- carbon technologies, which have yet to be proven. Countries that rely heavily on nuclear power would find it particularly challenging and significantly more costly to meet their targeted levels of emissions.”

So, what do you think about the EPA’s proposed Clean Power Plan? Is this the “common sense plan to cut carbon pollution from power plants” promised by EPA; a politically motivated piece of crap designed to kill the nuclear and coal power industries; or something in between?

NASA Announces New Findings on the Behaviors of Pluto and Its Five Known Moons

Peter Lobner

On 28 May 2015, NASA presented surprising information, derived from observations by the Hubble Space Telescope, on the behaviors of Pluto and it’s five known moons: Charon, Hydra, Nix, Kerberos, and Styx. Details of the study were reported in the paper, “Resonant Interactions and Chaotic Rotation of Pluto’s Small Moons,” by Douglas Hamilton and Mark Showalter, in the 3 June 2015 issue of Nature.

An artist’s conception of the relative sizes and shapes of Pluto’s known moons is shown in the following figure:

image Source: NASA

The largest moon, Charon, and Pluto form a binary system that orbits a point between the two, as shown in the following figure, in which Pluto’s orbit is shown in red and Charon’s orbit is shown in green.

image Source: NASA

As described in my 14 March 2015 post, this binary system behavior also was observed from the New Horizons spacecraft, which is approaching Pluto for a flyby on 14 July 2015.

The Pluto-Charon binary system creates an irregular, rotating, dumbbell-shaped gravitational field that acts on the other moons orbiting the binary pair, resulting in chaotic (unpredictable in the long-term) orbits of the outer moons. The behaviors of Hydra and Nix are further complicated by their non-spherical shapes and tumbling orbital flight. Nonetheless, it appears that the orbits of Hydra, Nix and Styx are synchronized with each other in a 3-body resonance.

You can read more details on the 28 May NASA briefing at the following link:

http://motherboard.vice.com/read/pluto-and-its-moons-are-weirder-than-we-thought?utm_source=howtogeek&utm_medium=email&utm_campaign=newsletter

Three Very Large New Optical Telescopes are Under Development

Peter Lobner

Giant Magellan Telescope (GMT), Las Campanas Observatory, Chile

The GMT is a new, very large optical telescope facility planned for construction at an elevation of over 2,550 m (about 8,500 ft) in the mountains of the Chilean Atacama Desert. The GMT is comprised of seven 8.4 m (27 ft) diameter monolithic, circular mirror segments arranged in a hexagonal array. GMT will have a total optical surface measuring 24.5 m (80 ft) in diameter, with an optical surface area of 368 square meters (3,860.8 square feet). The GMT is expected to have 10 times the the resolving power of the Hubble Space Telescope.

image  Source: www.gmto.org

GMT will be the largest optical telescope in the world when it sees first light in 2021. It is expected to be fully operational in 2024. For more details, including a 360 degree tour, check out the GMT website at the following link:

http://www.gmto.org/overview/

On 3 June 2015, the international consortium known as Giant Magellan Telescope Organization (GMTO), approved proceeding to the construction phase. You can read this press release at the following link:

http://www.gmto.org/2015/06/giant-magellan-telescopes-international-partners-approve-start-of-construction-phase/

European Extremely Large Telescope (E-ELT), Cerro Armazones, Chile

The E-ELT program was approved in December 2012, and groundbreaking for the new observatory occurred in January 2014 in the Chilean Atacama Desert.  When it is completed, E-ELT will be the largest optical / infrared telescope in the world.  Its 39 meter adaptive mirror, composed of about 800 hexagonal segments, will be able to adjust the alignment of individual mirror segments a thousand times a second.

EELTSource: eelt.orgEELT2Source: eelt.org

Detailed information on EELT is available on the European Southern Observatory (ESO) and E-ELT websites at the following links:

https://www.eso.org/sci/facilities/eelt/

and

http://www.eelt.org.uk

Thirty Meter Telescope (TMT), Mauna Kea, Hawaii, USA

The TMT is a new, very large optical telescope facility planned for construction on Mauna Kea, at an elevation above 3,960 m (about 13,000 ft). The TMT will be a wide-field telescope with a 492 segment, 30 meter (98.4 ft) diameter primary mirror, a fully-active secondary mirror and an articulated tertiary mirror. The telescope is designed for flexibility in the choice of adaptive optics (AO) systems and science instruments that can be used for specific observations. TMT will have a light-collecting area of 664.2 square meters (7,148.7 square feet), almost 10 times more than one of the 10 m (32.8 ft) diameter Keck telescopes (also on Mauna Kea), with diffraction-limited spatial resolution that exceeds Keck by a factor of 3. Relative to the Hubble Space Telescope, TMT will have more than a factor of 10 better spatial resolution at near-infrared and longer wavelengths. When completed, the TMT will take over the title of the world’s largest optical telescope from the GMT.

The general arrangement of the TMT, including the segmented primary mirror, is shown in the following diagram.

imageSource: UH, TMT.org

For more details on the TMT, visit the University of Hawaii’s website at the following link:

http://www.tmt.org

Particularly interesting is the Detailed Science Case: 2015 for the TMT, which you can find at the following link:

http://www.tmt.org/sites/default/files/TMT-DSC-2015-release-2015Apr29-s.pdf

The future of the TMT and other observatories on Mauna Kea is being discussed now by University of Hawaii, the Hawaii Governor’s office and native Hawaiian groups that have been protesting the presence of observatories on the mountain. On 1 June 2015, University of Hawaii issued a press release announcing it’s Implementation Plan for Improved Stewardship of Mauna Kea, with a commitment to provide additional details in July 2015. You can read this Plan at the following link:

http://www.tmt.org/news-center/uh-implementation-plan-improved-stewardship-maunakea

I hope that there is a place for the TMT on Mauna Kea.

16 October 2016 Updates:  TMT siting still not confirmed

New hearings on the future siting of TMT on Mauna Kea begin in Hawaii on 18 October 2016.  As a hedge against failing to gain approval in Hawaii, the TMT partners are considering alternate sites, including sites originally considered in the mid-2000s when TMT site selection started. An alternate site in the northern hemisphere is preferred because the two other giant optical / infrared telescopes, the GMT and E-ELT, already are under construction in the southern hemisphere.  Candidate sites in the northern hemisphere include:  San Pedro Martir in Baja California, Mexico and Roque de los Muchachos on the Spanish island of La Palma off the Atlantic coast of Morocco.

Spearhead-class Joint High-speed Vessel (JHSV) Provides the Navy with an Express Delivery Service

Peter Lobner

Updated 4 September 2015 and 16 February 2016

Along San Diego Bay, you’ll see a great variety of military and civilian vessels. The San Diego Port District has posted a chart on Shelter Island to help tourists and locals identify the more common types of Navy ships that are based here. Occasionally, you might be treated to the sight of an uncommon vessel, such as the catamaran USNS Minninocket (JHSV-3), shown below. This ship is owned and operated for the Navy by the Military Sealift Command.

JHSV-3 pic 1 Source: Author photo

JHSV-3 pic 2 Source: Author photo

JHSV ships are fast, modest-sized, non-combatant vessels designed to transport about 600 tons troops and equipment. Their modular design enables rapid reconfiguration of the 20,000-ft2 cargo bay to support various missions. For example, a JHSV vessel can accommodate an Army or Marine Corps company-sized unit (typically 80 – 250 troops) and vehicles, or be reconfigured to transport up to 312 troops.

The vessel has a length of 338′ (103 m), a beam of 93’ 6” (28.5 m), and a draft of 12’ 7” (3.83 m), and a displacement of about 2,400 tons. The catamaran design of the hull and the location of the large cargo deck are evident in the following pictures:

JHSV hull Source: U.S. Navy

JHSV multi view Source: U.S. Navy

Ship propulsion is provided by four 12,200 hp (9.1 MW) diesel engines in the catamaran pods driving waterjets that deliver a maximum speed of about 43 kts. Range is about 1,200 miles at 35 kts. The ship has facilities for one helicopter. As of the FY 2015 budget, 11 JHSVs have been funded.

You can read a summary of this Navy ship program, including the status of resolving FY 2013 and FY 2014 recommendations for improvement and new FY 2015 recommendations, at the following link:

http://www.dote.osd.mil/pub/reports/FY2015/pdf/navy/2015jhsv.pdf

You can watch a short video on this intriguing vessel at the following link:

https://www.youtube.com/watch?v=aWRNIXNGGjA

In 2016, the Navy plans to conduct shipboard tests of the BAE Systems prototype electromagnetic railgun aboard USNS Trenton (JHSV-5), including live firing GPS-guided hyper-velocity projectiles (HVP) at targets 20 miles or more away. While the JHSV is a non-combatant, it was chosen for this test program because of the availability of adequate space in the cargo hold and topside for the prototype weapon system. An artist rendering of the planned railgun installation is shown below.

JHSV railgun Source: U.S. Navy

4 September 2015 update:  Joint High-speed Vessel (JHSV) redesigned Expeditionary Fast Transport (EPF) 

Now there’s a new root designator for U.S. Navy vessels: “E” for “expeditionary support.”

Navy Secretary Ray Mabus and  Adm. Jon Greenert, Chief of Naval Operations,  changed the designations of three kinds of ships to the new expeditionary support category.  The JHSV joint high-speed vessels will become EPF, for expeditionary fast transport.

16 Feb 2016 Update: EPFs require structural upgrades to cope with heavy seas; operational suitability in question

The Navy has contracted for 10 of the shallow-draft Expeditionary Fast Transports (EPFs) from Austal USA, which constructs these ships at its Mobile, AL shipyard. Five EPFs have been delivered and have made deployments to Africa, the Middle East and the Far East. The 6th ship, USNS Brunswick, was just delivered to the Navy on 14 January 2016. Four more ships (EPF-7 to EPF-10) remain to be delivered under the current contract. EPF-11 and -12 have been funded by Congress in the 2015 and 2016 omnibus appropriations bills, but contracts with the Navy remain to be finalized.

Operating as part of the U.S. Navy’s Military Sealift Command, EPFs are intended primarily for use in littoral waters. However, they are expected to be able to make fast open ocean transits and operate with other Navy units in the open ocean.

The lead ship, USNS Spearhead, was damaged in moderate seas while transiting the Atlantic en route to Europe in September 2014. The ship took a significant pounding from wave slamming onto the “forepeak”, which is the bottom of the foremost part of the flat hull section spanning the two catamaran hulls. Repairs to the ship cost about $511,000. The repairs included structural reinforcement of the bow, which added 1,736 pounds to the ship’s weight and displaced about 250 gallons of fuel.

EPF forepeak Source:  U.S. Navy

On 22 September 2015, Michael Gilmore, Director, Operational Test and Evaluation, issued the following report to the Secretary of Defense: Follow-on Operational Test and Evaluation (FOT&E) Report on the Joint High Speed Vessel (JHSV).”

Key points in this report related to the weak bow are:

  • There is a serious problem with the bow structure related to the ship’s Safe Operating Envelope (SOE), which is designed to limit wave impact loads on the bow structure.
    • The Navy accepted compromises in the bow structure during construction of these ships.
    • Multiple ships of the class have suffered damage to the bow structure, and repairs/reinforcements are in progress class-wide.
  • Operating the ship outside of the SOE or encountering a rogue wave that is outside of the current sea state limits can result in sea slam events that cause structural damage to the bow structure of the ship.
  • The SOE operational restrictions are major limitation that must be accounted for in all missions assigned to these ships. The following limits apply:
    • At Sea State 3 or less (significant wave height up to 1.25 meters), the ship may operate up to its maximum speed
    • At Sea State 4 (significant wave height up to 2.5 meters) the ship must slow to 15 knots.
    • At Sea State 5 (significant wave height up to 4 meters) the ship must slow to 5 knots.
    • Above Sea State 5, the ship can only hold position and await calmer seas.
  • The Navy has spent almost $2.4 million strengthening the bows of the first four vessels delivered since late 2012.
    • The 5th operating ship, the USNS Trenton, will be modified during its next planned shipyard visit.
    • Later EPFs will be modified during construction, before delivery to the Navy.
  • There has been no heavy weather testing yet to verify if the fixes are sufficient.

In addition to the bow structural problems, Michael Gilmore’s report noted that the EPFs have the following significant problems:

  • The EPF cannot effectively inter-operate with a Mobile Landing Platform in the open ocean.
  • Unplanned limitations exist on launching a SEAL Delivery Vehicle (SDV) and associated support boats in the open ocean
  • Operational availability is limited primarily by the poor reliability of the Ship Service Diesel Generators, waterjets, and the Ride Control System (RCS).

You can download Michael Gilmore’s complete report at the following link:

http://news.usni.org/wp-content/uploads/2015/10/9-22-15-Follow-On-Operational-Test-and-Evaluation-FOTE-Report-on-the-….pdf

Short summary articles on these matters are available at the following links to Bloomberg Business and Seapower:

http://www.bloomberg.com/news/articles/2016-01-14/navy-s-fast-sealift-ships-can-t-stand-buffeting-from-high-seas

and

http://www.seapowermagazine.org/stories/20151019-epf.html

Severe ship damage from very high sea states and rogue waves is always a possibility for ships operating in the open ocean. However, the bow damage experienced by the EPFs operating in the open ocean points to underlying design and operational issues for this type of ship.

For additional commentary on problems associated with bow damage to vessels operating in the open ocean, I refer you to the short video at the following link:

https://www.youtube.com/watch?v=8-QNAwUdHUQ

It’s As Simple As Riding A Bicycle

Thanks to Mike Spaeth for sending me a very interesting video that demonstratres the great difficulty a person encounters trying to ride a bicycle that has one significant modification as shown below: gears were inserted to reverse the mechanical connection between the handlebars and the front wheel.

Modified bike 1

Turn the handlebars right and the front wheel turns left.

Modified bike 3

Turn the handlebars left and the front wheel turns right.

Modified bike 2

Image source: see web link below

This sounds simple enough because the mechanics of the modifications are easily understandable, but remarkably, the modified bicycle proved to be unrideable. The point of the video is that the brain has developed an understanding of how to control a conventional bicycle and the process of learning how to control the modified bicycle is much more difficult than you might expect. The adult author of the video said it took him 8 months of practice to be able to ride the modified bicycle successfully, initially with a great deal of concentration. It took his young son only 2 weeks to accomplish the same thing, perhaps demonstrating the neuroplasticity of a child’s brain.

After becoming proficient on the modified bicycle, going back and riding a conventional bicycle also proved to be difficult for the adult author. The understanding of the applicable control laws for the conventional bicycle was temporarily lost, but finally “clicked” back into place after a bit of practice. This experiment demonstrated that the brain does not make the transition between very different control laws like flipping a switch, at least in the case of this bicycle modification. This also may explain how I wound up on the wrong side of the road in Australia.

You can see this interesting video at the following link:

http://viewpure.com/MFzDaBzBlL0?ref=bkmk

DARPA Maximum Mobility & Manipulation (M3) Program is Showing Impressive New Results with the Boston Dynamics / MIT Cheetah

Peter Lobner

The two primary goals of the M3 program are:

  • Create a significantly improved scientific framework for the rapid design and fabrication of robot systems and greatly enhance robot mobility and manipulation in natural environments.
  • Significantly improve robot capabilities through fundamentally new approaches to the engineering of better design tools and fabrication methods.

More details on the M3 program are presented on the following DARPA website:

http://www.darpa.mil/our_work/dso/programs/maximum_mobility_and_manipulation_(m3).aspx

In September 2012, the DARPA / Boston Dynamics / MIT Cheetah 4-legged robot, being developed under the M3 program, reached a top speed of over 29 mph in a tethered test on a treadmill, exceeding the fastest speed ever run by a human, Usain Bolt, at 27.78 mph in a 20-meter sprint. You can see a video of this tethered test of the Cheetah at the following link:

https://www.youtube.com/watch?v=YqpO58x7vuE

In May 2015, the Cheetah demonstrated it’s ability to hurdle obstacles up to 18”tall in both tethered treadmill and untethered indoor track tests while running at an average speed of about 5 mph.

MIT-Jumping-Cheetah-1  Source: MIT

You can read the article and see a video of this test at the following link:

https://newsoffice.mit.edu/2015/cheetah-robot-lands-running-jump-0529

As described in this article:

“To get a running jump, the robot plans out its path, much like a human runner: As it detects an approaching obstacle, it estimates that object’s height and distance. The robot gauges the best position from which to jump, and adjusts its stride to land just short of the obstacle, before exerting enough force to push up and over. Based on the obstacle’s height, the robot then applies a certain amount of force to land safely, before resuming its initial pace.”

 On the treadmill, the Cheetah only had about a meter in which to detect the obstacle and then plan and execute the jump. Nonetheless, the Cheetah cleared the obstacles about 70% of the time. I can only imagine that a human runner on that same treadmill might not have performed much better. In the untethered tests on an indoor track, the Cheetah cleared the obstacles about 90% of the time. Future tests will explore the ability of the Cheetah to clear hurdles on softer terrain.

You can see more high-mobility robots being developed by Boston Dynamics at the following link:

http://www.bostondynamics.com/index.html

These robots include:

  • Atlas: a high mobility, humanoid (bipedal) robot designed to negotiate outdoor, rough terrain. Atlas will be one of the competitors in the DARPA Robotics Challenge (DRC) Finals that will take place on 5 – 6 June 2015 at Fairplex in Pomona, California. See my 23 March 2015 post for more information on the DRC Finals.
  • LS3: a rough-terrain quadruped robot designed to go anywhere soldiers go on foot, helping carry their load.
  • PETMAN: an anthropomorphic (bipedal) robot designed for testing chemical protection clothing.
  • BigDog: a rough-terrain quadruped robot that walks, runs, climbs and carries heavy loads.
  • Sand Flea: a small robot that drives like an remote-controlled car on flat terrain, but can jump 30 ft. into the air to overcome obstacles
  • RHex: a six-legged, high mobility robot designed to climb in rock fields, mud, sand, vegetation, fallen telephone poles, railroad tracks, and up slopes and stairways.
  • RiSE: a robot that uses micro-claws to climb vertical terrain such as walls, trees and fences.
  • LittleDog: a quadruped robot designed for research on learning locomotion.

Dr. Seuss Explains Why Computers Sometimes Crash

Thanks to Dave Groce for bringing the following  bit of Dr. Seuss wisdom to our attention. You also can find it the following link:

http://bomb-diggity.com/dr_seuss.htm

Dr Seuss & computers  Source: bob-diggity.com

If a packet hits a pocket on a socket on a port,

And the bus is interrupted at a very last resort,

And the access of the memory makes your floppy disk abort,

Then the socket packet pocket has an error to report.

If your cursor finds a menu item followed by a dash,

and the double-clicking icon puts your window in the trash;

and your data is corrupted cuz the index doesn’t hash,

then your situation’s hopeless and your system’s gonna crash!

If the label on the cable on the table at your house

Says the network is connected to the button on your mouse,

But your packets want to tunnel to another protocol,

That’s repeatedly rejected by the printer down the hall,

And your screen is all distorted by the side effects of gauss,

So your icons in the window are as wavy as a souse;

Then you may as well reboot and go out with a bang,

‘Cuz sure as I’m a poet, the sucker’s gonna hang!

When the copy of your floppy’s getting sloppy in the disk

And the microcode instructions cause unnecessary risk,

Then you’ll have to flash the memory and you’ll want to RAM your ROM.

Quickly turn off the computer and be sure to tell your Mom.