LightSail to Demonstrate the Feasibility of Solar Sail Technology for Future Spacecraft Propulsion

Peter Lobner

Light exerts a measurable pressure on solid objects. This was demonstrated in 1899 in an experiment conducted by Russian scientist Pyotr Nikolayevich Lebedev. This experiment also demonstrated that the pressure of light is twice as great on a reflective surface than on an absorbent surface. This is the basis for the solar sail concept for spacecraft propulsion.

Solar sailing  Source:  Planetary Society

The Japanese IKAROS (Interplanetary Kite-craft Accelerated by Radiation Of the Sun) spacecraft launched on 20 May 2010 is the world’s first spacecraft to use solar sailing as its main propulsion. The square solar sail measured 14.14 meters (46.4 feet) along its edge, with a total area of 200 square meters (2,153 square feet). Thin-film solar cells in the sail provide electric power for spacecraft systems. IKAROS was launched as a secondary payload in conjunction with the Japanese Venus Climate Orbiter. The Japanese Aerospace Exploration Agency (JAXA) claims that acceleration and attitude control of IKAROS were demonstrated during the spacecraft’s flight toward Venus. The total velocity effect over the six-month flight to Venus was reported to be 100 m/s. IKAROS continued into solar orbit while its companion spacecraft entered orbit around Venus.

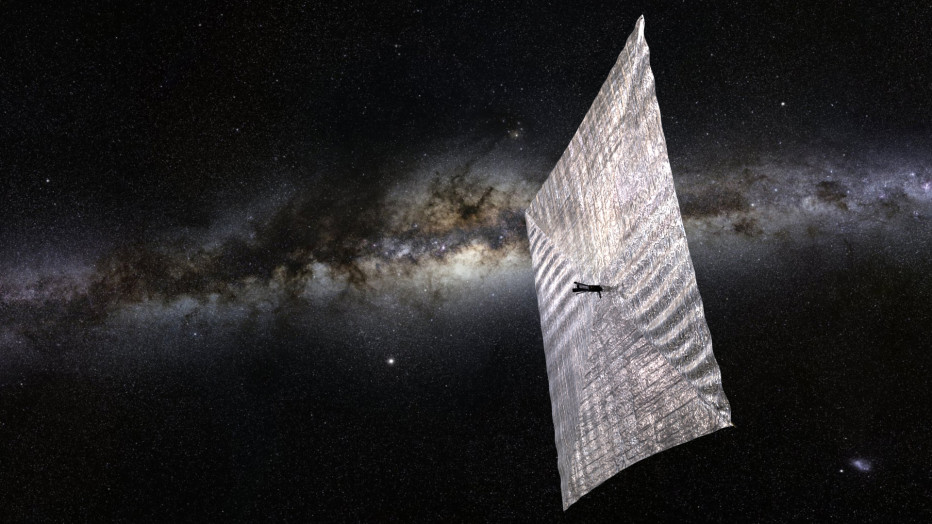
The Planetary Society conceived and is executing a crowd-funded project called LightSail to continue demonstrating the feasibility of solar sail technology. You can read more at their website:

http://sail.planetary.org

Packaged into a compact 3-unit “CubeSat” (about the size of a loaf of bread) for launch, the Planetary Society’s first LightSail spacecraft, LightSail A, hitched a ride into orbit on an Air Force Atlas V booster on 20 May 2015. The primary purpose of this first mission is to demonstrate that LightSail can deploy its 32 square meter (344 square foot) reflective Mylar solar sail properly in low Earth orbit.  Following launch and orbital checkout, the sail is expected to be deployed 28 days after launch. Thereafter, atmospheric drag will cause the orbit to decay.

LightSail A spacecraft Source: Planetary Society

You can read more about the first mission at the following link:

http://www.wired.com/2015/05/blasting-off-today-satellite-sails-sunbeams/?mbid=social_twitter&utm_source=howtogeek&utm_medium=email&utm_campaign=newsletter

In a second mission planned for 2016, LightSail B will be deployed into a higher orbit with the primary purpose of demonstrating propulsion and maneuverability. LightSail B will be similar to LightSail A, with the addition of a reaction wheel that will be used to control the orientation of the spacecraft relative to the Sun. This feature should allow the spacecraft to tack obliquely relative to the photon stream from the Sun, enabling orbital altitude and/or inclination to be changed.

You can find more information on solar sail physics and use of this technology at the following link:

http://en.wikipedia.org/wiki/Solar_sail

 29 May 2015, Update 1:

After launch, the LightSail A spacecraft’s computer was disabled by a software problem and the spacecraft lost communications with Earth.  Reset commands have failed to reboot the computer.  The computer and communications problems occurred before the solar sail was scheduled to be deployed.

31 May 2015, Update 2:

The LightSail A computer successfully rebooted and communications between the spacecraft and the ground station have been restored.  The plan is for ground controllers to install a software fix, and then continue the mission.

9 June 2015, Update 3:

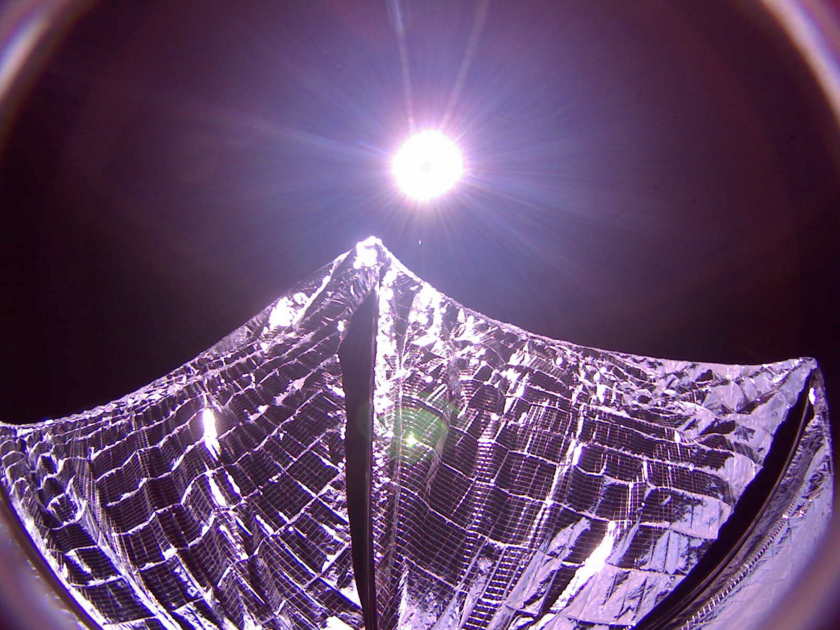
The Planetary Society announced that the LightSail A spacecraft successfully completed its primary objective of deploying a solar sail in low-Earth orbit.

20150609_ls-a-sails-out_f840  Source: Planetary Society

Read their detailed announcement at the following link:

http://www.planetary.org/blogs/jason-davis/2015/20150609-lightsail-test-mission-success.html

Graphene Applications and Development Status

Peter Lobner

Graphene is a 2-dimensional (one atom thick) structure of graphite, composed of carbon atoms tightly bonded together in a hexagonal lattice. These physical properties give graphene an extraordinary combination of high strength, low weight, high thermal and electrical conductivity.

image   Source: Gizmag.com

The firm Graphena is a commercial graphene supplier. Their website is a good source of information regarding graphene technology. Basic graphene properties are explained at the following link:

http://www.graphenea.com/pages/graphene-properties#.VVHntHDXeK0

A description of expected graphene applications is at the following link:

http://www.graphenea.com/pages/graphene-uses-applications#.VVHcNHDXeK0

These potential applications include:

  • Biological engineering: bioelectric sensory devices, antibiotic / anti-cancer treatment, tissue regeneration
  • Optical electronics: rollable e-paper, flexible electronic components and displays
  • Ultrafiltration: water purification, desalination, biofuel manufacturing
  • Composite materials: higher-strength, lower-weight replacement for current carbon fiber composites in aircraft and other vehicle structures, body armor
  • Photovoltaic cells: cost-effective, high-efficiency replacement for silicon solar cells in current applications, and new applications for flexible PV cells such as window screens and installations on curved surfaces.
  • Energy storage: higher-capacity supercapacitors and batteries

A key limitation to developing graphene applications has been the relatively high cost of manufacturing graphene. Presently, chemical vapor deposition (CVD) is the process commonly used to manufacture high-quality graphene on a large scale. A breakthrough in lower-cost CVD manufacturing technology recently was announced by the firm Carbon Sciences, Inc. and the University of California Santa Barbara (UCSB). You can read more about this announcement at the following link:

http://www.globalenergyworld.com/mobile/news/16193/Carbon_Sciences_Announces_Successful_Production_of_High_Quality_Graphene.htm?

The era of industrial application of graphene appears to be a step closer to realization.

17 January 2019 Update:

At the 125thmeeting of the Lyncean Group of San Diego on 9 January 2019, Caltech professor Nai-Chang Yea provided an in-depth review of graphene technology in her presentation, “The Rise of Graphene: From Laboratory Curiosity to a Wonder Material for Science and Technology.”  You’ll find details of her presentation on the Lynceans Past Meetings webpage or at the following direct link:

https://lynceans.org/talk-125-1-9-19/

Graphene technology is advancing rapidly.  You’ll find additional information in the following recent articles:

  • Gibney, “Superconductivity with a twist,” Nature, Volume 565, 3 January 2019

https://www.nature.com/magazine-assets/d41586-018-07848-2/d41586-018-07848-2.pdf

  • Nicol, “What is Graphene? – Stronger than steel, thinner than paper, grapheme could be the future of tech,” Digital Trends, 15 November 2018

https://www.digitaltrends.com/cool-tech/what-is-graphene/

If you’re interested in even more news on graphene, check out the Graphine-info website here:

https://www.graphene-info.com/news

If you wish, you can sign up on this website for a free graphene newsletter.

What Satellite Data Tell Us About the Earthquake in Nepal

Peter Lobner

A 7.8 magnitude earthquake occurred in the Gorkha region of Nepal on 29 April 2015. A ground displacement map based on data gathered from the Sentinel-1A satellite is shown below. In this image, yellow areas represent uplift and the blue areas represent subsidence.

image Source: ESA

Surface ruptures are places in the ground where the quake has cracked the rock all the way up to the surface. Preliminary satellite data indicate that the Nepal earthquake did not cause any new surface ruptures.

Interferometric analysis of before and after satellite data can be used to measure more subtle changes in the vertical height of the ground along the fault line. Preliminary results from an interferometric analysis by the European Space Agency (ESA), generated from satellite scans of Nepal from April 17 and 29, 2015, is shown in the following image.

image  Source: ESA

Each fringe of color represents 2.8 cm of ground deformation. Areas immediately south of the fault line, like Kathmandu, sank more than a meter into the ground as a result of the quake. Directly north of the fault slip, further into the Himalayas, the ground was lifted up by about a half meter, indicated by the yellow in the first image, above.

Imagine the difficulty of gathering such data from direct physical examination of the affected area.

Read the full article on the Nepal earthquake preliminary satellite data analysis at the following link:

http://www.wired.com/2015/05/satellite-data-tells-us-nepals-brutal-quake/

Read a general article on the use of satellite data to map earthquakes at the following link:

http://www.wired.com/2015/04/turns-satellites-work-great-mapping-earthquakes/

Hubble Space Telescope 25th Anniversary Didn’t Come Easily

Peter Lobner

The Hubble Space Telescope was launched on 24 April 1990 by the space shuttle Discovery on mission STS-31, and was deployed into orbit on 25 April. You can find details on the design of Hubble at the following link:

http://hubblesite.org/the_telescope/

During system checkout, it was determined that a design error had been made and Hubble’s primary optics suffered from spherical aberration. This optical problem was corrected in 1993 on Servicing Mission 1 (SM1), which also resolved several other issues. Over Hubble’s 25 year operating life, five servicing missions were conducted by space shuttle astronauts.

SM-1 – launched 2 Dec 1993, shuttle Endeavour
SM-2 – launched 11 Feb 1997, shuttle Discovery
SM-3A – launched 19 Dec 1999, shuttle Discovery
SM-3B – launched 1 Mar 2002, shuttle Columbia
SM-4 – launched 11 May 2009, shuttle Atlantis

The Hubble today is quite a different machine than the one launched in 1990. You can see details of each servicing mission at the following NASA website:

http://asd.gsfc.nasa.gov/archive/hubble/overview/timeline.html

NASA’s Hubble mission website is at the following link:

http://www.nasa.gov/mission_pages/hubble/main/index.html

Here you have access to details about Hubble’s 25-year mission, including an extensive photo gallery. NASA’s official photo to commemorate the 25th anniversary is the following photo of the Westerlund 2 star cluster taken by Hubble’s near-infrared Wide-Field Camera 3, which was installed during SM-4.

image Source:  NASA

World Federation of Great Towers

Peter Lobner

The tower is one of mankind’s oldest architectural accomplishments. The World Federation of Great Towers is an international association with 48 members in over 20 countries that exists to showcase the world’s great modern towers and celebrate the feats of architecture and engineering that led to their creation. You can examine many of the tallest buildings in the world at the following link:

http://www.great-towers.com/towers/

The following members of the World Federation of Great Towers were completed in the last decade include:

  • Oct 2005 – Spinnaker Tower, Portsmouth, NH, 170 m (558 ft) tall
  • Apr 2006 – Goryokaku Tower, Hokkaido, Japan, 107 m (351 ft) tall
  • Oct 2006 – Eureka Skydeck 88, Melbourne, Australia, 300 m (984 ft) tall (see photo below)
  • Oct 2007 – The Hague Tower, The Hague, Netherlands, 132 m (433 ft) tall
  • Jan 2010 – Burj Khalifa, Dubai, UAE, 828 m (2,716.5 ft) tall
  • Sep 2010 – Canton Tower, Guangzhou, China, 600 m (1,968 ft) tall
  • April 2011 – Henan Tower (Tower of Fortune), Zhengzhou, China, 388 m (1,273 ft) tall
  • May 2012 – The Shard, London, UK, 310 m (1,016 ft) tall

image Eureka Skydeck 88   Source: Melbourne Library

The World Federation of Great Towers membership does not include all of the very tall buildings in the world, such as the new One World Trade Center in New York City. You can find a listing of all of the world’s buildings that have a height exceeding 300 meters (984 feet) at the following link:

http://en.wikipedia.org/wiki/List_of_tallest_buildings_in_the_world

Sorting this list by date highlights the great number (72) of very tall buildings that have been completed in the past decade:

  • 2005:  2
  • 2006:  0
  • 2007:  5
  • 2008:  2
  • 2009:  5
  • 2010: 13
  • 2011: 8
  • 2012: 14
  • 2013:  7
  • 2014:  9
  • 2015:  7

There definitely is a building boom for giant skyscrapers.

22 May 2016 Update: Global Tall Building Database

Another source of information on skyscrapers is the Council on Tall Buildings and Urban Habitat (CTBUH). Their home page is at the following link:

http://www.ctbuh.org

From here, you can navigate to their Tall Buildings Information & Resources, including The Skyscraper Center, which contains the Global Tall Building Database. The direct link to the Skyscraper Center is:

http://skyscrapercenter.com

5 January 2019 Update:  Top 30 tallest buildings dynamic info-graphic

Ian Fisher (WawamuStats) created the following dynamic Info-graphic that compares the world’s top 30 tallest buildings ever built. Most of these buildings are located in China, UAE, or the United States.  The oldest of these buildings was completed in 1974 and the newest in 2018.  The Empire State Building is not among the top 30. Here’s the link to the dynamic Info-graphic:

https://www.youtube.com/watch?v=zCoEGFaDvjQ

The Past Half Century of Engineering – and a Look Forward

Peter Lobner

At its annual meeting on September 28-29, 2014, the National Academy of Engineering celebrated the 50th anniversary of its founding. A highlight of the meeting was a forum of distinguished speakers who discussed engineering achievements of the last 50 years and looked to potential engineering achievements in the next 50 years. The new National Academies Press publication, “The Past Half Century of Engineering – and a Look Forward,” summarizes their presentations.

image  Source: National Academies Press

If you have set up a MyNAP account as described in my 14 March 2015 post, you can download a pdf copy of this document for free from NAP at the following link:

http://www.nap.edu/catalog/21702/the-past-half-century-of-engineering—and-a-look-forward

2014 U.S. National Seismic Hazard Model and Induced Seismicity

Peter Lobner

The U.S. Geologic Society (USGS) National Seismic Hazard Model for the conterminous United States was updated in 2014 to account for new methods, input models, and data necessary for assessing the seismic ground shaking hazard from natural (tectonic) earthquakes. The National Seismic Hazard Maps are derived from seismic hazard curves calculated on a grid of sites across the U.S. that describe the annual frequency of exceeding a set of ground motions. Data and maps from the 2014 U.S. Geological Survey National Seismic Hazard Mapping Project are available for download at the following link:

http://earthquake.usgs.gov/hazards/products/conterminous/

The 2014 maps show higher seismicity in the Eastern U.S. than predicted in previous models. This reflects the significance of the 23 August 2011 magnitude 5.8 earthquake that occurred in Mineral, VA, about 11 miles from the North Anna nuclear power plant. That earthquake was felt as far north as Rhode Island, New York City and Martha’s Vineyard, Mass. The North Anna plant responded well and safely shutdown following the earthquake, which exceeded the plant’s seismic design basis.

The seismic hazard from “potentially induced” earthquakes (I.e., earthquakes that can be associated with man-made activities) was intentionally not considered because there was not a consensus on how to properly treat these earthquakes in a seismic hazard analysis.

The USGS issued a new report on 23 April 2015 examining the sensitivity of the seismic hazard from induced seismicity to five parts of the hazard model: (1) the earthquake catalog, (2) earthquake rates, (3) earthquake locations, (4) earthquake Mmax (maximum magnitude), and (5) earthquake ground motions. In the report, the USGS describes alternative input models for each of the five parts that represent differences in scientific opinions on induced seismicity characteristics.

You can download this interim report for free at the following link:

http://pubs.usgs.gov/of/2015/1070/

The USGS plans to issue a final model after further consideration of the reliability and scientific acceptability of each alternative input model. This matter could have important implications for industries, such as hydraulic fracking and geologic carbon dioxide sequestration, that may contribute to induced seismicity.

Messenger Spacecraft Mission at Mercury About to End

Peter Lobner

Updated 12 January 2016

The 1,069 pound Messenger (MErcury Surface, Space ENvironment, GEochemistry, and Ranging) spacecraft is only the second spacecraft sent to Mercury. Mariner 10 flew past Mercury three times in 1974 and 1975. Messenger was launched on 3 August 2004 and flew for 6-1/2 years on a circuitous trajectory that included 15 orbits of the sun, one flyby of Earth, two flybys of Venus, and three flybys of Mercury before entering orbit around Mercury in 18 March 2011. The series of planetary flybys allowed Messenger to decelerate relative to Mercury and achieve orbit with minimal use of fuel.

The NASA Messenger mission website is at the following link:

http://www.nasa.gov/mission_pages/messenger/main/index.html

Messenger is solar-powered, with its science payload and propulsion system located behind a sunshade to protect against the intense solar radiation encountered at Mercury’s close orbit of the Sun.

image  Source: Johns Hopkins University/APL

Messenger has instrumentation for mapping and characterizing Mercury using imaging cameras, laser altimeter, various spectrometers, magnetometer, and a radio science package to measure slight velocity changes in orbit. You can read details on the spacecraft instrumentation systems at the following link:

http://messenger.jhuapl.edu/the_mission/spacecraft_design.html

After four years in orbit, fuel needed to maintain orbit is expected to be depleted in April. Messenger’s orbit will decay and the spacecraft eventually will crash at perigee into Mercury’s surface at its orbital speed of 8,750 mph.

12 January 2016 update:

On 30 April 2015, Messenger crashed into the surface of Mercury on the side facing away from Earth.  Before crashing, Messenger orbited Mercury 4,105 times and collected more than 277,000 images.  A composite photograph of Mercury created from thousands of Messenger images is shown below:

Mercury composite imaages from MessengerSource: NASA /  Johns Hopkins University/APL

Dark Matter Map Unveils First Results

Peter Lobner

The Dark Energy Survey (DES) is designed to probe the origin of the accelerating universe and help uncover the nature of dark energy by measuring the 14-billion-year history of cosmic expansion with high precision. The survey involves more than 300 scientists from six countries and uses images taken by one of the best digital cameras in the world: the 570-megapixel Dark Energy Camera (DECam), mounted on the Victor Blanco telescope at the Cerro Tololo Inter-American Observatory, 500 km north of Santiago at an altitude of 2,200 meters in the Chilean Andes. For more information on this collaborative program, refer to the DES website at the following link:

http://www.darkenergysurvey.org

Two years into this survey, the DES team presented the first detailed map of dark matter concentrations in a very small sector of the sky.

image  Source: DES

The initial map covers just 0.4% of the sky, but in unprecedented detail. Eventually, DES plans to map one-eighth of the sky. Read details about this initial dark matter map at the following link:

http://www.bbc.com/news/science-environment-32284995?utm_source=howtogeek&utm_medium=email&utm_campaign=newsletter

Arctic Matters – The Global Connection to Changes in the Arctic

Peter Lobner

Arctic Matters is new public education resource produced by the Polar Research Board of the National Research Council (NRC) and published by National Academies Press (NAP). It draws upon a large collection of peer-reviewed NRC reports and other national and international reports to provide a brief, reader-friendly primer on the complex ways in which the changes currently affecting the Arctic and its diverse people, resources, and environment can, in turn, affect the entire globe.

image     Source: NAP

You can download this booklet for free from NAP at the following link:

http://www.nap.edu/catalog/21717/arctic-matters-the-global-connection-to-changes-in-the-arctic

You also can visit NRC interactive Arctic Matters website at the following link:

http://nas-sites.org/americasclimatechoices/more-resources-on-climate-change/arctic-matters-the-global-connection-to-changes-in-the-arctic-2/