Peter Lobner
Ignatius Donnelly was the author of the book, Atlantis: The Antediluvian World, which was published in 1882. I remember reading this book in 1969, and being fascinated by the concept of a lost continent hidden somewhere beneath today’s oceans. While Atlantis is yet to be found, researchers have reported finding extensive continental landmasses beneath the waters of the South Pacific and Indian Oceans. Let’s take a look at these two mostly submerged continents and how improved knowledge of their subsea geography and geology can affect the definition of sovereign maritime zones.
Zealandia
In a 2016 paper entitled, “Zealandia: Earth’s Hidden Continent,” the authors, N. Mortimer, et al., reported on finding a submerged, coherent (i.e., not a collection of continental fragments) continental landmass about the size of India, located in the South Pacific Ocean off the eastern coast of Australia and generally centered on New Zealand. The extent of Zealandia is shown in the following map.
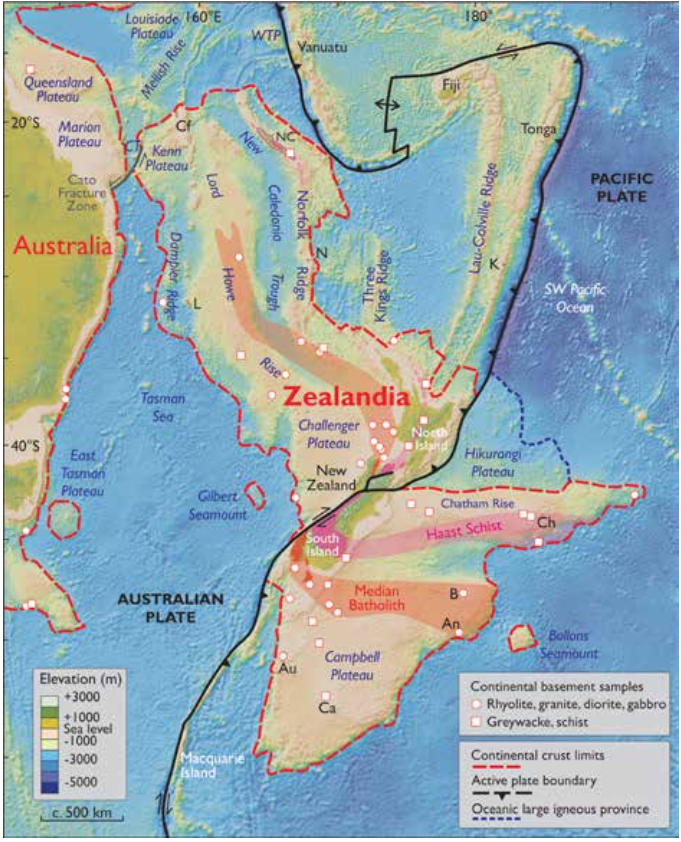 Source: N. Mortimer, et al., “Zealandia: Earth’s Hidden Continent,” GSA Today
The authors explain:
“A 4.9 Mkm2 region of the southwest Pacific Ocean is made up of continental crust. The region has elevated bathymetry relative to surrounding oceanic crust, diverse and silica-rich rocks, and relatively thick and low-velocity crustal structure. Its isolation from Australia and large area support its definition as a continent—Zealandia. Zealandia was formerly part of (the ancient supercontinent) Gondwana. Today it is 94% submerged, mainly as a result of widespread Late Cretaceous crustal thinning preceding supercontinent breakup and consequent isostatic balance. The identification of Zealandia as a geological continent, rather than a collection of continental islands, fragments, and slices, more correctly represents the geology of this part of Earth. Zealandia provides a fresh context in which to investigate processes of continental rifting, thinning, and breakup.”
The authors claim that Zealandia is the seventh largest continental landmass, the youngest, and thinnest. While they also claim it is the “most submerged,” that claim may have been eclipsed by the discovery of another continental landmass in the Indian Ocean.
You can read the complete paper on Zealandia on the Geological Society of America (GSA) website at the following link:
http://www.geosociety.org/gsatoday/archive/27/3/pdf/GSATG321A.1.pdf
Mauritia
In the February 2013 paper, “A Precambrian microcontinent in the Indian Ocean,” authors T. Torsvik, et al., noted that an arc of volcanic islands in the western Indian Ocean, stretching from the west coast of India to the east coast of Madagascar, had been thought to be formed by the Réunion mantle plume (a hotspot in the Earth’s crust) and then distributed by tectonic plate movement over the past 65 million years. Their analysis of ancient rock zircons 660 million to 2 billion years old, found in beach sand, led them to a different conclusion. The presence of the ancient zircons was inconsistent with the geology of the more recently formed volcanic islands, and was evidence of “ancient fragments of continental lithosphere beneath Mauritius (that) were brought to the surface by plume-related lavas.”
The ages of the zircon samples were determined using U-Pb (uranium-lead) dating. This dating technique is particularly effective with zircons, which originally contain uranium and thorium, but no lead. The lead content of a present-day zircon is attributed to uranium and thorium radioactive decay that has occurred since the zircon was formed. The authors also used gravity data inversion (a technique to extract 3-D structural details from gravity survey data) to map crustal thicknesses in their areas of interest in the Indian Ocean.
The key results from this study were:
“…..Mauritius forms part of a contiguous block of anomalously thick crust that extends in an arc northwards to the Seychelles. Using plate tectonic reconstructions, we show that Mauritius and the adjacent Mascarene Plateau may overlie a Precambrian microcontinent that we call Mauritia.”
This paper is available for purchase on the Nature Geoscience website at the following link:
http://www.nature.com/ngeo/journal/v6/n3/full/ngeo1736.html
This ancient continent of Mauritia is better defined in the 2016 article, “Archaean zircons in Miocene oceanic hotspot rocks establish ancient continental crust beneath Mauritius,” by L. Ashwai, et al.. The authors provide further evidence of this submerged continental landmass, the approximate extent of which is shown in the following map.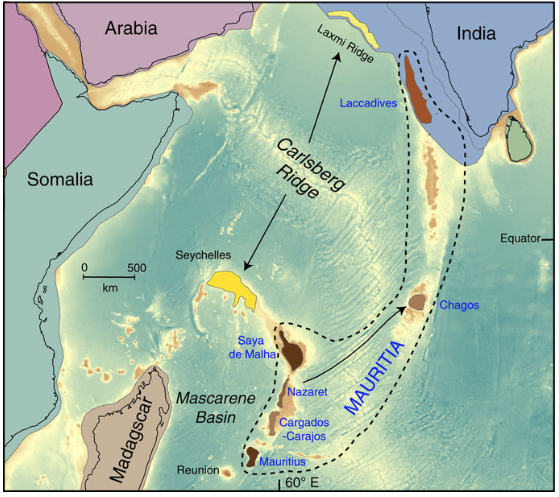 Source: L. Ashwai, et al., Nature Communications
The authors report:
“A fragment of continental crust has been postulated to underlie the young plume-related lavas of the Indian Ocean island of Mauritius based on the recovery of Proterozoic zircons from basaltic beach sands. Here we document the first U–Pb zircon ages recovered directly from 5.7 Ma (million year old) Mauritian trachytic rocks (a type of igneous volcanic rock). We identified concordant Archaean xenocrystic zircons ranging in age between 2.5 and 3.0 Ga (billion years old) within a trachyte plug that crosscuts Older Series plume-related basalts of Mauritius. Our results demonstrate the existence of ancient continental crust beneath Mauritius; based on the entire spectrum of U–Pb ages for old Mauritian zircons, we demonstrate that this ancient crust is of central-east Madagascar affinity, which is presently located ∼700 km west of Mauritius. This makes possible a detailed reconstruction of Mauritius and other Mauritian continental fragments, which once formed part of the ancient nucleus of Madagascar and southern India.”
Starting about 85 million years ago, the authors suggest that the former contiguous continental landmass of Mauritia was “fragmented into a ribbon-like configuration because of a series of mid-ocean ridge jumps,” associated with various tectonic and volcanic events.
You can read the complete article on the Nature Communications website at the following link:
http://www.nature.com/articles/ncomms14086
Implications to the definition of maritime zones
The UN Convention on the Law of the Sea (UNCLOS) provides the basic framework whereby nations define their territorial sea, contiguous zone, and exclusive economic zone (EEZ). These maritime zones are depicted below.
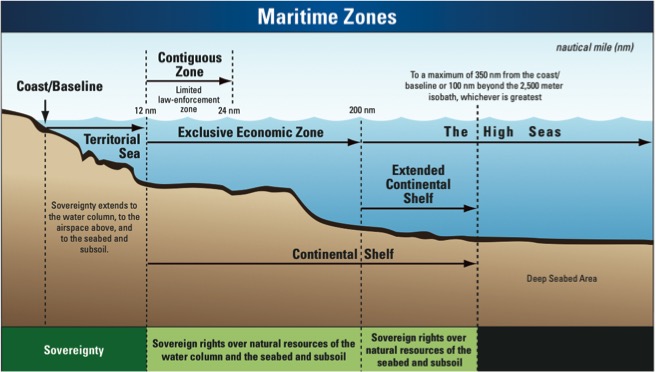 Source: http://continentalshelf.gov/media/ECSposterDec2010.pdf
UNCLOS Article 76 defines the basis whereby a nation can claim an extended territorial sea by demonstrating an “extended continental shelf,” using one of two methods: formula lines or constraint lines. These options are defined below.
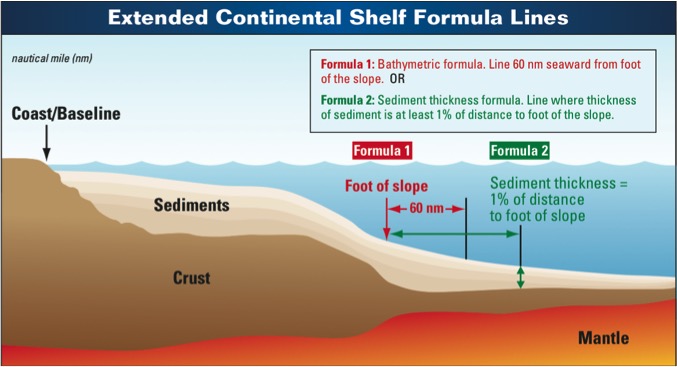
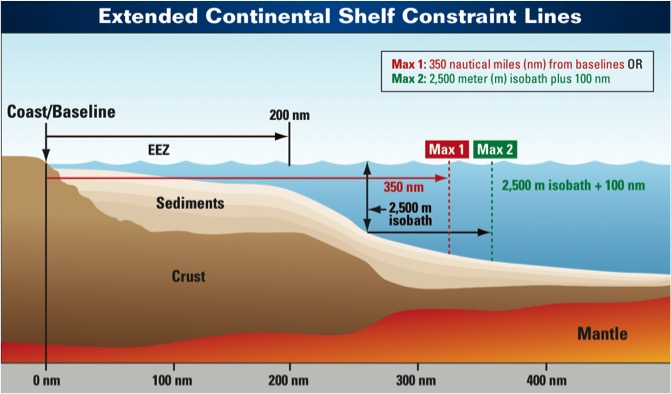 Source: http://continentalshelf.gov/media/ECSposterDec2010.pdf
You’ll find more details (than you ever wanted to know) in the paper, “A Practical Overview of Article 76 of the United Nations Convention on the Law of the Sea,” at the following link:
New Zealand’s Article 76 application
New Zealand ratified UNCLOS in 1996 and undertook the Continental Shelf Project with the firm GNS Science “to identify submarine areas that are the prolongation of the New Zealand landmass”. New Zealand submitted an Article 76 application on 19 April 2006. Recommendations by the UN Commission on the Limits of the Continental Shelf (CLCS) were adopted on 22 August 2008. A UN summary of New Zealand’s application is available here:
http://www.un.org/depts/los/clcs_new/submissions_files/submission_nzl.htm
The detailed CLCS recommendations are available here:
http://www.un.org/depts/los/clcs_new/submissions_files/nzl06/nzl_summary_of_recommendations.pdf
Additional information in support of New Zealand’s application is available on the GNS Science website here:
https://www.gns.cri.nz/static/unclos/
Seychelles and Mauritius joint Article 76 application
The Republic of Seychelles ratified UNCLOS on 16 November 1994 and the Republic of Mauritius followed suit on 4 December 1994. On 1 December 2008, these countries jointly made an Article 76 application claiming continental shelf extensions in the region of the Mascarene Plateau. A UN summary of this joint application is available here:
http://www.un.org/depts/los/clcs_new/submissions_files/submission_musc.htm
The CLCS recommendations were adopted on 30 March 2011, and are available here:
http://www.un.org/depts/los/clcs_new/submissions_files/musc08/sms08_summary_recommendations.pdf
Implications for the future
The recent definitions of the mostly submerged continents of Zealandia and Mauritia greatly improve our understanding of how our planet evolved from a supercontinent in a global sea to the distributed landmasses in multiple oceans we know today.
Beyond the obvious scientific interest, improved knowledge of subsea geography and geology can give a nation the technical basis for claiming a continental shelf extension that expands their EEZ. The new data on Zealandia and Mauritia postdate the UNCLOS Article 76 applications by New Zealand, Seychelles and Mauritius, which already have been resolved. It will be interesting to see if these nations use the new research findings on Zealandia and Mauritia to file new Article 76 applications with broader claims.

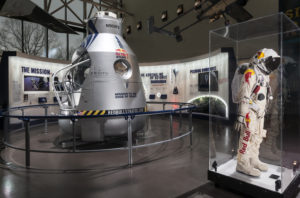 Red Bull Stratos gondola & pressure suit. Source: Smithsonian