Category Archives: All Posts

Grand Finale of the Cassini Mission to Saturn

Peter Lobner

The National Aeronautics and Space Administration’s (NASA’s) Cassini spacecraft was launched on 15 October 1997 and cruised through interplanetary space for seven years before arriving at Saturn on 30 June 2004. The Cassini spacecraft carried the European Space Agency’s (ESA’s) Huygens probe, which landed on Saturn’s largest moon, Titan, on 14 January 2005. Since then, Cassini has been performing a series of missions in orbit around Saturn, returning spectacular images and collecting scientific data on the ringed planet and its many moons.

In 2017, Cassini is performing its Grand Finale in a highly elliptical polar orbit around Saturn. The geometry for this orbital flight path is shown in the following diagram.

Cassini_20161205cSource: NASA/JPL-Caltech

In the first phase of the Grand Finale (grey orbits in the above diagram), which is underway now, Cassini’s orbit crosses the plane of Saturn’s equatorial ring system just outside the F-ring (there are just two rings outside of the F-ring: G and E). Later in 2017, Cassini’s polar orbit will be adjusted to cross the plane of the ring system insider the innermost D-ring (blue orbits). From there the spacecraft will gradually descend toward Saturn in a region that has never before been explored. The mission will end when Cassini is destroyed somewhere in Saturn’s atmosphere (orange orbit). This is scheduled to occur on September 15, 2017 at 5:07 a.m. PDT.

NASA’s Cassini mission website is at the following link:

https://www.nasa.gov/mission_pages/cassini/main/index.html

You’ll find a NASA fact sheet on the Grand Finale here:

https://saturn.jpl.nasa.gov/legacy/files/Cassini_Grand_Finale_Fact_Sheet_508.pdf

You can follow the countdown to the final plunge into Saturn’s atmosphere and also review the entire mission timeline and other resources here:

https://saturn.jpl.nasa.gov/the-journey/timeline/#the-grand-finale

A few Grand Finale images taken during recent ring-grazing orbits past the F-ring are shown below.  The source of these three images and captions are: NASA/JPL-Caltech/Space Science Institute

Cassini_pia21056_deblurred cropThe above image, taken 16 January 2017, shows Saturn’s moon Daphnis (5 miles, 8 kilometers across), which orbits within the 26 mile (42 km) wide Keeler Gap (between the F and A rings). The gap appears foreshortened because of the viewing angle. The little moon’s gravity raises waves in the edges of the gap in both the horizontal and vertical directions.

Cassini_pia20511-1041Waves created by Daphnis are visible in this wider-angle view of the ring system. The F-ring is the bright, narrow ring crossing the center of the image. Since the moon moves in and out of the ring-plane, and closer to and farther from the rings’ edges as it orbits, the waves it makes change over time.

Cassini_pia21055-1041This image, taken on 18 December 2016, is one of the highest-resolution views ever taken of Saturn’s moon Pandora (52 miles, 84 kilometers across), which orbits just outside the F-ring.

13 April 2017 Update – Cassini’s close-up view of Saturn’s moon Pan

In early March, Cassini imaged Pan, which is one of Saturn’s innermost moons. As you can see in the following photos, this small moon (diameter of 221.7 miles, 35 km) has a most unusual shape. It isn’t known if the ridge circling the moon is solid, or a loose aggregation of particles with a very steep slope enabled by the moons weak gravity.

Source: NASA/JPL-Caltech/Space Science Institute

The NASA announcement and more photos of Pan are at the following link:

https://www.nasa.gov/image-feature/jpl/cassini-reveals-strange-shape-of-saturns-moon-pan

The Black Hole at our Galactic Center is Revealed Through Animations

Peter Lobner

Evidence is mounting that a supermassive black hole named Sagittarius A* (Sagittarius A star) dominates the center of our Milky Way galaxy. Long-term observations of the galactic center by teams of astronomers are refining our understanding of how stars move in relation to this unseen black hole.

European Southern Observatory (ESO) observations of the galactic center

The ESO, which has many observatories located high in the mountains of northern Chile, has a team involved in observing our galactic center. Two of the ESO optical observatories used in this effort are:

  • New Technology Telescope (NTT), at the La Silla Observatory, has a 3.58 m (11.75 ft) main mirror. In 1989, NTT became the first astronomical observatory with adaptive optics to help correct for atmospheric distortion.
  • Very Large Telescope (VLT), which consists of four Unit Telescopes with 8.2 m (26.9 ft) diameter main mirrors and adaptive optics. The telescopes can work together, to form a giant ‘interferometer’, allowing astronomers to see details up to 25 times finer than with the individual Unit Telescopes.

On 10 December 2008, ESO issued a “science release” entitled, ”Unprecedented 16-Year Long Study Tracks Stars Orbiting Milky Way Black Hole,” which summarized the results of observations made at NTT and VLT from 1992 to 2008. This study mapped the orbits of 30 stars in the region around the galactic center (and did not use VLT’s interferometric capabilities).

 Galactic center_eso0846aStars near our galactic center and the Sagittarius A* black hole. Source: eso0846 Science Release

The eso0846 science release is available at the following link:

http://www.eso.org/public/usa/news/eso0846/

In connection with this study, the ESO team also created a time-lapse video showing star motion around the Sagittarius A* black hole.

“Here, actual images, collected over the past 16 years, have been assembled into a time-lapse video. The real motion of the stars has been accelerated by a factor 32 million.”

This time-lapse video covers the central part of the above color image of the galactic center and shows stars moving around central point that is likely to be the black hole. You can see this animated sequence at the following link:

http://www.eso.org/public/usa/videos/eso0846j/

UCLA Galactic Center Group observations of the galactic center

The mission statement of the UCLA Galactic Center Group is:

“Transforming our understanding of Black Holes and their role in the Universe with high resolution observations of the Center of our Galaxy!”

The Galactic Center Group’s website is a good source of information on black hole science and the technologies employed to observe our galactic center. Their home page is at the following link:

http://www.galacticcenter.astro.ucla.edu/about.html

The W.M. Keck Observatory on Mauna Kea in Hawaii is comprised of two large telescopes, each with 10 m (33 ft) main mirrors and adaptive optics. Currently the Keck Observatory has the largest optical / infrared telescopes in the world. These telescopes have higher resolution than ESO’s NTT and VLT.

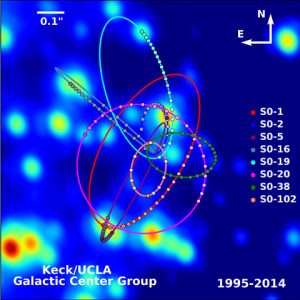
Using images taken at the Keck Observatory from 1995 to 2014, the UCLA Galactic Center Group and the W.M. Keck Observatory Laser Team have released their determination of the orbits of stars within the central 1.0 X 1.0 arcseconds of our galaxy, as shown in the following diagram.

UCLA-Keck-2014

The team reported:

“These orbits provide the best evidence yet for a supermassive black hole. While every star in this image has been observed to move since 1998, estimates of orbital parameters are best constrained for stars that have been observed through at least one turning point of their orbits.”

This makes the star S0-2 especially important because it has been observed for more than one full orbital period, which for S0-2 is only 16.17 years. The team estimates that the Sagittarius A* black hole has a mass of 4 million times the mass of the Sun.

The UCLA Galactic Center Group and the W.M. Keck Observatory Laser Team have created a series of animations that demonstrate the motion of stars near the Sagittarius A* black hole. You can navigate to these animations from the home page listed above or use the following direct link:

http://www.galacticcenter.astro.ucla.edu/animations.html

The three animations showing star motions around the Sagittarius A* black hole are:

  • Animation of the Stellar Orbits around the Galactic Center
  • 3D Movie of Stellar Orbits in the Central Parsec
  • Sagittarius A* – IR (infrared)

The importance of adaptive optics is astronomical observations is demonstrated in another animation from the UCLA Galactic Center Group.

“This animation shows observations of the Galactic Center with and without adaptive optics, illustrating the resolution gain. Adaptive optics corrects for the blurring effects of the Earth’s atmosphere. Using a bright star, we measure how a wavefront of light is distorted by the atmosphere and quickly adjust the shape of a deformable mirror to remove these distortions.”

Screenshots from this animation are shown below. The screenshot on the left is with adaptive optics OFF. The image on the right is with adaptive optics ON.

Adaptive optics OFF  Adaptive optics ON

The future

In my 6 June 2015 post, “Three Very Large, New Optical Telescopes are Under Development,” I reported on the Thirty Meter Telescope (TMT), which originally was planned for construction on Mauna Kea, near the Keck Observatory. As the name implies, TMT will have a 30 m (98.4 ft) main mirror and adaptive optics. To illustrate the improved resolution of TMT, the UCLA Galactic Center Group developed an animation showing Sagittarius A* images for the following three cases:

  • Keck telescopes with current adaptive optics (AO)
  • Keck telescopes with “next generation” adaptive optics (NGAO), and
  • The future TMT with adaptive optics.

As you can see in the following screenshot from this animation, the expected results from the much higher resolution TMT quite impressive.

Relative resolution power - Keck & TMT

TMT’s actual construction site is being reconsidered and construction has been delayed. However, ESO has broken ground for the even larger European Extremely Large Telescope (E-ELT), which is being built now at Cerro Armazones, Chile. This giant telescope has a 39 m (128 ft) main mirror and adaptive optics. It will become the largest optical / infrared telescope in the world when it is commissioned as part of ESO’s Paranal Observatory in 2024. Hopefully, time on this great telescope will be allocated to observing our galactic center.

BLOODHOUND SSC Making Progress Toward a World Land Speed Record Attempt

Peter Lobner

The BLOODHOUND Project bills itself as an international education initiative focused around a 1,000 mph World Land Speed Record attempt.

“The primary objective of the Project is to inspire the next generation to pursue careers in science, engineering, technology and math – by demonstrating how they can be harnessed to achieve the impossible, such as a jet and rocket powered car capable of setting a new World Land Speed Record.”

Since my first post in the BLOODHOUND Project on 2 March 2015, the project team has made great progress in designing, developing, constructing and testing the BLOODHOUND SSC (supersonic car) and its many components and systems.  This will be a very interesting year as the BLOODHOUND Project works up to a world land speed record attempt currently planned for November 2017 on Hakskeen Pan in South Africa.

You’ll find the BLOODHOUND website, with its many resources, at the following link:

http://www.bloodhoundssc.com

You can subscribe to the BLOODHOUND newsletter here:

http://www.bloodhoundssc.com/newsletter-signup

The project team has established an extensive video record of their work on YouTube. Starting at their YouTube home page at the following link, you can navigate through a very interesting video library.

https://www.youtube.com/channel/UCsBrBl7xmnNBkosxCeHGqPA

On 9 January 2017, the BLOODHOUND Project announced that they had launched a new series of short video programs that will take viewers through the inner workings of the land speed record car. The first video in the Anatomy of the Car series is at the following link:

https://www.youtube.com/watch?v=0bfL2XC0Fa0

BLOODHOUND SSCBLOODHOUND SSC X-raySource, both images: The BLOODHOUND Project

You can subscribe to the BLOODHOUND videos directly on their YouTube home page.

I hope you will share my enthusiasm for this inspirational international project and take time to understand the remarkable systems integration work being done by the BLOODHOUND Project.

The Cargo Bicycle – An Idea Whose Time Has Come, or Has it Been Here All Along?

Peter Lobner

There has been increasing interest in the U.S. in cargo bicycles for making pickups and deliveries, particularly in inner cities with high traffic volumes and limited parking. Human or electric-powered cargo bicycles offer obvious environmental advantages over traditional, much larger gas or diesel powered delivery vehicles.

In February 2017 IKEA will be introducing a multifunctional, affordable, “city bike” called the Sladda. In addition to IKEA’s own interpretation of conventional bicycle features, the Sladda can be equipped with a variety of cargo carriers:

  • Front basket that’s rated at 10 kg (22 pounds)
  • Rear rack that’s rated at 25 kg (55 pounds)
  • Clip-on pannier (bicycle bag), which requires rear rack and converts into a backpack
  • Trailer that’s rated to haul 49 kg (108 pounds).

The rated load of the bicycle itself is 160 kg (352 pounds), including the weight of rider.

IKEA Sladda-2

Sladda configured as a cargo bicycle.  Source: IKEA

You’ll find details on the Sladda on the IKEA website at the following link:

http://www.ikea.com/us/en/

Xtracycle offer the Cargo Node and Edgerunner cargo bicycles. The folding Cargo Node, shown below, has a 159 kg (350 pound) carrying capacity, including the weight of the rider. The Edgerunner is a non-folding bicycle with a 182 kg (400 pound) carrying capacity. Both can be configured with a variety of racks. You’ll find more information at the following link:

http://www.xtracycle.com

 Xtacycle cargo bikeCargo Node.  Source: Xtracycle

Cargo bicycles may be trending in the U.S., but they have been used for many decades in Europe, particularly in Scandinavian countries, and they probably have been used just as long in Asia.

On a recent trip to China and Cambodia I found that 2- and 3-wheel cargo bicycles were very common and some were capable of carrying impressive loads. It seemed the concept of “rated load” never was an issue. Also common in China and Cambodia were 3-wheel cargo scooters and a range of small cargo vehicles that were part motorcycle and part truck. These small cargo vehicles seemed well suited for use in very high volume, relatively slow moving city traffic. Following are photos of several of the cargo bicycles, scooters and motorcycles I saw on the trip.

The cargo bicycles offered by IKEA and Xtracycle are nice, but they really don’t break new ground in the use of bicycles as cargo carriers. What is new is that individuals and businesses in the U.S. are expressing increasing interest in cargo bicycles, and other forms of small urban delivery vehicles. Next time you’re stuck in city traffic, you may be passed by a cargo bicycle in the bike lane.

Basic cargo bicycleBasic cargo bicycle in Xi’an, China

Streetsweepers cargo bikeStreet sweeper’s cargo bicycle in Xi’an, China

Cargo bike with cardboardCargo bicycle in Xi’an, China

Heavy load cargo bikeHeavy cargo bicycle in Xi’an, China

Cambodian vendor cargo bikeCargo bicycle in Cambodia

Cargo scooter beijingLoading an electric cargo scooter in Beijing, China

Cargo scooter LhasaCargo scooter in traffic in Lhasa, Tibet

cargo scooter big loadElectric cargo scooter/truck with a large volume load in Beijing, China

Cargo motorcycle tractor trailerCargo motorcycle tractor/trailer in Cambodia

Critical Infrastructure: Oil and Gas Pipelines

Peter Lobner

Background on the oil and gas industry

In a 2013 report by the American Petroleum Institute (API) and PricewaterhouseCoopers (PwC) entitled, “Economic Impacts of the Oil and Natural Gas Industry on the US Economy in 2011,” it was reported that:

“Counting direct, indirect, and induced impacts, the industry’s total impact on labor income (including proprietors’ income) was $598 billion, or 6.3 percent of national labor income in 2011. The industry’s total impact on US GDP (gross domestic product) was $1.2 trillion, accounting for 8.0 percent of the national total in 2011.”

Table 1 of this report, which is reproduced below, defines the scope of the U.S. oil and natural gas industry included in this analysis.
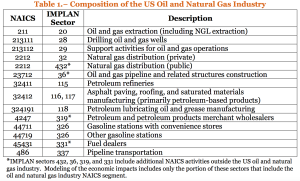
Composition of oil & gas industry

In the table footnote you can see that the API – PwC economic assessment was limited to the oil and gas industry itself, and their results did not include the economic value of the many downstream businesses whose operations are dependent on one or more of the various products delivered by the oil and gas industry (i.e., plastic and synthetic material manufacturers, airlines, trucking, power plants, etc.). If we counted the economic values of these oil and/or gas dependent businesses, then the overall contribution of the oil and gas industry to the U.S. economy would be significantly higher than stated in the API – PwC report. You can get this report at the following link:

http://www.api.org/~/media/Files/Policy/Jobs/Economic_Impacts_ONG_2011.pdf

U.S. oil and gas pipeline infrastructure

Pipeline systems are a key element of the oil and gas industry infrastructure, enabling timely and efficient transportation of the following products:

  • Crude oil
  • Petroleum products from crude oil and other liquids processed at refineries, including transportation fuels, fuel oils for heating and electricity generation, asphalt and road oil, and various feedstocks for making chemicals, plastics, and synthetic materials
  • Hydrocarbon gas liquids (HGL), including natural gas liquids (paraffins or alkanes) and olefins (alkenes) produced by natural gas processing plants, fractionators, crude oil refineries, and condensate splitters, but excluding liquefied natural gas (LNG) and aromatics
  • Natural gas

The U.S. has over 200,000 miles of liquids pipelines that, in 2014, transported 16.2 billion barrels of crude oil, petroleum products and HGL. More than 17,000 miles of liquid pipelines were added to the network in the five-year period from 2010 thru 2014. The U.S. has over 300,000 miles of interstate and intrastate natural gas transmission pipelines. That’s adds up to more than a half million miles of major oil and gas pipelines in the U.S.

Most pipelines are installed underground, with pumping / compressor stations at grade level. The Trans-Alaska pipeline system is a notable exception, with its above-grade pipeline in permafrost regions.

The U.S. Energy Information Agency (EIA) maintains the U.S. Energy Mapping System, which is a geographic information system (GIS) that can display a great deal of energy infrastructure information. The user can select the map area to be viewed, the map style, and the data to be displayed on the map. Once you’ve created the map of your choice, you can zoom and scroll to explore map details. You can access the U.S. Energy Mapping System at the following link:

https://www.eia.gov/state/maps.cfm

The following maps prepared using the U.S. Energy Mapping System show the distribution of oil and gas pipeline systems in the U.S. (except Alaska & Hawaii) and Canada. The source of pipeline mileage data is the Pipeline and Hazardous Material Safety Administration (PHMSA). The source of liquid capacity data is the Association of Oil Pipe Lines (AOPL).

Crude oil pipelines:

  • 73,300 miles of interstate and intrastate pipelines in 2015 (PHMSA)
  • Delivered 9.3 billion barrels (bbl) of crude oil nationwide in 2014 (AOPL)

Crude oil pipelines

Petroleum product pipelines:

  • 62,588 miles of interstate and intrastate pipelines in 2015 (PHMSA)
  • The petroleum product pipelines and the HGL pipelines together delivered 6.9 billion barrels (bbl) of products nationwide in 2014 (AOPL).

Petroleum product pipeline 

HGL (natural gas liquids) pipelines: 

  • 67,577 miles of interstate and intrastate pipelines in 2015 (PHMSA)

 HLG pipeline

Natural gas pipelines:

  • 2,509,000 total miles of natural gas pipelines in 2015 (PHMSA)
    • 301,242 miles of interstate and intrastate transmission pipelines
    • 1.28 million miles of gas distribution main lines (smaller than the transmission pipelines)
    • 913,085 miles of gas distribution service lines
    • 17,727 miles of gathering mains that collect gas from wells and move it through a series of compression stages to the main transmission pipelines
  • Natural gas transmission pipeline capacity was approximately 443 billion cubic feet per day in 2011 (QER 1.1)

Natural gas pipelines

All of the above maps combined, including international border crossings:

Combined map

The high density of pipeline systems in many parts of the nation is evident in the last map. On the EIA’s U.S. Energy Mapping System website, you can recreate and explore any of the above maps.

Pipeline safety

The Department of Transportation’s (DOT) Pipeline and Hazardous Material Safety Administration (PHMSA), acting through the Office of Pipeline Safety (OPS), administers the DOT national regulatory program to assure the safe transportation of natural gas, petroleum, and other hazardous materials by pipeline.

PHMSA has collected pipeline incident reports since 1970. PHMSA defines “significant incidents” as any of the following conditions that originate within the pipeline system (but not initiated by a nearby external event that affects the pipeline system).

  • Fatality or injury requiring in-patient hospitalization
  • $50,000 or more in total costs, measured in 1984 dollars
  • Highly volatile liquid releases of 5 barrels (210 gallons) or more, or other liquid releases of 50 barrels (2,100 gallons) or more
  • Liquid releases resulting in an unintentional fire or explosion

PHMSA data are available at the following link:

http://www.phmsa.dot.gov/pipeline/library/data-stats

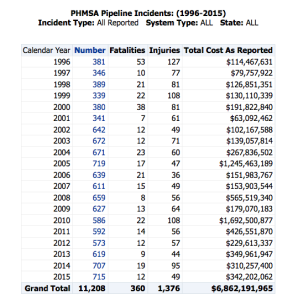
A summary of all reported pipeline incidents over the past 20 years is presented in the following PHMSA table.
PHMSA significant events table

The 20-year averages (1996 – 2015) are:

  • Incidents: 560
  • Fatalities: 18
  • Injuries: 69
  • Total cost: $343,109,598

The latest data for 2016 (possibly not final) are:

  • Incidents: 620
  • Fatalities: 17
  • Injuries: 82
  • Total cost: $275,341,057

Clearly, the oil and gas pipeline business is quite hazardous, and the economic cost of pipeline incidents is very high, even in an average year. Since the mid-1990s, the number of incidents per year has almost doubled (367 average for 1996 – 2000 vs. 641 average for 2011 – 2015) as has the total cost per year ($128.4 million average for 1996 – 2000 vs. $331.6 million average for 2011 – 2015).

In June 2015, Jonathan Thompson posted the article, “Mapping 7 Million Gallons of Crude Oil Spills,” on the High Country News website, at the following link:

http://www.hcn.org/articles/spilling-oil-santa-barbara/print_view

In this article, High Country News mapped the last five years of PHMSA data, which included more than 1,000 crude oil pipeline leaks and ruptures. Key points made in the High Country News article are

  • Over the five-year period, 168,000 barrels (more than 7 million gallons) of crude oil were spilled as a result of reported incidents. That’s an average of about 1.4 million gallons (33,600 barrels) per year leaking or spilled from 73,300 miles of crude oil pipelines that delivered 3 billion barrels of oil annually in 2014. That annualized amount of leakage also is equivalent to the amount of oil carried in about 47 DOT-111 rail cars.
  • Commonly reported causes included poor material condition (corrosion, bad seals), weather (heavy rains, lightning), and human error (valves being left open, people puncturing pipelines while digging).
  • Many of the spills were small, releasing less than 10 barrels (420 gallons) of oil, but a few were much larger. For example, a 2013 lightning strike on a North Dakota pipeline caused a 20,000-barrel (840,000 gallon) leak.

Cleanup after these spills and leaks is included in the PHMSA total cost data.

Aging infrastructure

Is August 2014, Jordan Wirfs-Brock posted the article, “Half Century Old Pipelines Carry Oil and Gas Load,” on the Inside Energy (IE) website at the following link:

http://insideenergy.org/2014/08/01/half-century-old-pipelines-carry-oil-and-gas-load/

Using PHMSA data, the author mapped the age of the U.S. pipeline infrastructure and determined that, “About forty-five percent of U.S. crude oil pipeline is more than fifty years old.” The following chart shows the age distribution of U.S. crude oil pipelines.

Crude pipeline age

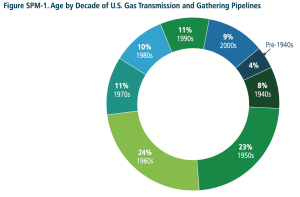
In April 2015 Administration issued the First Installment of the Quadrennial Energy Review (QER 1.1). This report included the following chart showing the age distribution of U.S. natural gas transmission and gathering pipelines. It looks like more than 50% of these natural gas pipelines are more than 50 years old.
Gas pipeline age

Source: QER 1.1 Summary

The high percentage of older pipeline systems places the overall integrity, reliability and safety of the critical national pipeline infrastructure at risk.

Pipeline modernization

In a previous post, I described the Quadrennial Energy Review (QER) initiated by the Obama Administration in January 2014. The first QER report, QER 1.1, released in April 2015, provides a good overview of issues related to oil and gas pipeline system risks and opportunities to modernize this critical infrastructure.

One positive step was taken on 16 April 2015 by the Federal Energy Regulatory Commission (FERC) when it announced a new policy, Cost Recovery Mechanisms for Modernization of Natural Gas Facilities. This policy sets conditions for interstate natural gas pipeline operators to recover certain safety, environmental, or reliability capital expenditures made to modernize pipeline system infrastructure.

Given the scale of the national oil and gas pipeline infrastructure, and the age of significant portions of that infrastructure, it will take decades of investment to implement system-wide modernization. The political climate, economic climate, and maybe the stars need to be in alignment for this enormous, long-term modernization effort to deliver the needed results.

Quadrennial Energy Review

Peter Lobner

On 9 January 2014 the Administration launched a “Quadrennial Energy Review” (QER) to examine “how to modernize the Nation’s energy infrastructure to promote economic competitiveness, energy security, and environmental responsibility…” You can read the Presidential Memorandum establishing the QER at the following link:

https://www.whitehouse.gov/the-press-office/2014/01/09/presidential-memorandum-establishing-quadrennial-energy-review

You can get a good overview of the goals of the QER in a brief factsheet at the following link:

https://www.whitehouse.gov/the-press-office/2015/04/21/fact-sheet-administration-announces-new-agenda-modernize-energy-infrastr

On April 21, 2015, the QER Task Force released the “first installment” of the QER report entitled “Energy Transmission, Storage, and Distribution Infrastructure.” The Task Force announcement stated:

“The first installment (QER 1.1) examines how to modernize our Nation’s energy infrastructure to promote economic competitiveness, energy security, and environmental responsibility, and is focused on energy transmission, storage, and distribution (TS&D), the networks of pipelines, wires, storage, waterways, railroads, and other facilities that form the backbone of our energy system.”

The complete QER 1.1 report or individual chapters are available at the following link:

https://energy.gov/epsa/quadrennial-energy-review-first-installment

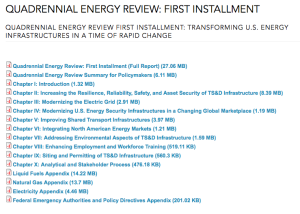
QER 1.1 contents are listed below:

QER 1.1 contentOn January 6, 2017, the QER Task Force released the “second installment” of the QER report entitled “Transforming the Nation’s Electricity System.” The Task Force announcement stated:

“The second installment (QER 1.2) finds the electricity system is a critical and essential national asset, and it is a strategic imperative to protect and enhance the value of the electricity system through modernization and transformation. QER 1.2 analyzes trends and issues confronting the Nation’s electricity sector out to 2040, examining the entire electricity system from generation to end use, and within the context of three overarching national goals: (1) enhance economic competitiveness; (2) promote environmental responsibility; and (3) provide for the Nation’s security.

The report provides 76 recommendations that seek to enable the modernization and transformation of the electricity system. Undertaken in conjunction with state and local governments, policymakers, industry, and other stakeholders, the recommendations provide the building blocks for longer-term, planned changes and activities.”

The complete QER 1.2 report or individual chapters are available at the following link:

https://energy.gov/epsa/quadrennial-energy-review-second-installment

QER 1.2 contents are listed below:

QER 1.2 contentI hope you take time to explore the QERs. I think the Task Force has collected a great deal of actionable information in the two reports. Converting this information into concrete actions will be a matter for the next Administration.
NuScale Submits First Ever Design Certification Application (DCA) for a Small Modular Reactor (SMR)

Peter Lobner

For all the talk about SMRs over the past two decades or more, there have been no SMR license applications submitted to the U.S. Nuclear Regulatory Commission (NRC) until now. On 31 December 2016, NuScale Power, Portland, OR made the first ever request to the NRC to initiate a licensing review of an SMR. On 12 January 2017, NuScale made the formal submittal to NRC of all the required DCA documents for an SMR power plant comprised of 12 individual NuScale Power ModulesTM.

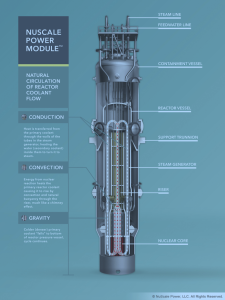
An NPM is a small pressurized water reactor (PWR) with an integrated primary system and many passive features for normal modes of operation and for safe shutdown in response to abnormal or accident conditions. NuScale claims that the passive safety features enable shutdown and self-cooling with no operator action, no AC or DC power, and no external water.

You’ll find a good 2013 overview of the NuScale Power ModuleTM on the IAEA’s (International Atomic Energy Agency’s) ARIS (Advanced Reactor Information System) website at the following link:

https://aris.iaea.org/sites/..%5CPDF%5CNuScale.pdf

More information is available on the NuScale Power website at the following link:

http://www.nuscalepower.com

The basic, factory-manufactured NPM is rated at 160 MWt, which could deliver about 45 MWe. A power plant with 12 NPMs would have a combined output of 1,920 MWt and about 540 MWe. A single NPM is shown below.

NuScale moduleSource: NuScale Power

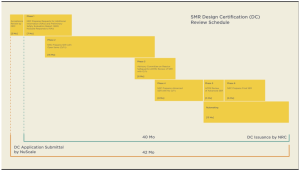
NuScale Power anticipates a 42-month licensing process as outlined in the following chart. If this schedule can be achieved, then the NRC could issue a Design Certification (DC) as soon as July 2020. At that time, the standard design of a modular NuScale power plant with up to 12 NPMs will have NRC approval independent of an application to construct or operate a specific plant. A design certification is valid for 15 years from the date of issuance and can be renewed.

NuScale licensing scheduleSource: NuScale Power

A license application for an actual plant will focus on site-specific issues and should not need to re-open issues already covered in the NRC’s DC review. This greatly de-risks construction of a new nuclear power plant based on the NPM standard design approved in the DC. NuScale forecasts that the first NPM could go into operation as soon as 2024.

Senator McCain’s White Paper Provides an Insightful Look at Current U.S. Force Readiness and Recommendations for Rebuilding

Peter Lobner

On 18 January 2017, Senator John McCain, Chairman, Senate Armed Services Committee (SASC), issued a white paper entitled, “Restoring American Power,” laying out SASC’s defense budget recommendations for the next five years; FY 2018 – 2022.

SASC white paper  Source: SASC

You can download this white paper at the following link:

http://www.mccain.senate.gov/public/_cache/files/25bff0ec-481e-466a-843f-68ba5619e6d8/restoring-american-power-7.pdf

The white paper starts by describing how the Budget Control Act of 2011 failed to meet its intended goal (reducing the national debt) and led to a long series of budget compromises between Congress and Department of Defense (DoD). These budget compromises, coupled with other factors (i.e., sustained military engagements in the Middle East), have significantly reduced the capacity and readiness of all four branches of the U.S. military. From this low point, the SASC white paper defines a roadmap for starting to rebuild a more balanced military.

If you have read my posts on the Navy’s Littoral Combat Ship (18 December 2016) and the Columbia Class SSBN (13 January 2017), then you should be familiar with issues related to two of the programs addressed in the SASC white paper.

For a detailed assessment of the white paper, see Jerry Hendrix’s post, “McCain’s Excellent White Paper: Smaller Carriers, High-Low Weapons Mix, Frigates and Cheap Fighters,” on the Breaking Defense website at the following link:

http://breakingdefense.com/2017/01/mccains-excellent-white-paper-smaller-carriers-high-low-weapons-mix-frigates-cheap-fighters/?utm_source=hs_email&utm_medium=email&utm_content=40837839&_hsenc=p2ANqtz-_SDDXYdgbQ2DPZpnkldur5pvqhppQ6EHccfzmiCqtrpPP0osIQ-rE0i5MEzoIucB8KviNiomciAykn8PnQ6AxRySecJQ&_hsmi=40837839

The Mysterious Case of the Vanishing Electronics, and More

Peter Lobner

Announced on 29 January 2013, DARPA is conducting an intriguing program known as VAPR:

“The Vanishing Programmable Resources (VAPR) program seeks electronic systems capable of physically disappearing in a controlled, triggerable manner. These transient electronics should have performance comparable to commercial-off-the-shelf electronics, but with limited device persistence that can be programmed, adjusted in real-time, triggered, and/or be sensitive to the deployment environment.

VAPR aims to enable transient electronics as a deployable technology. To achieve this goal, researchers are pursuing new concepts and capabilities to enable the materials, components, integration and manufacturing that could together realize this new class of electronics.”

VAPR has been referred to as “Snapchat for hardware”. There’s more information on the VAPR program on the DARPA website at the following link:

http://www.darpa.mil/program/vanishing-programmable-resources

Here are a few of the announced results of the VAPR program.

Disintegrating electronics

In December 2013, DARPA awarded a $2.5 million VAPR contract to the Honeywell Aerospace Microelectronics & Precision Sensors segment in Plymouth, MN for transient electronics.

In February 2014, IBM was awarded a $3.4 million VAPR contract to develop a radio-frequency based trigger to shatter a thin glass coating: “IBM plans is to utilize the property of strained glass substrates to shatter as the driving force to reduce attached CMOS chips into …. powder.” Read more at the following link:

http://www.zdnet.com/article/ibm-lands-deal-to-make-darpas-self-destructing-vapr-ware/

Also in February 2014, DARPA awarded a $2.1 million VAPR contract to PARC, a Xerox company. In September 2015, PARC demonstrated an electronic chip built on “strained” Corning Gorilla Glass that will shatter within 10 seconds when remotely triggered. The “strained” glass is susceptible to heat. On command, a resistor heats the glass, causing it to shatter and destroy the embedded electronics. This transience technology is referred to as: Disintegration Upon Stress-release Trigger, or DUST. Read more on PARC’s demonstration and see a short video at the following link:

http://spectrum.ieee.org/tech-talk/computing/hardware/us-militarys-chip-self-destructs-on-command

Disintegrating power source

In December 2013, USA Today reported that DARPA awarded a $4.7 million VAPR contract to SRI International, “to develop a transient power supply that, when triggered, becomes unobservable to the human eye.” The power source is the SPECTRE (Stressed Pillar-Engineered CMOS Technology Readied for Evanescence) silicon-air battery. Details are at the following link:

http://www.usatoday.com/story/nation/2013/12/27/vanishing-silicon-air-battery-darpa/4222327/

On 12 August 2016, the website Science Friday reported that Iowa State scientists have successfully developed a transient lithium-ion battery:

“They’ve developed the first self-destructing, lithium-ion battery capable of delivering 2.5 volts—enough to power a desktop calculator for about 15 minutes. The battery’s polyvinyl alcohol-based polymer casing dissolves in 30 minutes when dropped in water, and its nanoparticles disperse. “

You can read the complete post at:

http://www.sciencefriday.com/segments/this-battery-will-self-destruct-in-30-minutes/

ICARUS (Inbound, Controlled, Air-Releasable, Unrecoverable Systems)

On 9 October 2015, DARPA issued “a call for disappearing delivery vehicles,” which you can read at the following link:

http://www.darpa.mil/news-events/2015-10-09

In this announcement DARPA stated:

“Our partners in the VAPR program are developing a lot of structurally sound transient materials whose mechanical properties have exceeded our expectations,” said VAPR and ICARUS program manager Troy Olsson. Among the most eye-widening of these ephemeral materials so far have been small polymer panels that sublimate directly from a solid phase to a gas phase, and electronics-bearing glass strips with high-stress inner anatomies that can be readily triggered to shatter into ultra-fine particles after use. A goal of the VAPR program is electronics made of materials that can be made to vanish if they get left behind after battle, to prevent their retrieval by adversaries.”

With the progress made in VAPR, it became plausible to imagine building larger, more robust structures using these materials for an even wider array of applications. And that led to the question, ‘What sorts of things would be even more useful if they disappeared right after we used them?’”

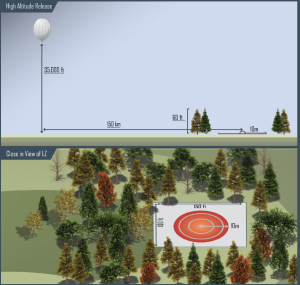
This is how DARPA conceived the ICARUS single-use drone program described in October 2015 in Broad Area Announcement DARPA-BAA-16-03. The goal of this $8 million, 26-month DARPA program is to develop small drones with the following attributes

  • One-way, autonomous mission
  • 3 meter (9.8 feet) maximum span
  • Disintegrate in 4-hours after payload delivery, or within 30 minutes of exposure to sunlight
  • Fly a lateral distance of 150 km (93 miles) when released from an altitude of 35,000 feet (6.6 miles)
  • Navigate to and deliver various payloads up to 3 pounds (1.36 kg) within 10 meters (31 feet) of a GPS-designated target

The ICARUS mission profile is shown below.

ICARUS mission profileICARUS mission. Source: DARPA-BAA-16-03

More information on ICARUS is available on the DARPA website at:

http://www.darpa.mil/program/inbound-controlled-air-reasonable-unrecoverable-systems

On 14 June 2016, Military & Aerospace reported that two ICARUS contracts had been awarded:

  • PARC (Palo Alto, CA): $2.3 million Phase 1 + $1.9 million Phase 2 option
  • DZYNE Technologies, Inc. (Fairfax, VA): $2.9 million Phase 1 + $3.2 million Phase 2 option

You can watch a short video describing the ICARUS competition at the following link:

https://www.youtube.com/watch?v=i2U1UTDqZbQ

The firm Otherlab (https://otherlab.com) has been involved with several DARPA projects in recent years. While I haven’t seen a DARPA announcement that Otherlab is a funded ICARUS contractor, a recent post by April Glaser on the recode website indicates that the Otherlab has developed a one-way, cardboard glider capable of delivering a small cargo to a precise target.

“When transporting vaccines or other medical supplies, the more you can pack onto the drone, the more relief you can supply,” said Star Simpson, an aeronautics research engineer at Otherlab, the group that’s building the new paper drone. If you don’t haul batteries for a return trip, you can pack more onto the drone, says Simpson.

The autonomous disposable paper drone flies like a glider, meaning it has no motor on board. It does have a small computer, as well as sensors that are programed to adjust the aircraft’s control surfaces, like on its wings or rudder, that determine where the aircraft will travel and land.”

 Otherlab_SkyMachines_APSARA.0Sky machines. Source: Otherworld

Read the complete post on the Otherlab glider on the recode website at the following link:

http://www.recode.net/2017/1/12/14245816/disposable-drones-paper-darpa-save-your-life-otherlab

The future

The general utility of vanishing electronics, power sources and delivery vehicles is clear in the context of military applications. It will be interesting to watch the future development and deployment of integrated systems using these vanishing resources.

The use of autonomous, air-releasable, one-way delivery vehicles (vanishing or not) also should have civilian applications for special situations such as emergency response in hazardous or inaccessible areas.

Columbia – The Future of the U.S. FBM Submarine Fleet

Peter Lobner

On 14 December, 2016, the Secretary of the Navy, Ray Mabus, announced that the new class of U.S. fleet ballistic missile (FBM) submarines will be known as the Columbia-class, named after the lead ship, USS Columbia, SSBN-826 and the District of Columbia. Formerly, this submarine class was known simply as the “Ohio Replacement Program”.

USS ColumbiaColumbia-class SSBN. Source: U.S. Navy

There will be 12 Columbia-class SSBNs replacing 14 Ohio-class SSBNs. The Navy has designated this as its top priority program. All of the Columbia-class SSBNs will be built at the General Dynamics Electric Boat shipyard in Groton, CT.

Background – Ohio-class SSBNs

Ohio-class SSBNs make up the current fleet of U.S. FBM submarines, all of which were delivered to the Navy between 1981 and 1997. Here are some key points on the Ohio-class SSBNs:

  • Electric Boat’s FY89 original contract for construction of the lead ship, USS Ohio, was for about $1.1 billion. In 1996, the Navy estimated that constructing the original fleet of 18 Ohio-class SSBNs and outfitting them with the Trident weapons system cost $34.8 billion. That’s an average cost of about $1.9 billion per sub.
  • On average, each SSBN spend 77 days at sea, followed by 35 days in-port for maintenance.
  • Each crew consists of about 155 sailors.
  • The Ohio-class SSBNs will reach the ends of their service lives at a rate of about one per year between 2029 and 2040.

The Ohio SSBN fleet currently is carrying about 50% of the total U.S. active inventory of strategic nuclear warheads on Trident II submarine launched ballistic missiles (SLBMs). In 2018, when the New START nuclear force reduction treaty is fully implemented, the Ohio SSBN fleet will be carrying approximately 70% of that active inventory, increasing the strategic importance of the U.S. SSBN fleet.

It is notable that the Trident II missile initial operating capability (IOC) occurred in March 1990. The Trident D5LE (life-extension) version is expected to remain in service until 2042.

Columbia basic design features

Features of the new Columbia-class SSBN include:

  • 42 year ship operational life
  • Life-of-the-ship reactor core (no refueling)
  • 16 missile tubes vs. 24 on the Ohio-class
  • 43’ (13.1 m) beam vs. 42’ (13 m) on the Ohio-class
  • 560’ (170.7 m) long, same as Ohio-class
  • Slightly higher displacement (likely > 20,000 tons) than the Ohio class
  • Electric drive vs. mechanical drive on the Ohio-class
  • X-stern planes vs. cruciform stern planes on the Ohio-class
  • Accommodations for 155 sailors, same as Ohio

Design collaboration with the UK

The U.S. Navy and the UK’s Royal Navy are collaborating on design features that will be common between the Columbia-class and the UK’s Dreadnought-class SSBNs (formerly named “Successor” class). These features include:

  • Common Missile Compartment (CMC)
  • Common SLBM fire control system

The CMC is being designed as a structural “quad-pack”, with integrated missile tubes and submarine hull section. Each tube measures 86” (2.18 m) in diameter and 36’ (10.97 m) in length and can accommodate a Trident II SLBM, which is the type currently deployed on both the U.S. and UK FBM submarine fleets. In October 2016, General Dynamics received a $101.3 million contract to build the first set of CMCs.

CMC 4-packCMC “quad-pack.” Source: General Dynamics via U.S. Navy

The “Submarine Shaftless Drive” (SDD) concept that the UK is believed to be planning for their Dreadnought SSBN has been examined by the U.S. Navy, but there is no information on the choice of propulsor for the Columbia-class SSBN.

Design & construction cost

In the early 2000s, the Navy kicked off their future SSBN program with a “Material Solution Analysis” phase that included defining initial capabilities and development strategies, analyzing alternatives, and preparing cost estimates. The “Milestone A” decision point reached in 2011 allowed the program to move into the “Technology Maturation & Risk Reduction” phase, which focused on refining capability definitions and developing various strategies and plans needed for later phases. Low-rate initial production and testing of certain subsystems also is permitted in this phase. Work in these two “pre-acquisition” phases is funded from the Navy’s research & development (R&D) budget.

On 4 January 2017, the Navy announced that the Columbia-class submarine program passed its “Milestone B” decision review. The Acquisition Decision Memorandum (ADM) was signed by the Navy’s acquisition chief Frank Kendall. This means that the program legally can move into the Engineering & Manufacturing Development Phase, which is the first of two systems acquisition phases funded from the Navy’s shipbuilding budget. Detailed design is performed in this phase. In parallel, certain continuing technology development / risk reduction tasks are funded from the Navy’s R&D budget.

The Navy’s proposed FY2017 budget for the Columbia SSBN program includes $773.1 million in the shipbuilding budget for the first boat in the class, and $1,091.1 million in the R&D budget.

The total budget for the Columbia SSBN program is a bit elusive. In terms of 2010 dollars, the Navy had estimated that lead ship would cost $10.4 billion ($4.2 billion for detailed design and non-recurring engineering work, plus $6.2 billion for construction) and the 11 follow-on SSBNs will cost $5.2 billion each. Based on these cost estimates, construction of the new fleet of 12 SSBNs would cost $67.6 billion in 2010 dollars. Frank Kendall’s ADM provided a cost estimate in terms of 2017 dollars in which the detailed design and non-recurring engineering work was amortized across the fleet of 12 SSBNs. In this case, the “Average Procurement Unit Cost” was $8 billion per SSBN. The total program cost is expected to be about $100 billion in 2017 dollars for a fleet of 12 SSBNs. There’s quite a bit if inflation between the 2010 estimate and new 2017 estimate, and that doesn’t account for future inflation during the planned construction program that won’t start until 2021 and is expected to continue at a rate of one SSBN authorized per year.

The UK is contributing financially to common portions of the Columbia SSBN program.  I have not yet found a source for details on the UK’s contributions and how they add to the estimate for total program cost.

Operation & support (O&S) cost

The estimated average O&S cost target of each Columbia-class SSBN is $110 million per year in constant FY2010 dollars. For the fleet of 12 SSBNs, that puts the annual total O&S cost at $1.32 billion in constant FY2010 dollars.

Columbia schedule

An updated schedule for Columbia-class SSBN program was not included in the recent Navy announcements. Previously, the Navy identified the following milestones for the lead ship:

  • FY2017: Start advance procurement for lead ship
  • FY2021: Milestone C decision, which will enable the program to move into the Production and Deployment Phase and start construction of the lead ship
  • 2027: Deliver lead ship to the Navy
  • 2031: Lead ship ready to conduct 1st strategic deterrence patrol

Keeping the Columbia-class SSBN construction program on schedule is important to the nation’s, strategic deterrence capability. The first Ohio-class SSBNs are expected start retiring in 2029, two years before the first Columbia-class SSBN is delivered to the fleet. The net result of this poor timing will be a 6 – 7 year decline in the number of U.S. SSBNs from the current level of 14 SSBNs to 10 SSBNs in about 2032. The SSBN fleet will remain at this level for almost a decade while the last Ohio-class SSBNs are retiring and are being replaced one-for-one by new Columbia-class SSBNs. Finally, the U.S. SSBN fleet will reach its authorized level of 12 Columbia-class SSBNs in about 2042. This is about the same time when the Trident D5LE SLBMs arming the entire Columbia-class fleet will need to be replaced by a modern SLBM.

You can see the fleet size projections for all classes of Navy submarines in the following chart. The SSBN fleet is represented by the middle trend line.

Submarines-30-year-plan-2017 copy 2 Source: U.S. Navy 30-year Submarine Shipbuilding Plan 2017

Based on the Navy’s recent poor performance in other major new shipbuilding programs (Ford-class aircraft carrier, Nimitz-class destroyer, Littoral Combat Ship), their ability to meet the projected delivery schedule for the Columbia-class SSBN’s must be regarded with some skepticism. However, the Navy’s Virginia-class attack submarine (SSN) construction program has been performing very well, with some new SSNs being delivered ahead of schedule and below budget. Hopefully, the submarine community can maintain the good record of the Virginia-class SSNs program and deliver a similarly successful, on-time Columbia-class SSBN program.

Additional resources:

For more information, refer to the 25 October 2016 report by the Congressional Research Service, “Navy Columbia Class (Ohio Replacement) Ballistic Missile Submarine (SSBN[X]) Program: Background and Issues for Congress,” which you can download at the following link:

https://fas.org/sgp/crs/weapons/R41129.pdf

You can read the Navy’s, “Report to Congress on the Annual Long-Range Plan for Construction of Naval Vessels for Fiscal Year 2017,” at the following link:

https://news.usni.org/2016/07/12/20627