International Energy Agency (IEA) Assesses World Energy Trends

Peter Lobner

The IEA issued two important reports in late 2016, brief overviews of which are provided below.

World Energy Investment 2016 (WEI-2016)

In September 2016, the IEA issued their report, “World Energy Investment 2016,” which, they state, is intended to addresses the following key questions:

  • What was the level of investment in the global energy system in 2015? Which countries attracted the most capital?
  • What fuels and technologies received the most investment and which saw the biggest changes?
  • How is the low fuel price environment affecting spending in upstream oil and gas, renewables and energy efficiency? What does this mean for energy security?
  • Are current investment trends consistent with the transition to a low-carbon energy system?
  • How are technological progress, new business models and key policy drivers such as the Paris Climate Agreement reshaping investment?

The following IEA graphic summarizes key findings in WEI-2016 (click on the graphic to enlarge):

WEI-2016

You can download the Executive Summary of WEI-2016 at the following link:

https://www.iea.org/newsroom/news/2016/september/world-energy-investment-2016.html

At this link, you also can order an individual copy of the complete report for a price (between €80 – €120).

You also can download a slide presentation on WEI 2016 at the following link:

https://csis-prod.s3.amazonaws.com/s3fs-public/event/161025_Laszlo_Varro_Investment_Slides_0.pdf

World Energy Outlook 2016 (WEO-2016)

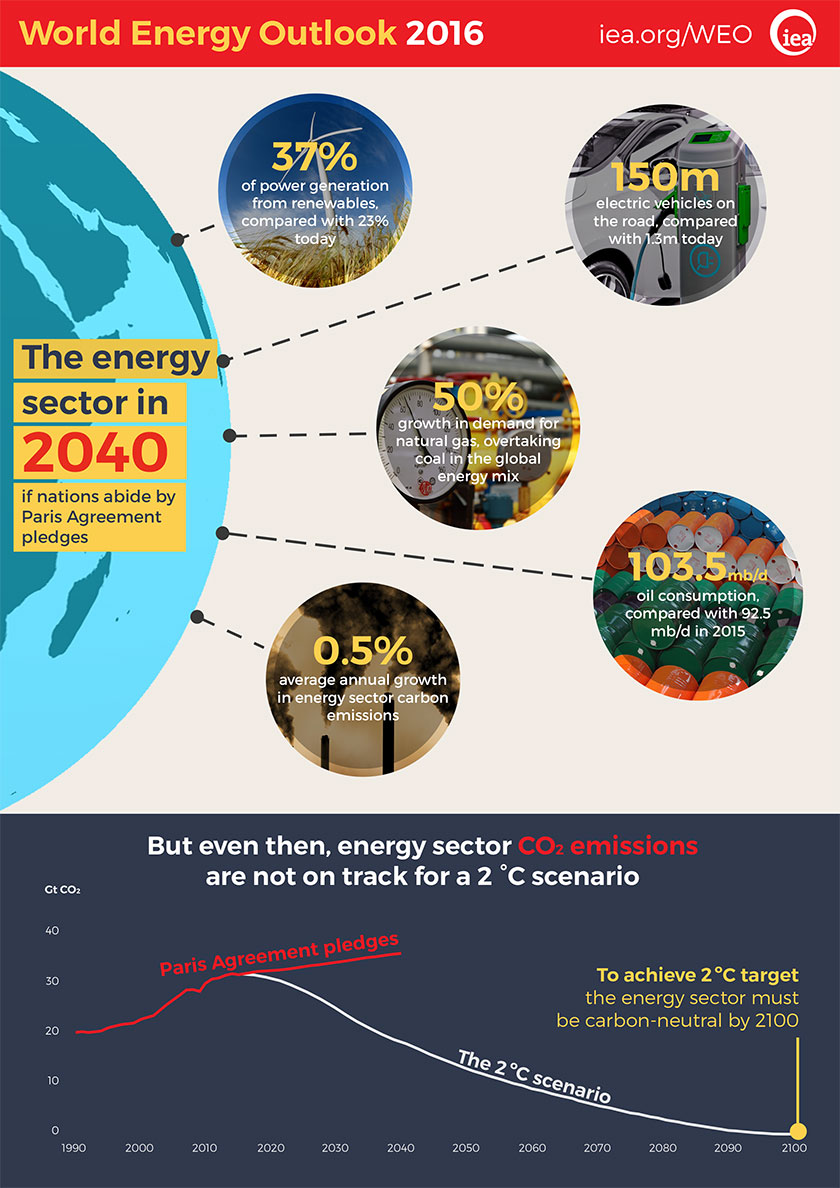
The IEA issued their report, “World Energy Outlook 2016,” in November 2016. The report addresses the expected transformation of the global energy mix through 2040 as nations attempt to meet national commitments made in the Paris Agreement on climate change, which entered into force on 4 November 2016.

You can download the Executive Summary of WEO-2016 at the following link:

https://www.iea.org/newsroom/news/2016/november/world-energy-outlook-2016.html

At this link, you also can order an individual copy of the complete report for a price (between €120 – €180).

The following IEA graphic summarizes key findings in WEO-2016 (click on the graphic to enlarge):

WEO-2016

Climate Change and Nuclear Power

Peter Lobner

In September 2016, the International Atomic Energy Agency (IAEA) published a report entitled, “Climate Change and Nuclear Power 2016.” As described by the IAEA:

“This publication provides a comprehensive review of the potential role of nuclear power in mitigating global climate change and its contribution to other economic, environmental and social sustainability challenges.”

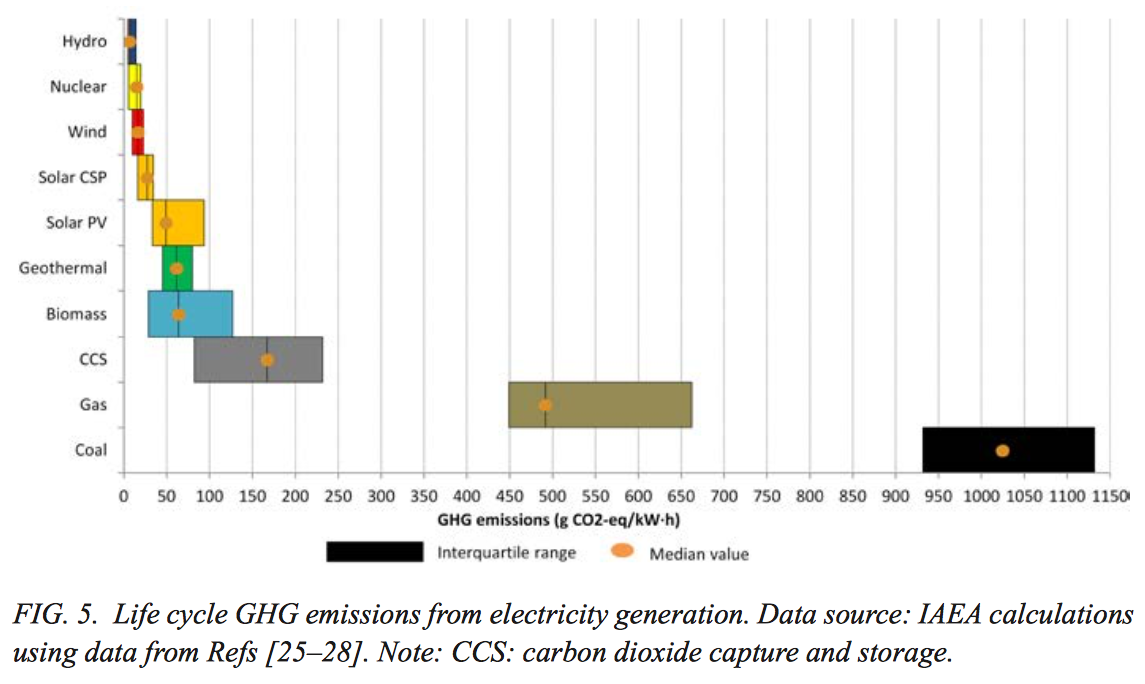
An important result documented in this report is a comparative analysis of the life cycle greenhouse gas (GHG) emissions for 10 electric power generating technologies. The IAEA authors note that:

“By comparing the GHG emissions of all existing and future energy technologies, this section (of the report) demonstrates that nuclear power provides energy services with very few GHG emissions and is justifiably considered a low carbon technology.

In order to make an adequate comparison, it is crucial to estimate and aggregate GHG emissions from all phases of the life cycle of each energy technology. Properly implemented life cycle assessments include upstream processes (extraction of construction materials, processing, manufacturing and power plant construction), operational processes (power plant operation and maintenance, fuel extraction, processing and transportation, and waste management), and downstream processes (dismantling structures, recycling reusable materials and waste disposal).”

The results of this comparative life cycle GHG analysis appear in Figure 5 of this report, which is reproduced below (click on the graphic to enlarge):

IAEA Climate Change & Nuclear Power

You can see that nuclear power has lower life cycle GHG emissions that all other generating technologies except hydro. It also is interesting to note how effective carbon dioxide capture and storage could be in reducing GHG emissions from fossil power plants.

You can download a pdf copy of this report for free on the IAEA website at the following link:

http://www-pub.iaea.org/books/iaeabooks/11090/Climate-Change-and-Nuclear-Power-2016

For a link to a similar 2015 report by The Brattle Group, see my post dated 8 July 2015, “New Report Quantifies the Value of Nuclear Power Plants to the U.S. Economy and Their Contribution to Limiting Greenhouse Gas (GHG) Emissions.”

It is noteworthy that the U.S. Environmental Protection Agency’s (EPA) Clean Power Plan (CPP), which was issued in 2015, fails to give appropriate credit to nuclear power as a clean power source. For more information on this matter see my post dated 2 July 2015,” EPA Clean Power Plan Proposed Rule Does Not Adequately Recognize the Role of Nuclear Power in Greenhouse Gas Reduction.”

In contrast to the EPA’s CPP, New York state has implemented a rational Clean Energy Standard (CES) that awards zero-emissions credits (ZEC) that favor all technologies that can meet specified emission standards. These credits are instrumental in restoring merchant nuclear power plants in New York to profitable operation and thereby minimizing the likelihood that the operating utilities will retire these nuclear plants early for financial reasons. For more on this subject, see my post dated 28 July 2016, “The Nuclear Renaissance is Over in the U.S.”  In that post, I noted that significant growth in the use of nuclear power will occur in Asia, with use in North America and Europe steady or declining as older nuclear power plants retire and fewer new nuclear plants are built to take their place.

An updated projection of worldwide use of nuclear power is available in the 2016 edition of the IAEA report, “Energy, Electricity and Nuclear Power Estimates for the Period up to 2050.” You can download a pdf copy of this report for free on the IAEA website at the following link:

http://www-pub.iaea.org/books/IAEABooks/11120/Energy-Electricity-and-Nuclear-Power-Estimates-for-the-Period-up-to-2050

Combining the information in the two IAEA reports described above, you can get a sense for what parts of the world will be making greater use of nuclear power as part of their strategies for reducing GHG emissions. It won’t be North America or Europe.

The World’s Best Cotton Candy

Peter Lobner

While there are earlier claims to various forms of spun sugar, Wikipedia reports that machine–spun cotton candy (then known as fairy floss) was invented in 1897 by confectioner John C. Wharton and dentist William Morrison. If you sense a possible conspiracy here, you may be right.  Cotton candy was first widely introduced at the 1904 St. Louis World Fair (aka the Louisiana Purchase Exposition).

As in modern cotton candy machines, the early machines were comprised of a centrifugal melter spinning in the center of a large catching bowl. The centrifugal melter produced the strands of cotton candy, which collected on the inside surface of the surrounding catching bowl. The machine operator then twirled a stick or paper cone around the catching bowl to create the cotton candy confection.

Basic cotton candySource: I, FocalPoint

Two early patents provide details on how a cotton candy machine works.

The first patent for a centrifugal melting device was filed on 11 October 1904 by Theodore Zoeller for the Electric Candy Machine Company. The patent, US816055 A, was published on 27 March 1906, and can be accessed at the following link:

https://www.google.com/patents/US816055

In his patent application, Zoeller discussed the problems with the then-current generation of cotton candy machines, which were,

“…objectionable in that the product is unreliable, being more often scorched than otherwise, such scorching of the product resulting from the continued application of the intense heat to a gradually-diminishing quantity of the molten sugar. Devices so heated are further objectionable in that all once melted (sugar) must be converted into filaments without allowing such molten sugar to cool and harden, as (it will later be) scorched in the reheating.”

Zoeller describes his centrifugal melting device as:

“….comprising a rotatable vessel having a circumferential discharge-passage, and an electrically-heated band in said passage…”

His novel feature involved moving the heater to the rim of the centrifugal melting device.

US816055-1 crop

A patent for an improved device was filed on 13 June 1906 by Ralph E. Pollock. This patent, US 847366A, was published on 19 March 1907, and can be accessed at the following link:

https://www.google.com/patents/US847366

This patent application provides a more complete description of the operation of the centrifugal melter for production of cotton candy:

“This invention relates to certain improvements in candy-spinning machines comprising, essentially, a rotary sugar-receptacle having a perforated peripheral band constituting an electric heater against which the sugar is centrifugally forced and through which the sugar emerges in the form of a line (of) delicate candy-wool to be used as a confection.

The essential object is to provide a simple, practical, and durable rotary receptacle with a comparatively large receiving chamber having a comparatively small annular space adjacent to the heater for the purpose of retarding the centrifugal action of the sugar through the heater sufficiently to cause the desired liquefaction of the sugar by said heater and to cause it to emerge in comparatively fine jets under high centrifugal pressure, thereby yielding an extremely fine continuous stream of candy-wool.”

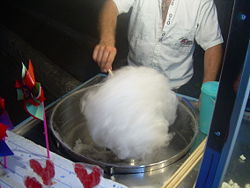
This is the same basic process used more than a century later to make cotton candy at carnivals and state fairs today. The main problem I have with cotton candy sold at these venues is that it often is pre-made and sold in plastic bags and looks about as appetizing as a small portion of fiberglass insulation. Even when you can get it made on the spot, the product usually is just a big wad of cotton candy on a stick, as in the photo above, which can be created in about 30 seconds.

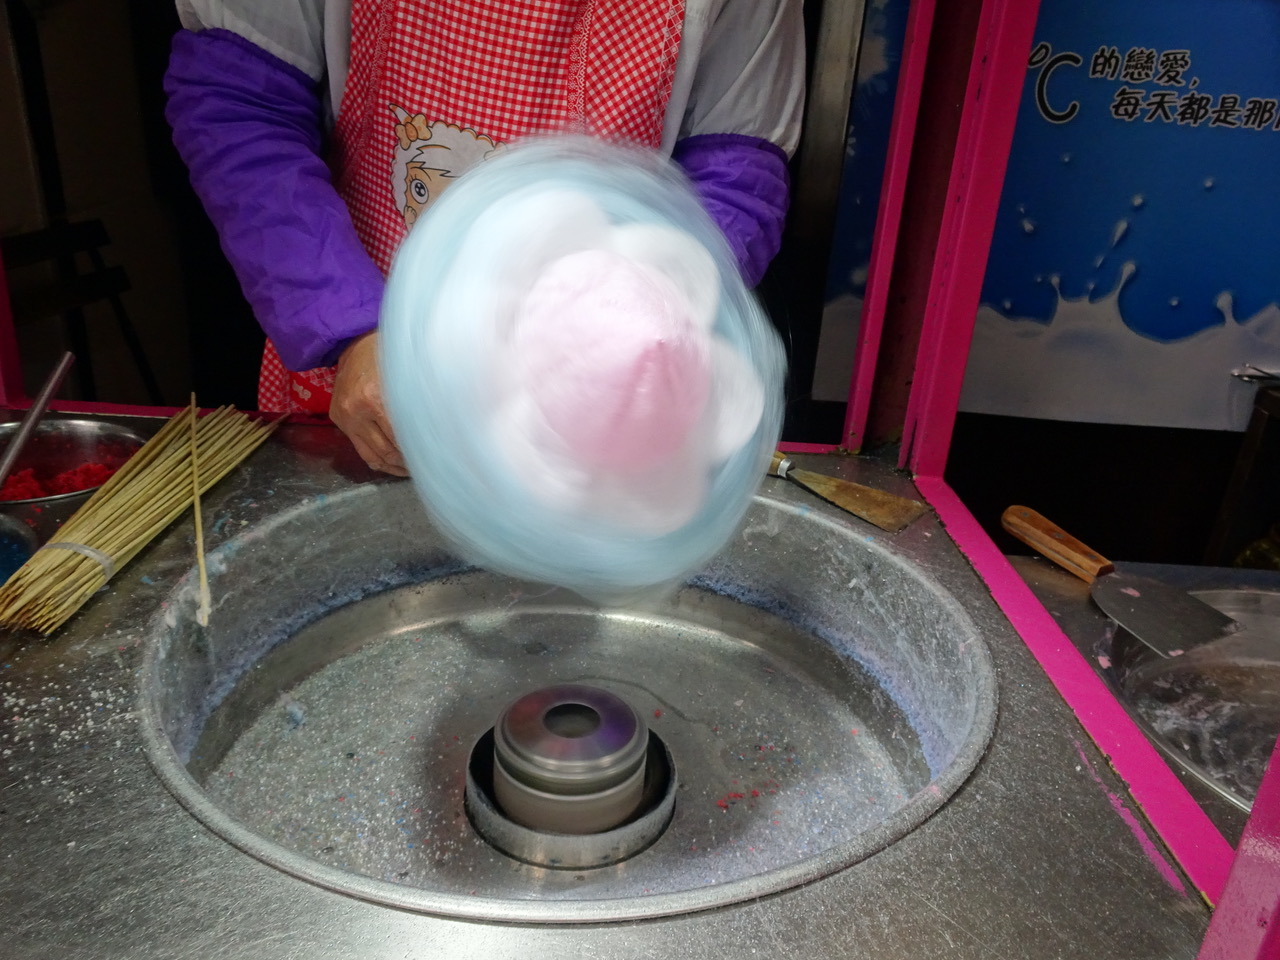
Let me introduce you to the best cotton candy in the world, which is made by a real artist at the Jinli market in Chengdu, China using the same basic cotton candy machine described above. As far as I can tell, the secret is working with small batches of pre-colored sugar and taking time to slowly build up the successive layers of what would become the very delicate, precisely shaped cotton candy flower shown below. This beautiful confection was well worth the wait, and, yes, it even tasted better than any cotton candy I’ve had previously.

Worlds best cotton candy 1Worlds best cotton candy 2Worlds best cotton candy 3Worlds best cotton candy 4

The PISA 2015 Report Provides an Insightful International Comparison of U.S. High School Student Performance

Peter Lobner

In early December 2016, the U.S. Department of Education and the Institute for Educational Sciences’ (IES) National Center for Educational Statistics (NCES) issued a report entitled, “Performance of U.S. 15-Year-Old Students in Science, Reading, and Mathematics Literacy in an International Context: First Look at PISA 2015.”

PISA 2015 First Look cover

The NCES describes PISA as follows:

“The Program for International Student Assessment (PISA) is a system of international assessments that allows countries to compare outcomes of learning as students near the end of compulsory schooling. PISA core assessments measure the performance of 15-year old students in science, reading and mathematics literacy every 3 years. Coordinated by the Organization for Economic Cooperation and Development (OECD), PISA was first implemented in 2000 in 32 countries. It has since grown to 73 educational systems in 2015. The United States has participated in every cycle of PISA since its inception in 2000. In 2015, Massachusetts, North Carolina and Puerto Rico also participated separately from the nation. Of these three, Massachusetts previously participated in PISA 2012.”

In each country, the schools participating in PISA are randomly selected, with a goal that the sample of student selected for the examination are representative of a broad range of backgrounds and abilities. About 540,000 students participated in PISA 2015, including about 5,700 students from U.S. public and private schools. All participants were rated on a 1,000 point scale.

The authors describe the contents of the PISA 2015 report as follows:

“ The report includes average scores in the three subject areas; score gaps across the three subject areas between the top (90th percentile) and low performing (10th percentile) students; the percentages of students reaching selected PISA proficiency levels; and trends in U.S. performance in the three subjects over time.”

You can download the report from the NCES website at the following link:

https://nces.ed.gov/pubsearch/pubsinfo.asp?pubid=2017048

In the three subject areas assessed by PISA 2015, key U.S. results include the following:

  • Math:
    • U.S. students ranked 40th (out of 73) in math
    • U.S. average score was 470, which is below the international average of 490
    • 29% of U.S. students did not meet the baseline proficiency for math
    • 6% of U.S. students scored in the highest proficiency range for math
    • U.S. average math scores have been declining over the last two PISA cycles since 2009
  • Science:
    • U.S. ranked 25th in science
    • U.S. average was 496, which is very close to the international average of 493
    • 20% of U.S. students did not meet the baseline proficiency for science
    • 9% of U.S. students scored in the highest proficiency range for science
    • U.S. average science scores have been flat over the last two PISA cycles since 2009
  • Reading:
    • U.S. ranked 24th in reading
    • U.S. average was 497, which is very close to the international average of 493
    • 19% of U.S. students did not meet the baseline proficiency for reading
    • 10% of U.S. students scored in the highest proficiency range for reading
    • U.S. average reading scores have been flat over the last two PISA cycles since 2009

In comparison, students in the small nation of Singapore were the top performers in all three subject areas, recording the following results in PISA 2015:

  • Math: 564
  • Science: 556
  • Reading: 535

Japan, South Korea, Canada, Germany, New Zealand, Australia, Hong Kong (China), Estonia, and Netherlands were among the countries that consistently beat the U.S. in all three subject areas.

China significantly beat the U.S. in math and science and was about the same in reading. Russia significantly beat the U.S. in math, but was a bit behind in science and reading.

Numerous articles have been written on the declining math performance and only average science and reading performance of the U.S. students that participated in PISA 2015. Representative articles include:

US News: 6 December 2016 article, “Internationally, U.S. Students are Failing”

http://www.usnews.com/news/politics/articles/2016-12-06/math-a-concern-for-us-teens-science-reading-flat-on-test

Washington Post: 6 December 2016, “On the World Stage, U.S. Students Fall Behind”

https://www.washingtonpost.com/local/education/on-the-world-stage-us-students-fall-behind/2016/12/05/610e1e10-b740-11e6-a677-b608fbb3aaf6_story.html?utm_term=.c33931c67010

I think the authors of these articles are correct and the U.S. educational system is failing to develop students in high school that, on average, will be able to compete effectively in a knowledge-based world economy with many of their international peers.

Click the link to the PISA 2015 report (above) and read about the international test results for yourself.

Visualize the Effects of a Nuclear Explosion in Your Neighborhood

Peter Lobner

The Restricted Data blog, run by Alex Wellerstein, is a very interesting website that focuses on nuclear weapons history and nuclear secrecy issues. Alex Wellerstein explains the origin of the blog:

“For me, ‘Restricted Data’ represents all of the historical strangeness of nuclear secrecy, where the shock of the bomb led scientists, policymakers, and military men to construct a baroque and often contradictory system of knowledge control in the (somewhat vain) hope that they could control the spread and use of nuclear technology.”

You can access the home page of this blog at the following link:

http://blog.nuclearsecrecy.com/about-the-blog/

From there, navigation to recent posts and blog categories is simple. Among the features of this blog is a visualization tool called NUKEMAP. With this visualization tool, you can examine the effects of a nuclear explosion on a target of your choice, with results presented on a Google map. The setup for an analysis is simple, requiring only the following basic parameters:

  • Target (move the marker on the Google map)
  • Yield (in kilotons)
  • Set for airburst or surface burst

You can select “other effects” if you wish to calculate casualties and/or display the fallout pattern. Advanced options let you set additional parameters, including details of an airburst.

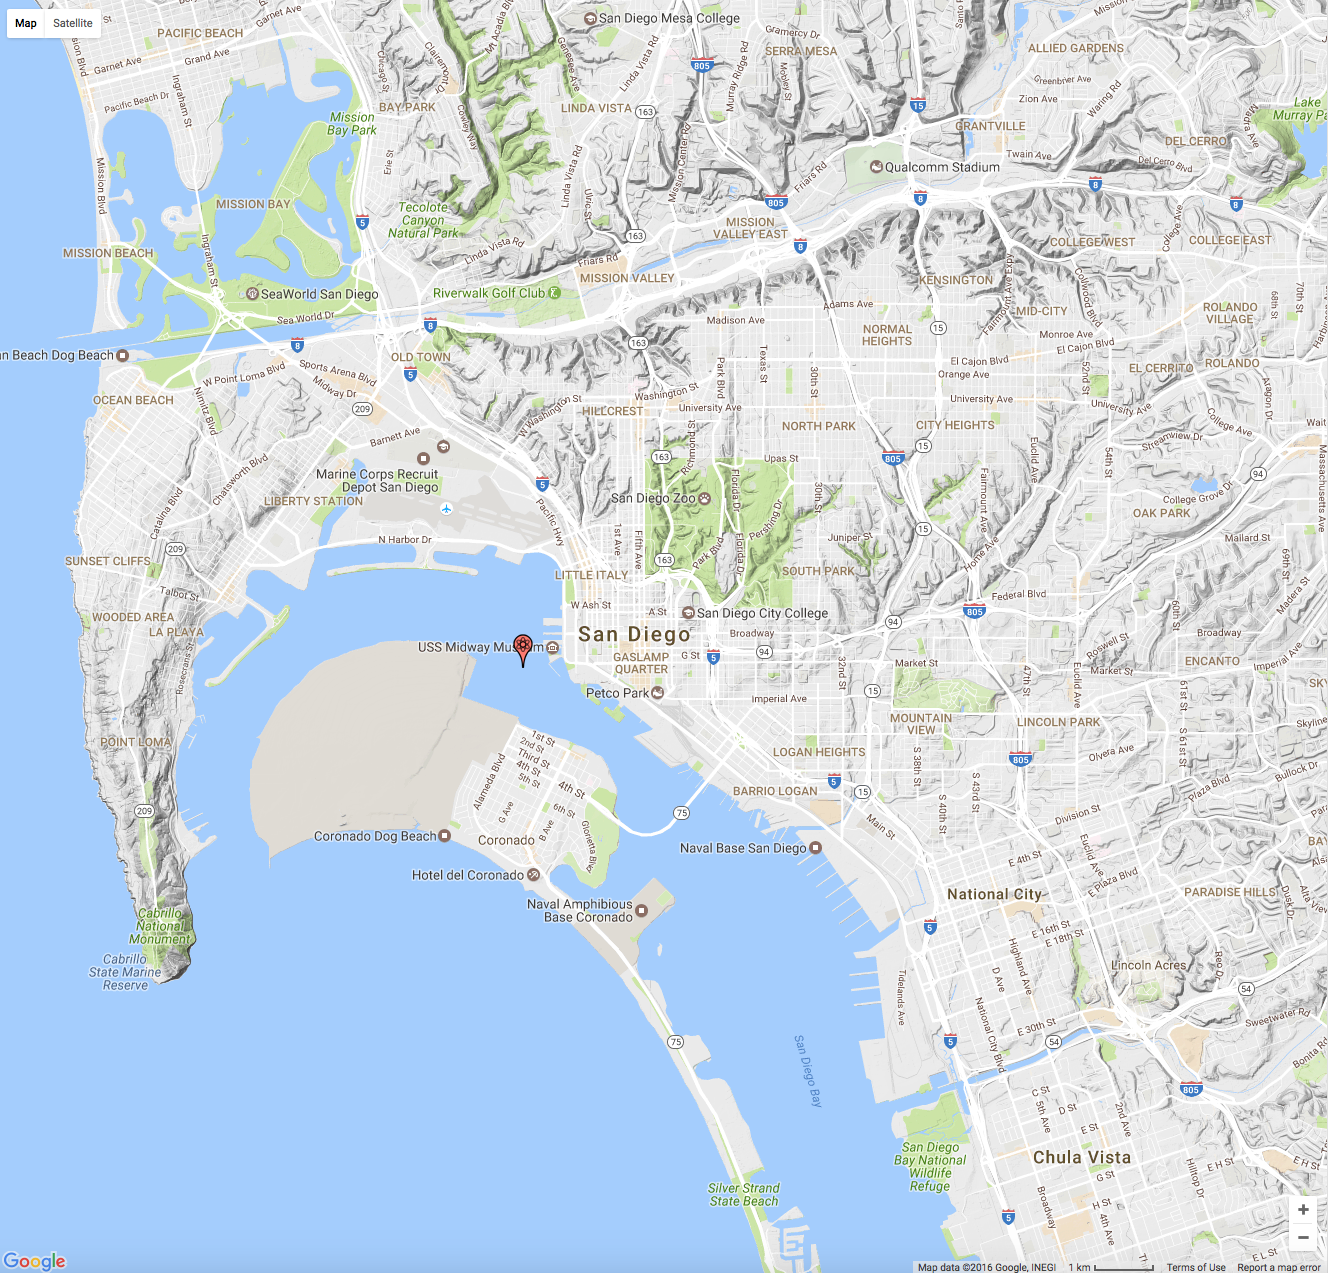
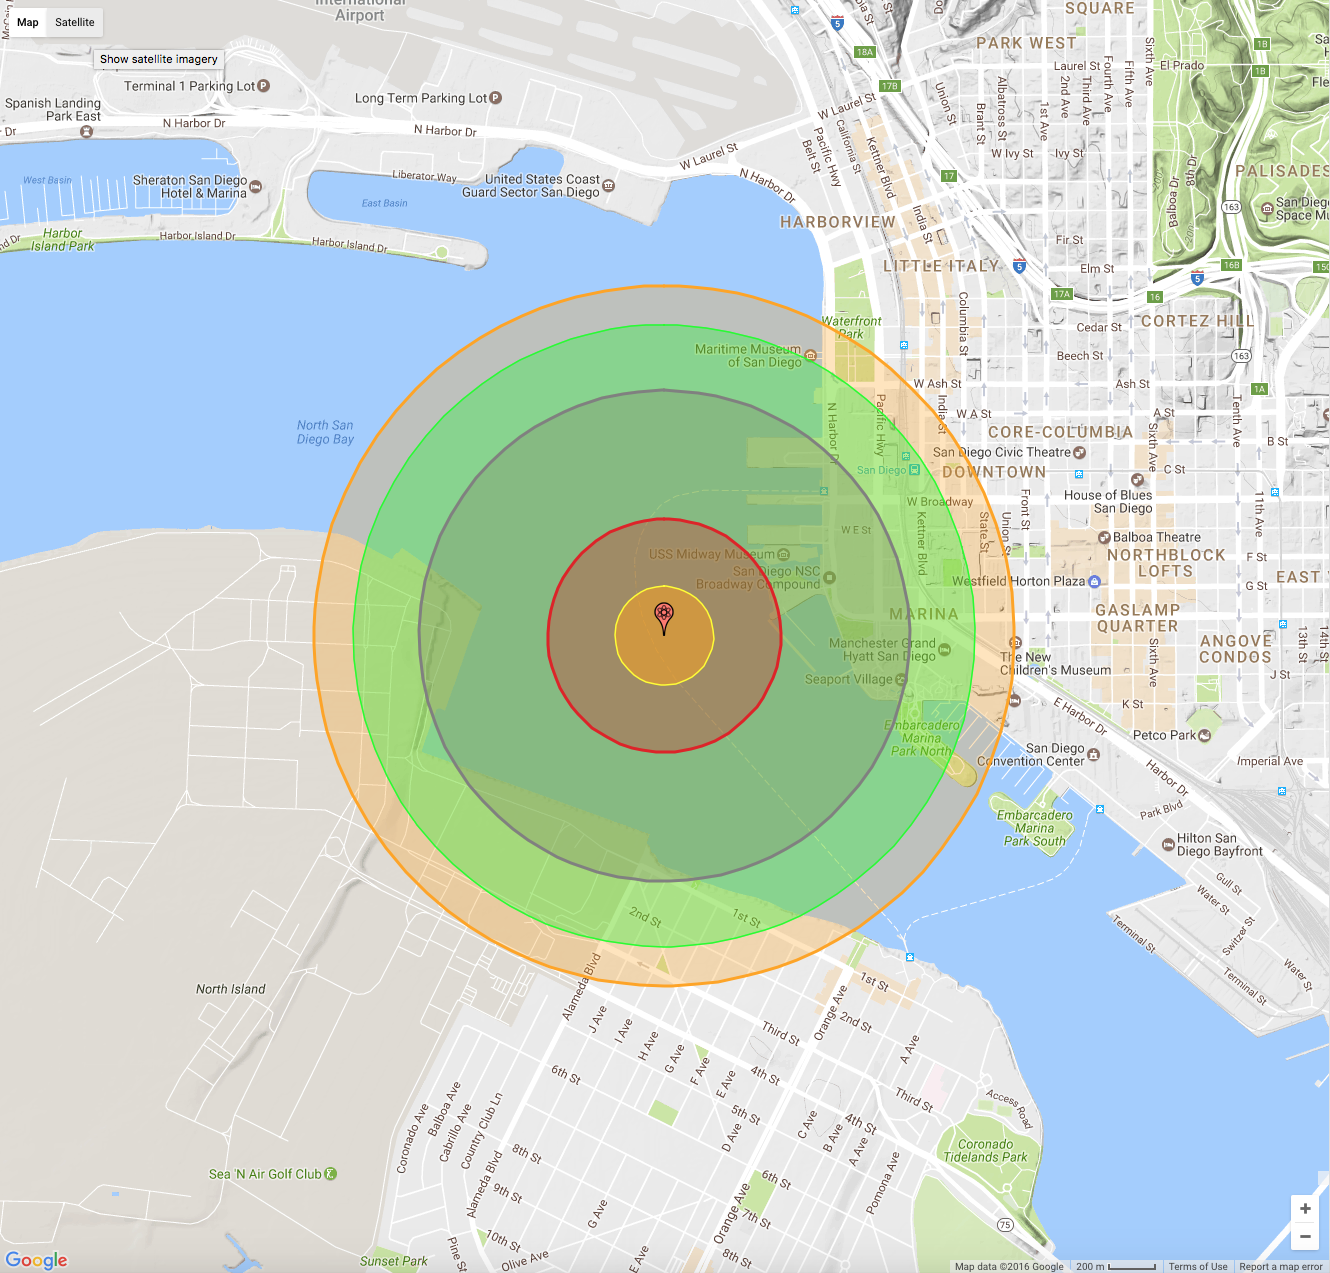
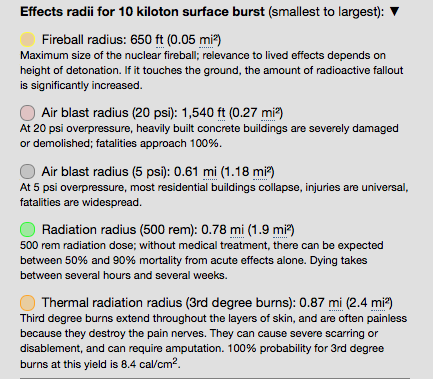
To illustrate the use of this visualization tool, consider the following scenario: A 10 kiloton nuclear device is being smuggled into the U.S. on a container ship and is detonated before docking in San Diego Bay. The problem setup and results are shown in the following screenshots from the NUKEMAP visualization tool.

NUKEMAP1NUKEMAP2NUKEMAP3

Among the “Advanced options” are selectable settings for the effects you want to display on the map. The effects radii increase considerably when you select lower effects limits.

So, there you have it. NUKEMAP is a sobering visualization tool for a world where the possibility of an isolated act of nuclear terrorism cannot be ruled out. If these results bother you, I suggest that you don’t re-do the analysis with military-scale (hundreds of kilotons to megatons) airburst warheads.

Current Status of the Fukushima Daiichi Nuclear Power Station (NPS)

Peter Lobner

Following a severe offshore earthquake on 11 March 2011 and subsequent massive tidal waves, the Fukushima Daiichi NPS and surrounding towns were severely damaged by these natural events. The extent of damage to the NPS, primarily from the effects of flooding by the tidal waves, resulted in severe fuel damage in the operating Units 1, 2 and 3, and hydrogen explosions in Units 1, 3 and 4. In response to the release of radioactive material from the NPS, the Japanese government ordered the local population to evacuate. You’ll find more details on the Fukushima Daiichi reactor accidents in my 18 January 2012 Lyncean presentation (Talk #69), which you can access at the following link:

https://lynceans.org/talk-69-11812/

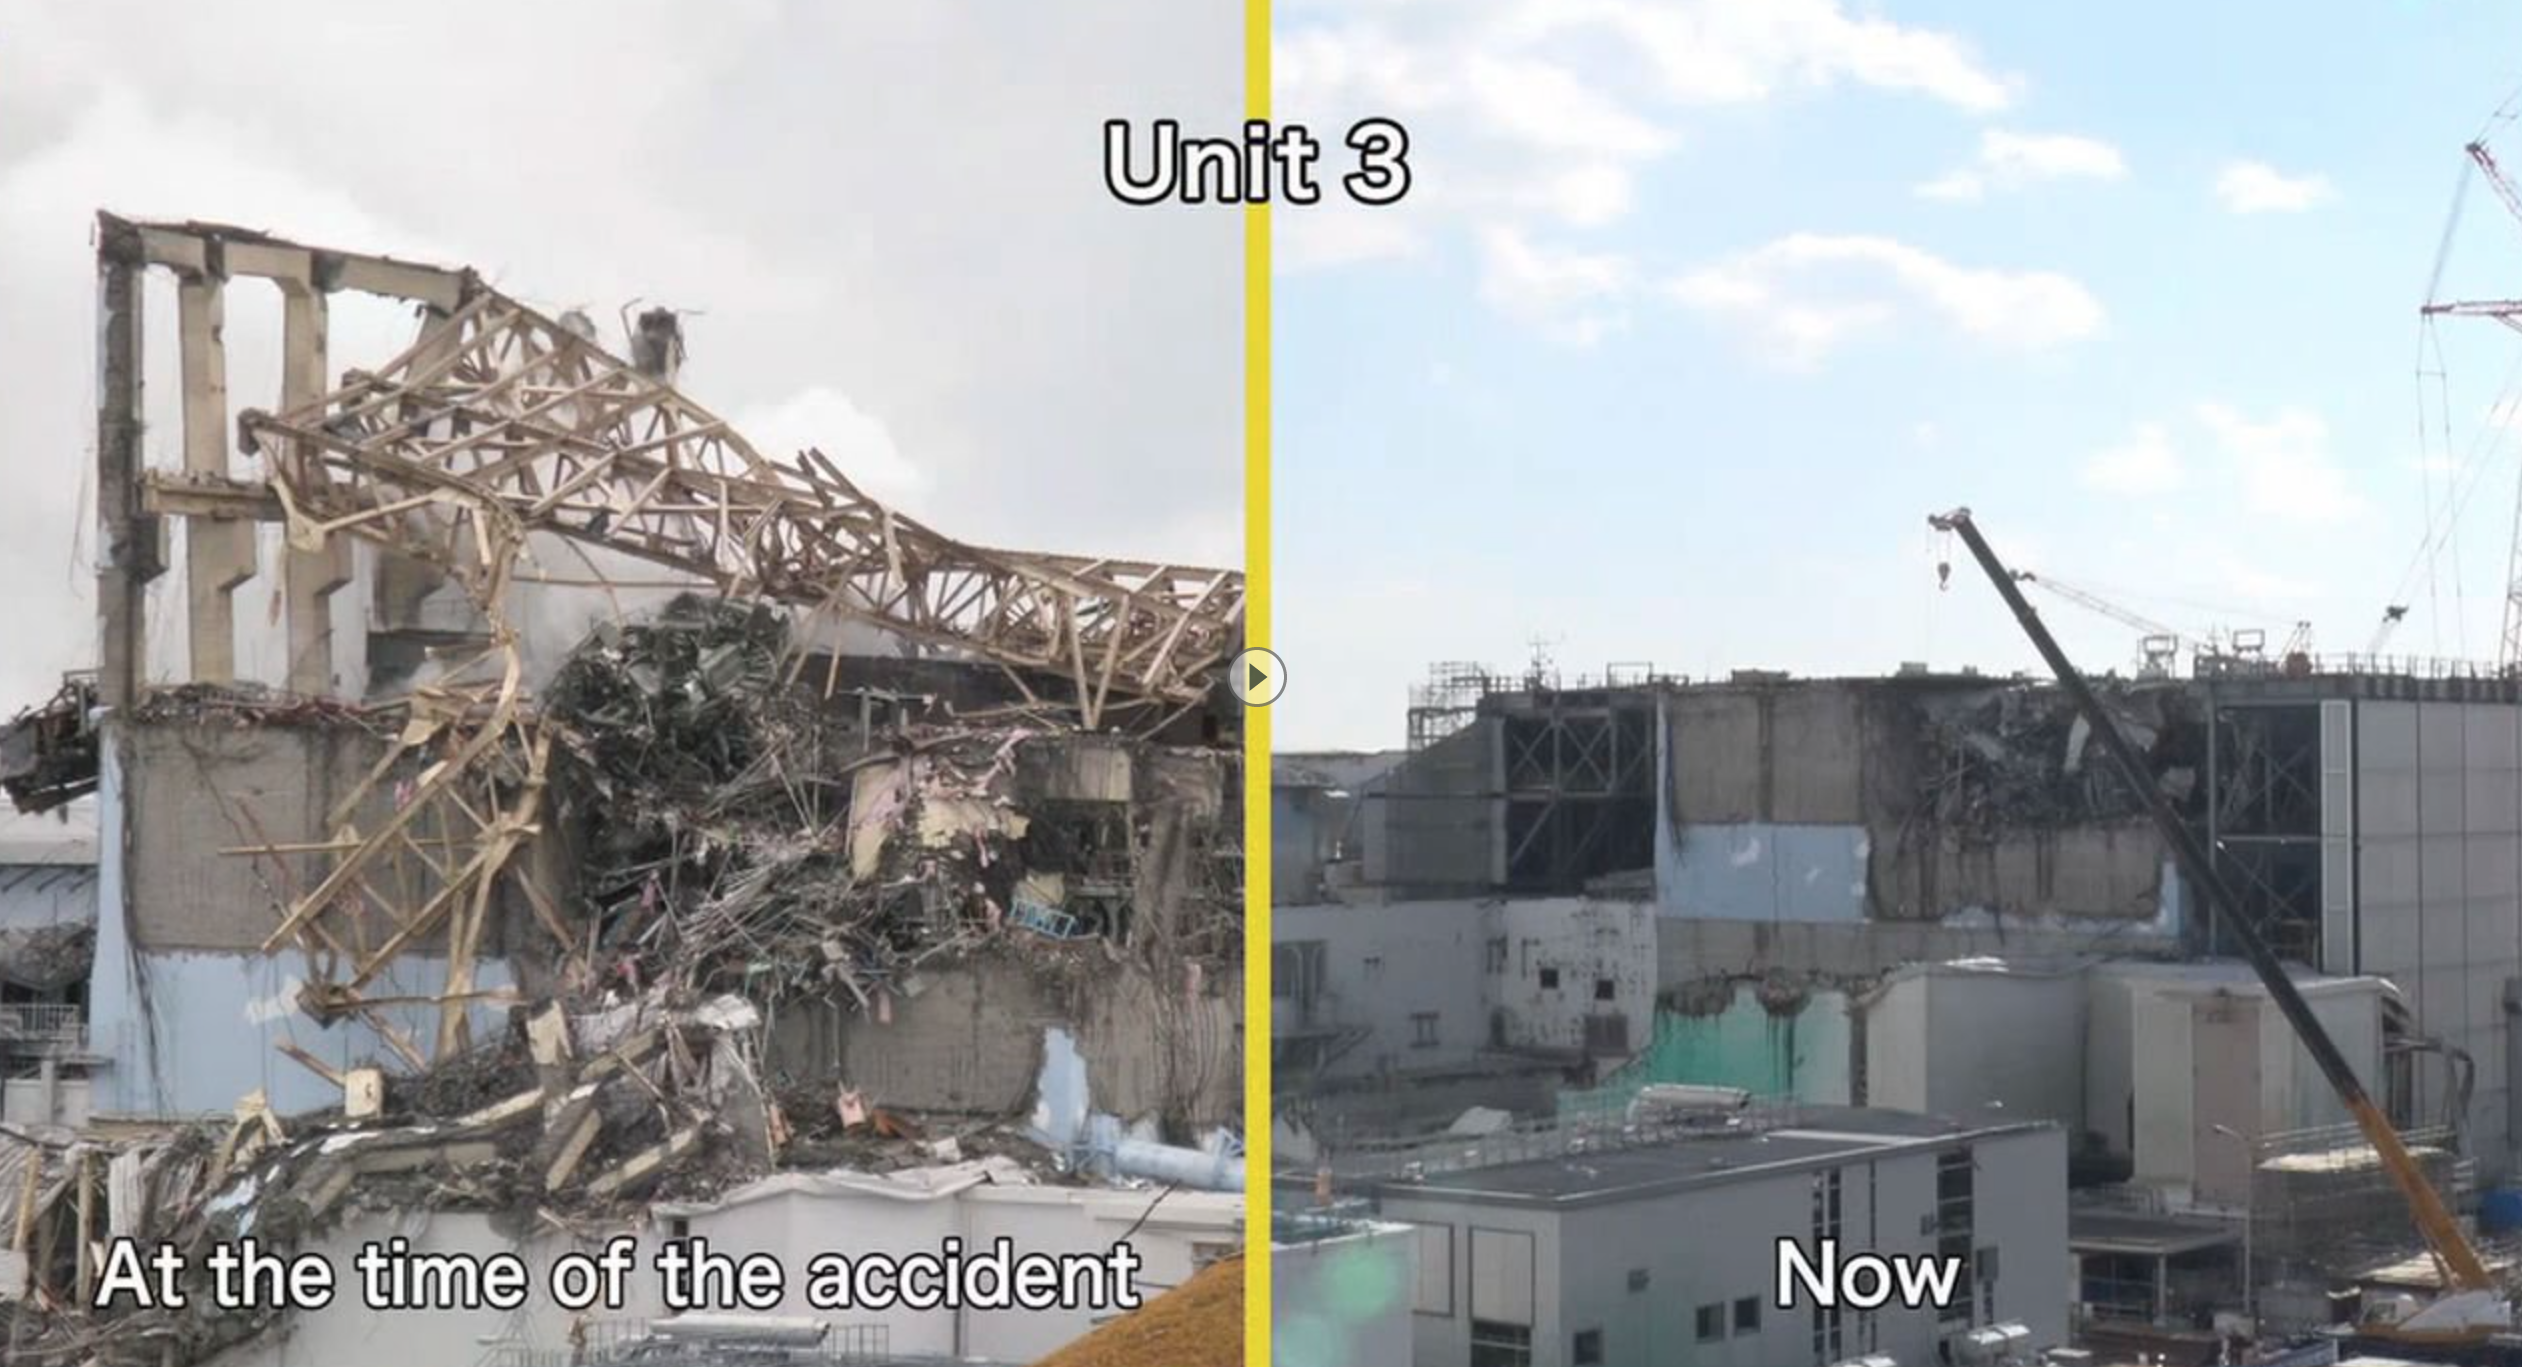
On 1 September 2016, Tokyo Electric Power Company Holdings, Inc. (TEPCO) issued a video update describing the current status of recovery and decommissioning efforts at the Fukushima Daiichi NPS, including several side-by-side views contrasting the immediate post-accident condition of a particular unit with its current condition. Following is one example showing Unit 3.

Fukushima Unit 3_TEPCO 1Sep16 video updateSource: TEPCO

You can watch this TEPCO video at the following link:

http://www.tepco.co.jp/en/news/library/archive-e.html?video_uuid=kc867112&catid=69631

This video is part of the TEPCO Photos and Videos Library, which includes several earlier videos on the Fukushima Daiichi NPS as well as videos on other nuclear plants owned and operated by TEPCO (Kashiwazaki-Kariwa and Fukushima Daini) and other TEPCO activities. TEPCO estimates that recovery and decommissioning activities at the Fukushima Daiichi NPS will continue for 30 – 40 years.

An excellent summary article by Will Davis, entitled, “TEPCO Updates on Fukushima Daiichi Conditions (with video),” was posted on 30 September 2016 on the ANS Nuclear Café website at the following link:

http://ansnuclearcafe.org/2016/09/30/tepco-updates-on-fukushima-daiichi-conditions-with-video/

For additional resources related to the Fukushima Daiichi accident, recovery efforts, and lessons learned, see my following posts on Pete’s Lynx:

  • 20 May 2016: Fukushima Daiichi Current Status and Lessons Learned
  • 22 May 2015: Reflections on the Fukushima Daiichi Nuclear Accident
  • 8 March 2015: Scientists Will Soon Use Natural Cosmic Radiation to Peer Inside Fukushima’s Mangled Reactor

Lidar Remote Sensing Helps Archaeologists Uncover Lost City and Temple Complexes in Cambodia

Peter Lobner

In Cambodia, remote sensing is proving to be of great value for looking beneath a thick jungle canopy and detecting signs of ancient civilizations, including temples and other structures, villages, roads, and hydraulic engineering systems for water management. Building on a long history of archaeological research in the region, the Cambodian Archaeological Lidar Initiative (CALI) has become a leader in applying lidar remote sensing technology for this purpose. You’ll find the CALI website at the following link:

http://angkorlidar.org

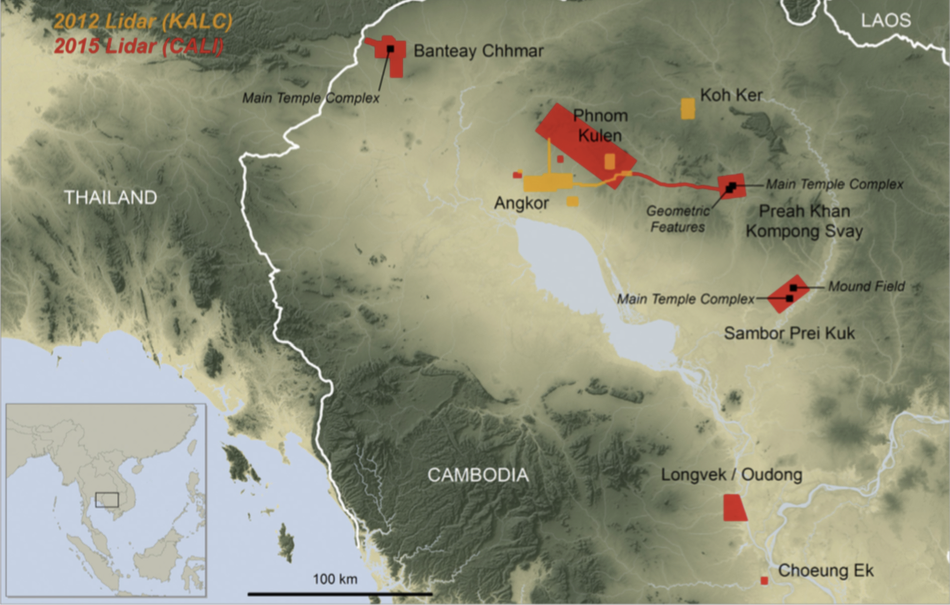
Areas in Cambodia surveyed using lidar in 2012 and 2015 are shown in the following map.

Angkor Wat and vicinity_CALISource: Cambodian Archaeological LIDAR Initiative (CALI)

CALI describes its objectives as follows:

“Using innovative airborne laser scanning (‘lidar’) technology, CALI will uncover, map and compare archaeological landscapes around all the major temple complexes of Cambodia, with a view to understanding what role these complex and vulnerable water management schemes played in the growth and decline of early civilizations in SE Asia. CALI will evaluate the hypothesis that the Khmer civilization, in a bid to overcome the inherent constraints of a monsoon environment, became locked into rigid and inflexible traditions of urban development and large-scale hydraulic engineering that constrained their ability to adapt to rapidly-changing social, political and environmental circumstances.”

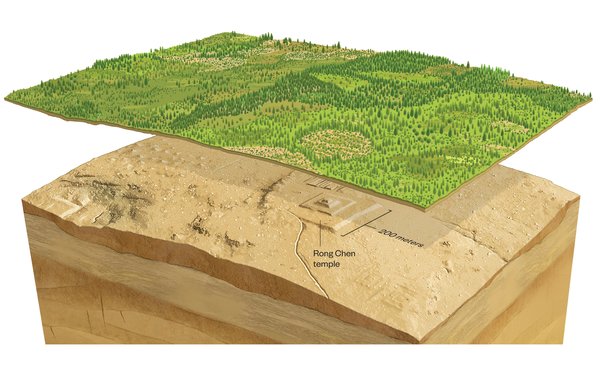
Lidar is a surveying technique that creates a 3-dimensional map of a surface by measuring the distance to a target by illuminating the target with laser light. A 3-D map is created by measuring the distances to a very large number of different targets and then processing the data to filter out unwanted reflections (i.e., reflections from vegetation) and build a “3-D point cloud” image of the surface. In essence, lidar removes the surface vegetation, as shown in the following figure, and produces a map with a much clearer view of surface features and topography than would be available from conventional photographic surveys.

Lidar sees thru vegetation_CALISource: Cambodian Archaeological LIDAR Initiative

CALI uses a Leica ALS70 lidar instrument. You’ll find the product specifications for the Leica ALS70 at the following link:

http://w3.leica-geosystems.com/downloads123/zz/airborne/ALS70/brochures/Leica_ALS70_6P_BRO_en.pdf

CALI conducts its surveys from a helicopter with GPS and additional avionics to help manage navigation on the survey flights and provide helicopter geospatial coordinates to the lidar. The helicopter also is equipped with downward-looking and forward-looking cameras to provide visual photographic references for the lidar maps.

Basic workflow in a lidar instrument is shown in the following diagram.

Lidar instrument workflow_Leica

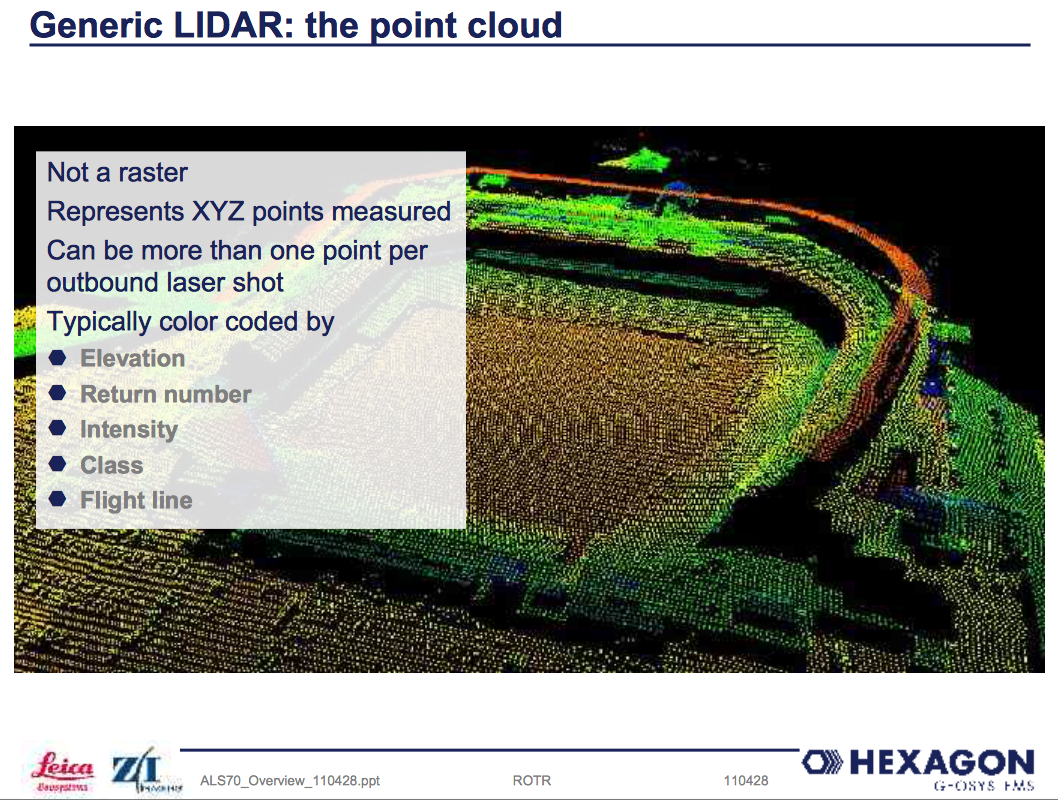
An example of the resulting point cloud image produced by a lidar is shown below.

Example lidar point cloud_Leica

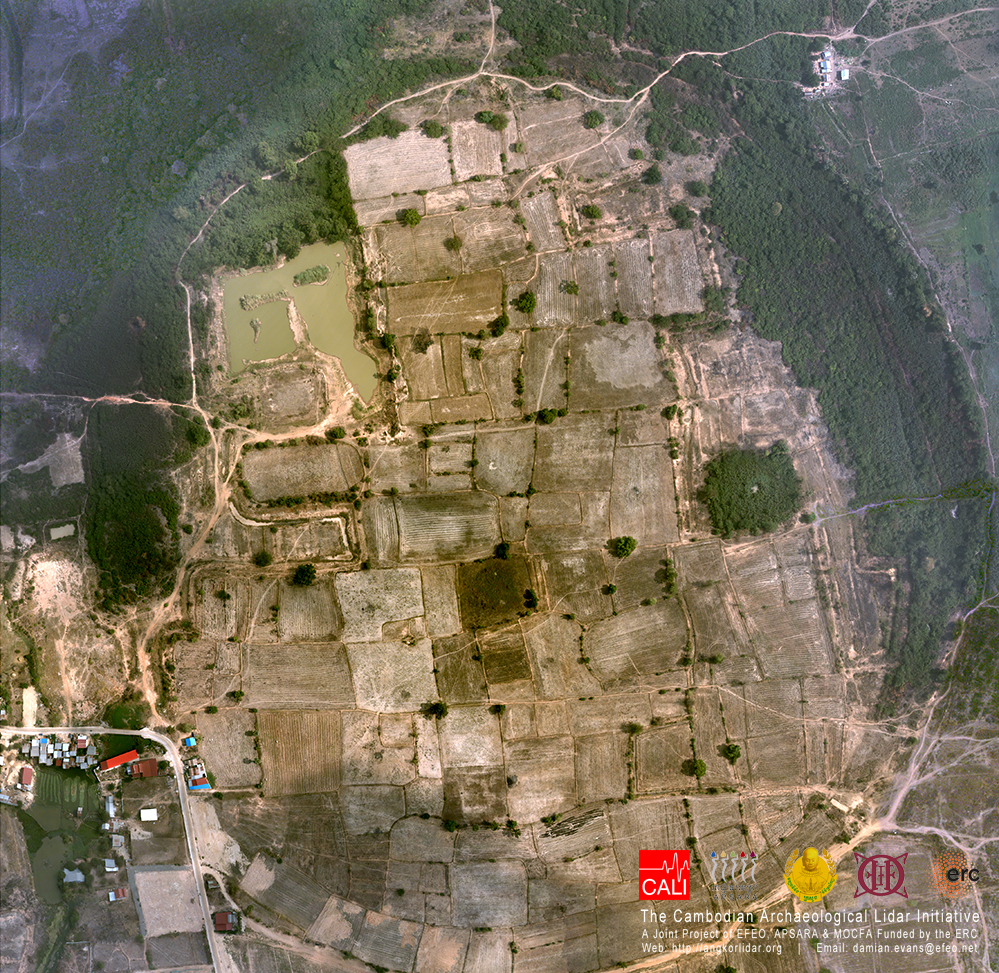
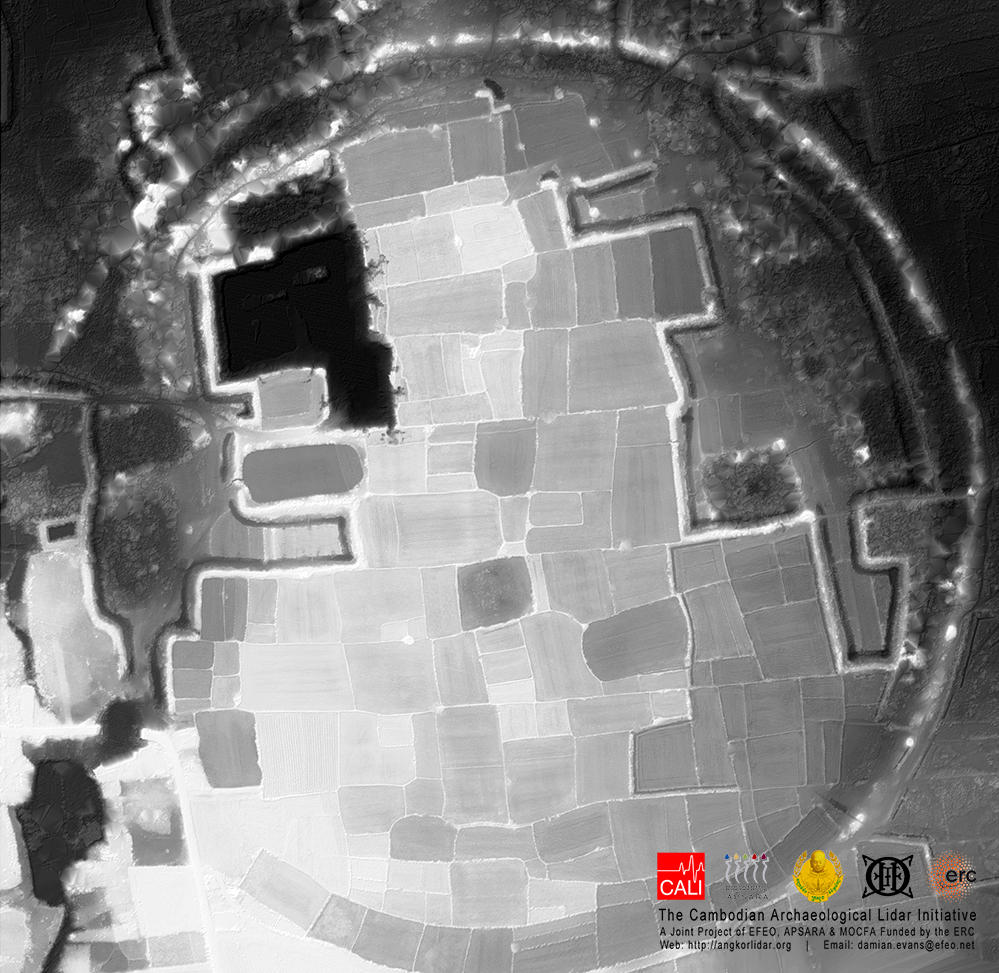
Here are two views of a site named Choeung Ek; the first is an optical photograph and the second is a lidar view that removes most of the vegetation. I think you’ll agree that structures appear much more clearly in the lidar image.

Choueng_Ek_Photo_CALISource: Cambodian Archaeological LIDAR InitiativeChoueng_Ek_Lidar_CALISource: Cambodian Archaeological LIDAR Initiative

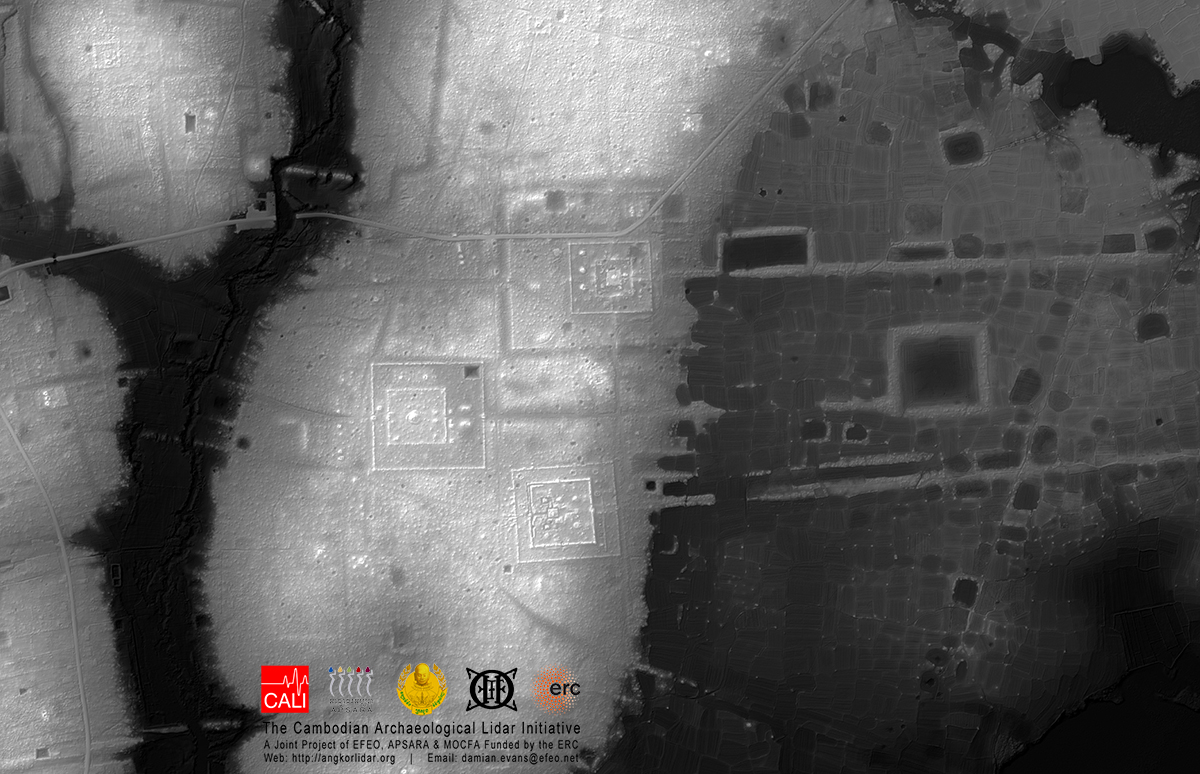
An example of a lidar image for a larger site is shown in the following map of the central monuments of the well-researched and mapped site named Sambor Prei Kuk. CALI reported:

“The lidar data adds a whole new dimension though, showing a quite complex system of moats, waterways and other features that had not been mapped in detail before. This is just the central few sq km of the Sambor Prei Kuk data; we actually acquired about 200 sq km over the site and its environs.”

Sambor Prei Kuk lidar_CALISource: Cambodian Archaeological LIDAR Initiative

For more information on the lidar archaeological surveys in Cambodia, please refer to the following recent articles:

See the 18 July 2016 article by Annalee Newitz entitled, “How archaeologists found the lost medieval megacity of Angkor,” on the arsTECHNICA website at the following link:

http://arstechnica.com/science/2016/07/how-archaeologists-found-the-lost-medieval-megacity-of-angkor/?utm_source=howtogeek&utm_medium=email&utm_campaign=newsletter

On the Smithsonian magazine website, see the April 2016 article entitled, “The Lost City of Cambodia,” at the following link:

http://www.smithsonianmag.com/history/lost-city-cambodia-180958508/?no-ist

Also on the Smithsonian magazine website, see the 14 June 2016 article by Jason Daley entitled, “Laser Scans Reveal Massive Khmer Cities Hidden in the Cambodian Jungle,” at the following link:

http://www.smithsonianmag.com/smart-news/laser-scans-reveal-massive-khmer-cities-hidden-cambodian-jungle-180959395/

CIA’s 1950 Nuclear Security Assessments After the Soviet’s First Nuclear Test

Peter Lobner

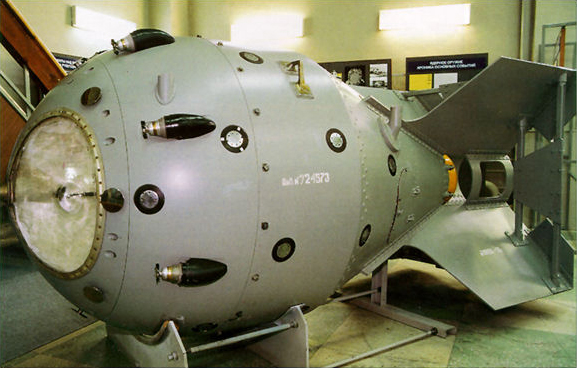
The first Soviet test of a nuclear device occurred on 29 August 1949 at the Semipalatinsk nuclear test site in what today is Kazakhstan. In the Soviet Union, this first device was known as RDS-1, Izdeliye 501 (device 501) and First Lightning. In the U.S., it was named Joe-1. This was an implosion type device with a yield of about 22 kilotons that, thanks to highly effective Soviet nuclear espionage during World War II, may have been very similar to the U.S. Fat Man bomb that was dropped on the Japanese city Nagasaki.

Casing_for_the_first_Soviet_atomic_bomb,_RDS-1Joe-1 casing. Source: Wikipedia / Minatom Archives

The Central Intelligence Agency (CIA) was tasked with assessing the impact of the Soviet Union having a demonstrated nuclear capability. In mid-1950, the CIA issued two Top Secret reports providing their assessment. These reports have been declassified and now are in the public domain. I think you’ll find that they make interesting reading, even 66 years later.

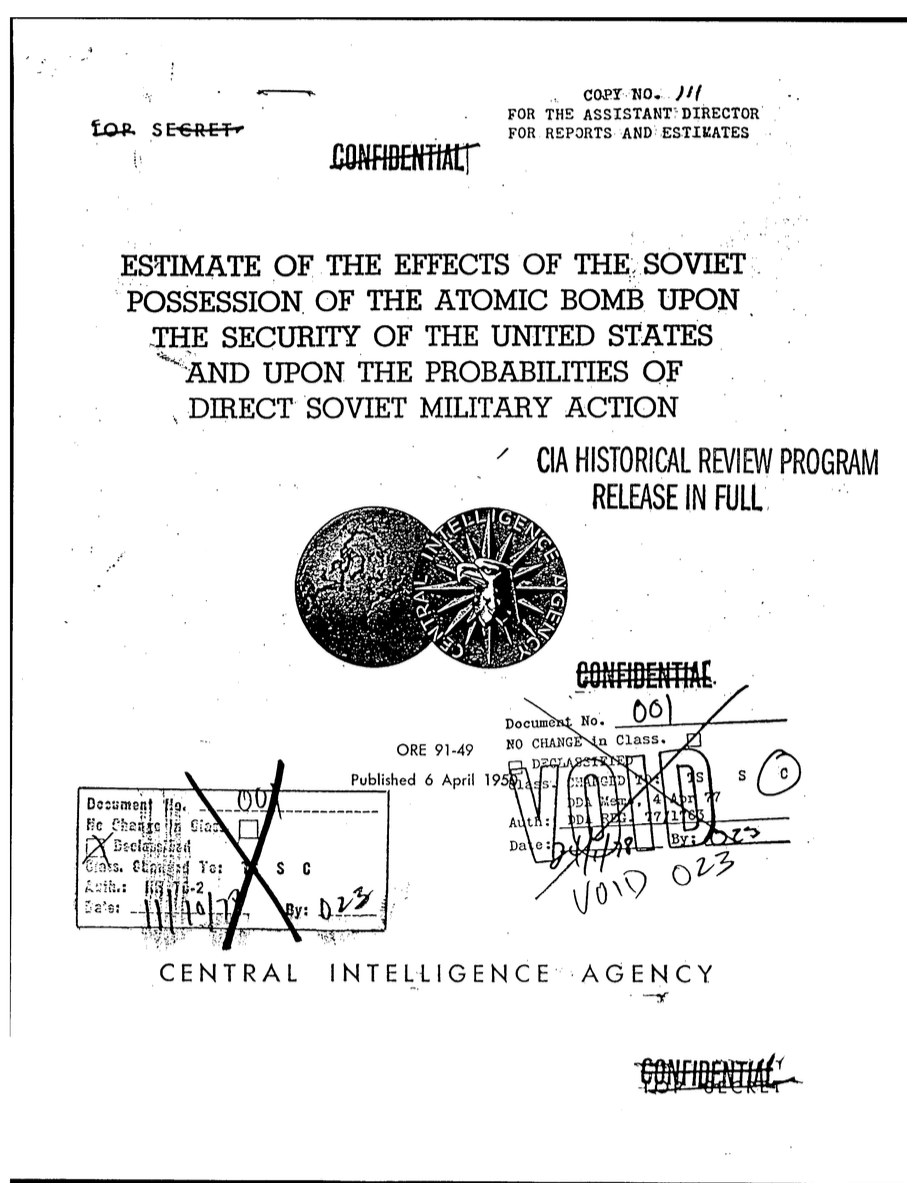
The first report, ORE 91-49, is entitled, “Estimate of the Effects of the Soviet Possession of the Atomic Bomb upon the Security of the United States and upon the Probabilities of Direct Soviet Military Action,” dated 6 April 1950.

ORE 91-49 cover page

You can download this report as a pdf file at the following link:

https://www.cia.gov/library/readingroom/docs/DOC_0000258849.pdf

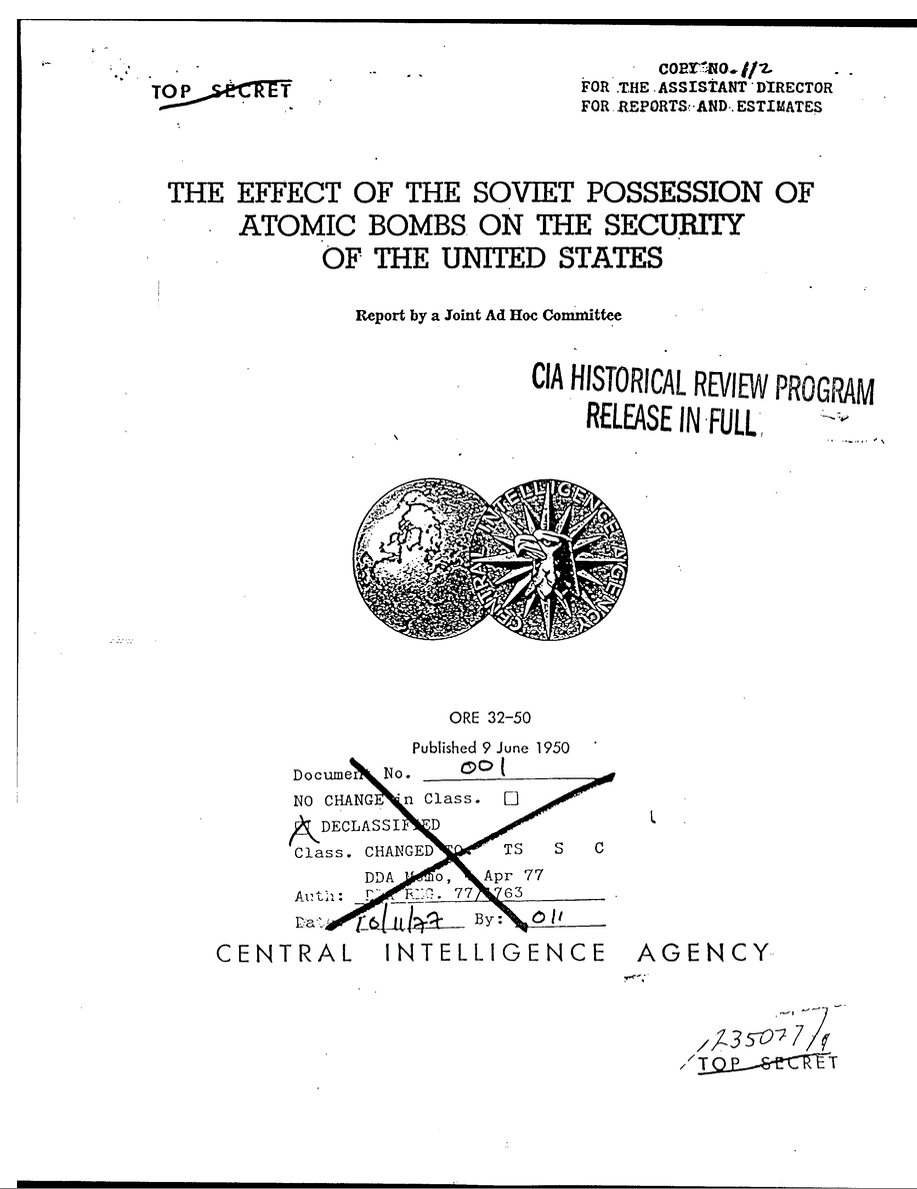
The second, shorter summary report, ORE 32-50, is entitled, “The Effect of the Soviet Possession of Atomic Bombs on the Security of the United States,” dated 9 June 1950.

ORE_32-50 cover page

You can download this report as a pdf file at the following link:

http://www.alternatewars.com/WW3/WW3_Documents/CIA/ORE-32-50_9-JUN-1950.pdf

The next Soviet nuclear tests didn’t occur until 1951. The RDS-2 (Joe-2) and RDS-3 (Joe-3) tests were conducted on 24 September 1951 and 18 October 1951, respectively.

Deep Learning Has Gone Mainstream

Peter Lobner

The 28 September 2016 article by Roger Parloff, entitled, “Why Deep Learning is Suddenly Changing Your Life,” is well worth reading to get a general overview of the practical implications of this subset of artificial intelligence (AI) and machine learning. You’ll find this article on the Fortune website at the following link:

http://fortune.com/ai-artificial-intelligence-deep-machine-learning/?utm_source=howtogeek&utm_medium=email&utm_campaign=newsletter

Here, the relationship between AI, machine learning and deep learning are put in perspective as shown in the following table.
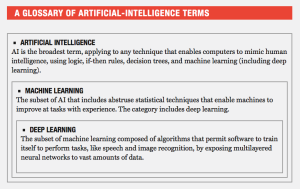
Def of deep learning  _ FortuneSource: Fortune

This article also includes a helpful timeline to illustrate the long history of technical development, from 1958 to today, that have led to the modern technology of deep learning.

Another overview article worth your time is by Robert D. Hof, entitled, “Deep Learning –

With massive amounts of computational power, machines can now recognize objects and translate speech in real time. Artificial intelligence is finally getting smart.” This article is in the MIT Technology Review, which you will find at the following link:

https://www.technologyreview.com/s/513696/deep-learning/

As noted in both articles, we’re seeing the benefits of deep learning technology in the remarkable improvements in image and speech recognition systems that are being incorporated into modern consumer devices and vehicles, and less visibly, in military systems. For example, see my 31 January 2016 post, “Rise of the Babel Fish,” for a look at two competing real-time machine translation systems: Google Translate and ImTranslator.

The rise of deep learning has depended on two key technologies:

Deep neural nets: These are layers of neural nets that progressively build up the complexity needed for real-time image and speech recognition. Robert D. Hoff explains: “The first layer learns primitive features, like an edge in an image or the tiniest unit of speech sound. It does this by finding combinations of digitized pixels or sound waves that occur more often than they should by chance. Once that layer accurately recognizes those features, they’re fed to the next layer, which trains itself to recognize more complex features, like a corner or a combination of speech sounds. The process is repeated in successive layers until the system can reliably recognize phonemes or objects…… Because the multiple layers of neurons allow for more precise training on the many variants of a sound, the system can recognize scraps of sound more reliably, especially in noisy environments….”

Big data: Roger Parloff reported: “Although the Internet was awash in it (data), most data—especially when it came to images—wasn’t labeled, and that’s what you needed to train neural nets. That’s where Fei-Fei Li, a Stanford AI professor, stepped in. ‘Our vision was that big data would change the way machine learning works,’ she explains in an interview. ‘Data drives learning.’

In 2007 she launched ImageNet, assembling a free database of more than 14 million labeled images. It went live in 2009, and the next year she set up an annual contest to incentivize and publish computer-vision breakthroughs.

In October 2012, when two of Hinton’s students won that competition, it became clear to all that deep learning had arrived.”

The combination of these technologies has resulted in very rapid improvements in image and speech recognition capabilities and performance and their employment in marketable products and services. Typically the latest capabilities and performance appear at the top of a market and then rapidly proliferate down into the lower price end of the market.

For example, Tesla cars include a camera system capable of identifying lane markings, obstructions, animals and much more, including reading signs, detecting traffic lights, and determining road composition. On a recent trip in Europe, I had a much more modest Ford Fusion with several of these image recognition and associated alerting capabilities. You can see a Wall Street Journal video on how Volvo is incorporating kangaroo detection and alerting into their latest models for the Australian market

https://ca.finance.yahoo.com/video/playlist/autos-on-screen/kangaroo-detection-help-cars-avoid-220203668.html?pt=tAD1SCT8P72012-08-09.html/?date20140124

I believe the first Teslas in Australia incorrectly identified kangaroos as dogs. Within days, the Australian Teslas were updated remotely with the capability to correctly identify kangaroos.

Regarding the future, Robert D. Hof noted: “Extending deep learning into applications beyond speech and image recognition will require more conceptual and software breakthroughs, not to mention many more advances in processing power. And we probably won’t see machines we all agree can think for themselves for years, perhaps decades—if ever. But for now, says Peter Lee, head of Microsoft Research USA, ‘deep learning has reignited some of the grand challenges in artificial intelligence.’”

Actually, I think there’s more to the story of what potentially is beyond the demonstrated capabilities of deep learning in the areas of speech and image recognition. If you’ve read Douglas Adams “The Hitchhiker’s Guide to the Galaxy,” you already have had a glimpse of that future, in which the great computer, Deep Thought, was asked for “the answer to the ultimate question of life, the universe and everything.”  Surely, this would be the ultimate test of deep learning.

Deep ThoughtAsking the ultimate question to the great computer Deep Thought. Source: BBC / The Hitchhiker’s Guide to the Galaxy

In case you’ve forgotten the answer, either of the following two videos will refresh your memory.

From the original 1981 BBC TV serial (12:24 min):

https://www.youtube.com/watch?v=cjEdxO91RWQ

From the 2005 movie (2:42 min):

https://www.youtube.com/watch?v=aboZctrHfK8

New Testable Theory on the Flow of Time and the Meaning of Now

Peter Lobner

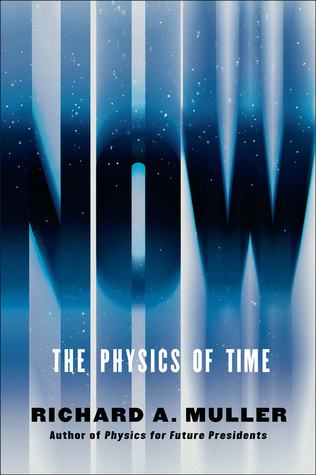
Richard A. Muller, a professor of physics at the University of California, Berkeley, and Facility Senior Scientist at Lawrence Berkeley Laboratory, is the author of in intriguing new book entitled, “NOW, the Physics of Time.”

NOW cover page  Source: W. W. Norton & Company

In Now, Muller addresses weaknesses in past theories about the flow of time and the meaning of “now.” He also presents his own revolutionary theory, one that makes testable predictions. He begins by describing the physics building blocks of his theory: relativity, entropy, entanglement, antimatter, and the Big Bang. Muller points out that the standard Big Bang theory explains the ongoing expansion of the universe as the continuous creation of new space. He argues that time is also expanding and that the leading edge of the new time is what we experience as “now.”

You’ll find a better explanation in the UC Berkeley short video, “Why does time advance?: Richard Muller’s new theory,” at the following link:

https://www.youtube.com/watch?v=FYxUzm7gQkY

In the video, Muller explains that his theory would have resulted in a measurable 1 millisecond delay in “chirp” seen in the first gravitational wave signals detected on 11 February 2016 by the Laser Interferometer Gravitational-Wave Observatory (LIGO). LIGO’s current sensitivity precluded seeing the predicted small delay. If LIGO and other and-based gravity wave detector sensitivities are not adequate, a potentially more sensitive space-based gravity wave detection array, eLISA, should be in place in the 2020s to test Muller’s theory.

It’ll be interesting to see if LIGO, any of the other land-based gravity wave detectors, or eLISA will have the needed sensitivity to prove or disprove Muller’s theory.

For more information related to gravity wave detection, see my following posts:

  • 16 December 2015 post, “100th Anniversary of Einstein’s General Theory of Relativity and the Advent of a New Generation of Gravity Wave Detectors ”
  • 11 February 2016 post, “NSF and LIGO Team Announce First Detection of Gravitational Waves”
  • 27 September 2016, “Space-based Gravity Wave Detection System to be Deployed by ESA”