Peter Lobner
The Magnus effect occurs when a moving spherical or cylindrical body has a spin. The observed effect is that the moving, spinning body moves away from the intended direction of travel. The spin alters the airflow around the moving body and, by conservation of momentum, generates the Magnus force. In the case of a flying (thrown) backspinnning round body shown below, the Magnus force is a lift.
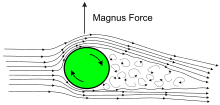 Source: Wikipedia
The Magnus force is named for German physicist Heinrich Gustav Magnus, who described the effect in 1852. Other scientists had described the effect long before Magnus, notably Isaac Newton (in 1672) and British mathematician and ballistic researcher Benjamin Robins (in 1742), but it was Magnus who got the honor.
We can see the Magnus effect at work in sports and in other applications discussed below.
Baseball
The pitcher can impart a spin in a selected direction to throw a curveball, slider or other pitch. Major League Baseball (MLB) uses a system called PITCHf/x, which is installed in every MLB stadium, to track the speed and trajectory of pitched baseballs. The system calculates two values, BRK and PFX, related to the Magnus effect:
- BRK is a measure of the amount of bend in the trajectory at its greatest distance from a straight line
- PFX is a measure of the deflection of the baseball due to the spin and drag forces from the path it would have taken under the influence of gravity alone
You can find more information on PITCHf/x at the following links:
https://en.wikipedia.org/wiki/PITCHf/x
and,
http://www.fangraphs.com/library/misc/pitch-fx/
Golf
A backspin on a golf ball creates a lift, as shown in the diagram above, helping to extend the range of the shot. A topspin has the opposite effect, shortening the ball’s trajectory. A spin about a vertical or diagonal axis results in a slice or hook to the right or left, invariably putting the ball into deep grass or some other course hazard. I have trouble visualizing how a golfer imparts a spin about the ball’s vertical or diagonal axis, but apparently it is a lot easier that you might think.
Extreme basketball
Thanks to Dave Groce, who forwarded the following link to a video that demonstrates how the Magnus effect helped a group in Tasmania sink a basketball from the top of a dam. I have a feeling that there were a lot more basketballs at the bottom of the dam than are shown in the video.
https://www.youtube.com/watch?v=2OSrvzNW9FE
Ballistics
A spinning bullet will encounter a Magnus force if it yaws slightly in flight (i.e., direction of the central axis of the bullet is slightly different than its direction of flight, or velocity vector) or is shot into a crosswind. The direction of the Magnus force will depend on the direction of yaw or crosswind. A sniper shooting at long range needs to consider the Magnus effect.
WW II Dambusters
As reported on the Bomber Command website (http://www.bombercommandmuseum.ca/damsraid1.html):
“The Dams Raid was conceived in the brilliant mind of Barnes Wallis, an experienced aircraft designer. Wallis had designed the very successful Wellington bomber that had been operational since the beginning of the war and, in his spare time, he searched for weaknesses in the enemy’s industrial infrastructure. The hydroelectric dams of the highly Ruhr Valley became his focus.
He devised a cylindrical, 9,500 pound weapon that could be dropped at low level while rotating backwards at 500 rpm. Released from a height of 60 feet, about 450 yards from the dam, and at a speed of 230 miles per hour, the weapon would then skip along the water (and over any torpedo nets) until it struck the dam wall, the spinning maintaining the weapon’s stability and slowing it down.
The backward rotation would then cause the cylinder to roll down the dam wall where it would explode at a predetermined depth. The wall would be weakened and the great weight of water would cause the dam to collapse.”
Experiments performed by Wallis demonstrated that the Magnus effect gave aerodynamic lift to the bomb and thereby increased the number of bounces before the bomb either struck the dam or stopped bouncing and sank.
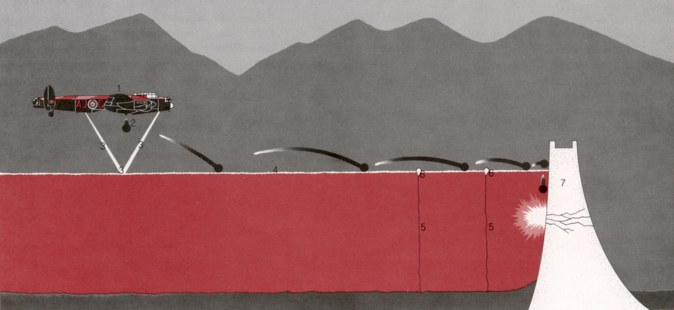 Source: Bomber Command Museum
There is much more information on Sir Barnes Wallis and the Dams Raid on the Bomber Command website.
For more information, I also recommend the book, “Dam Busters: The True Story of the Inventors and Airmen Who Led the Devastating Raid to Smash the German Dams in 1943,” by James Holland, published by Grove Press, New York, and available in paperback in 2014, ISBN-13: 978-0802122780.


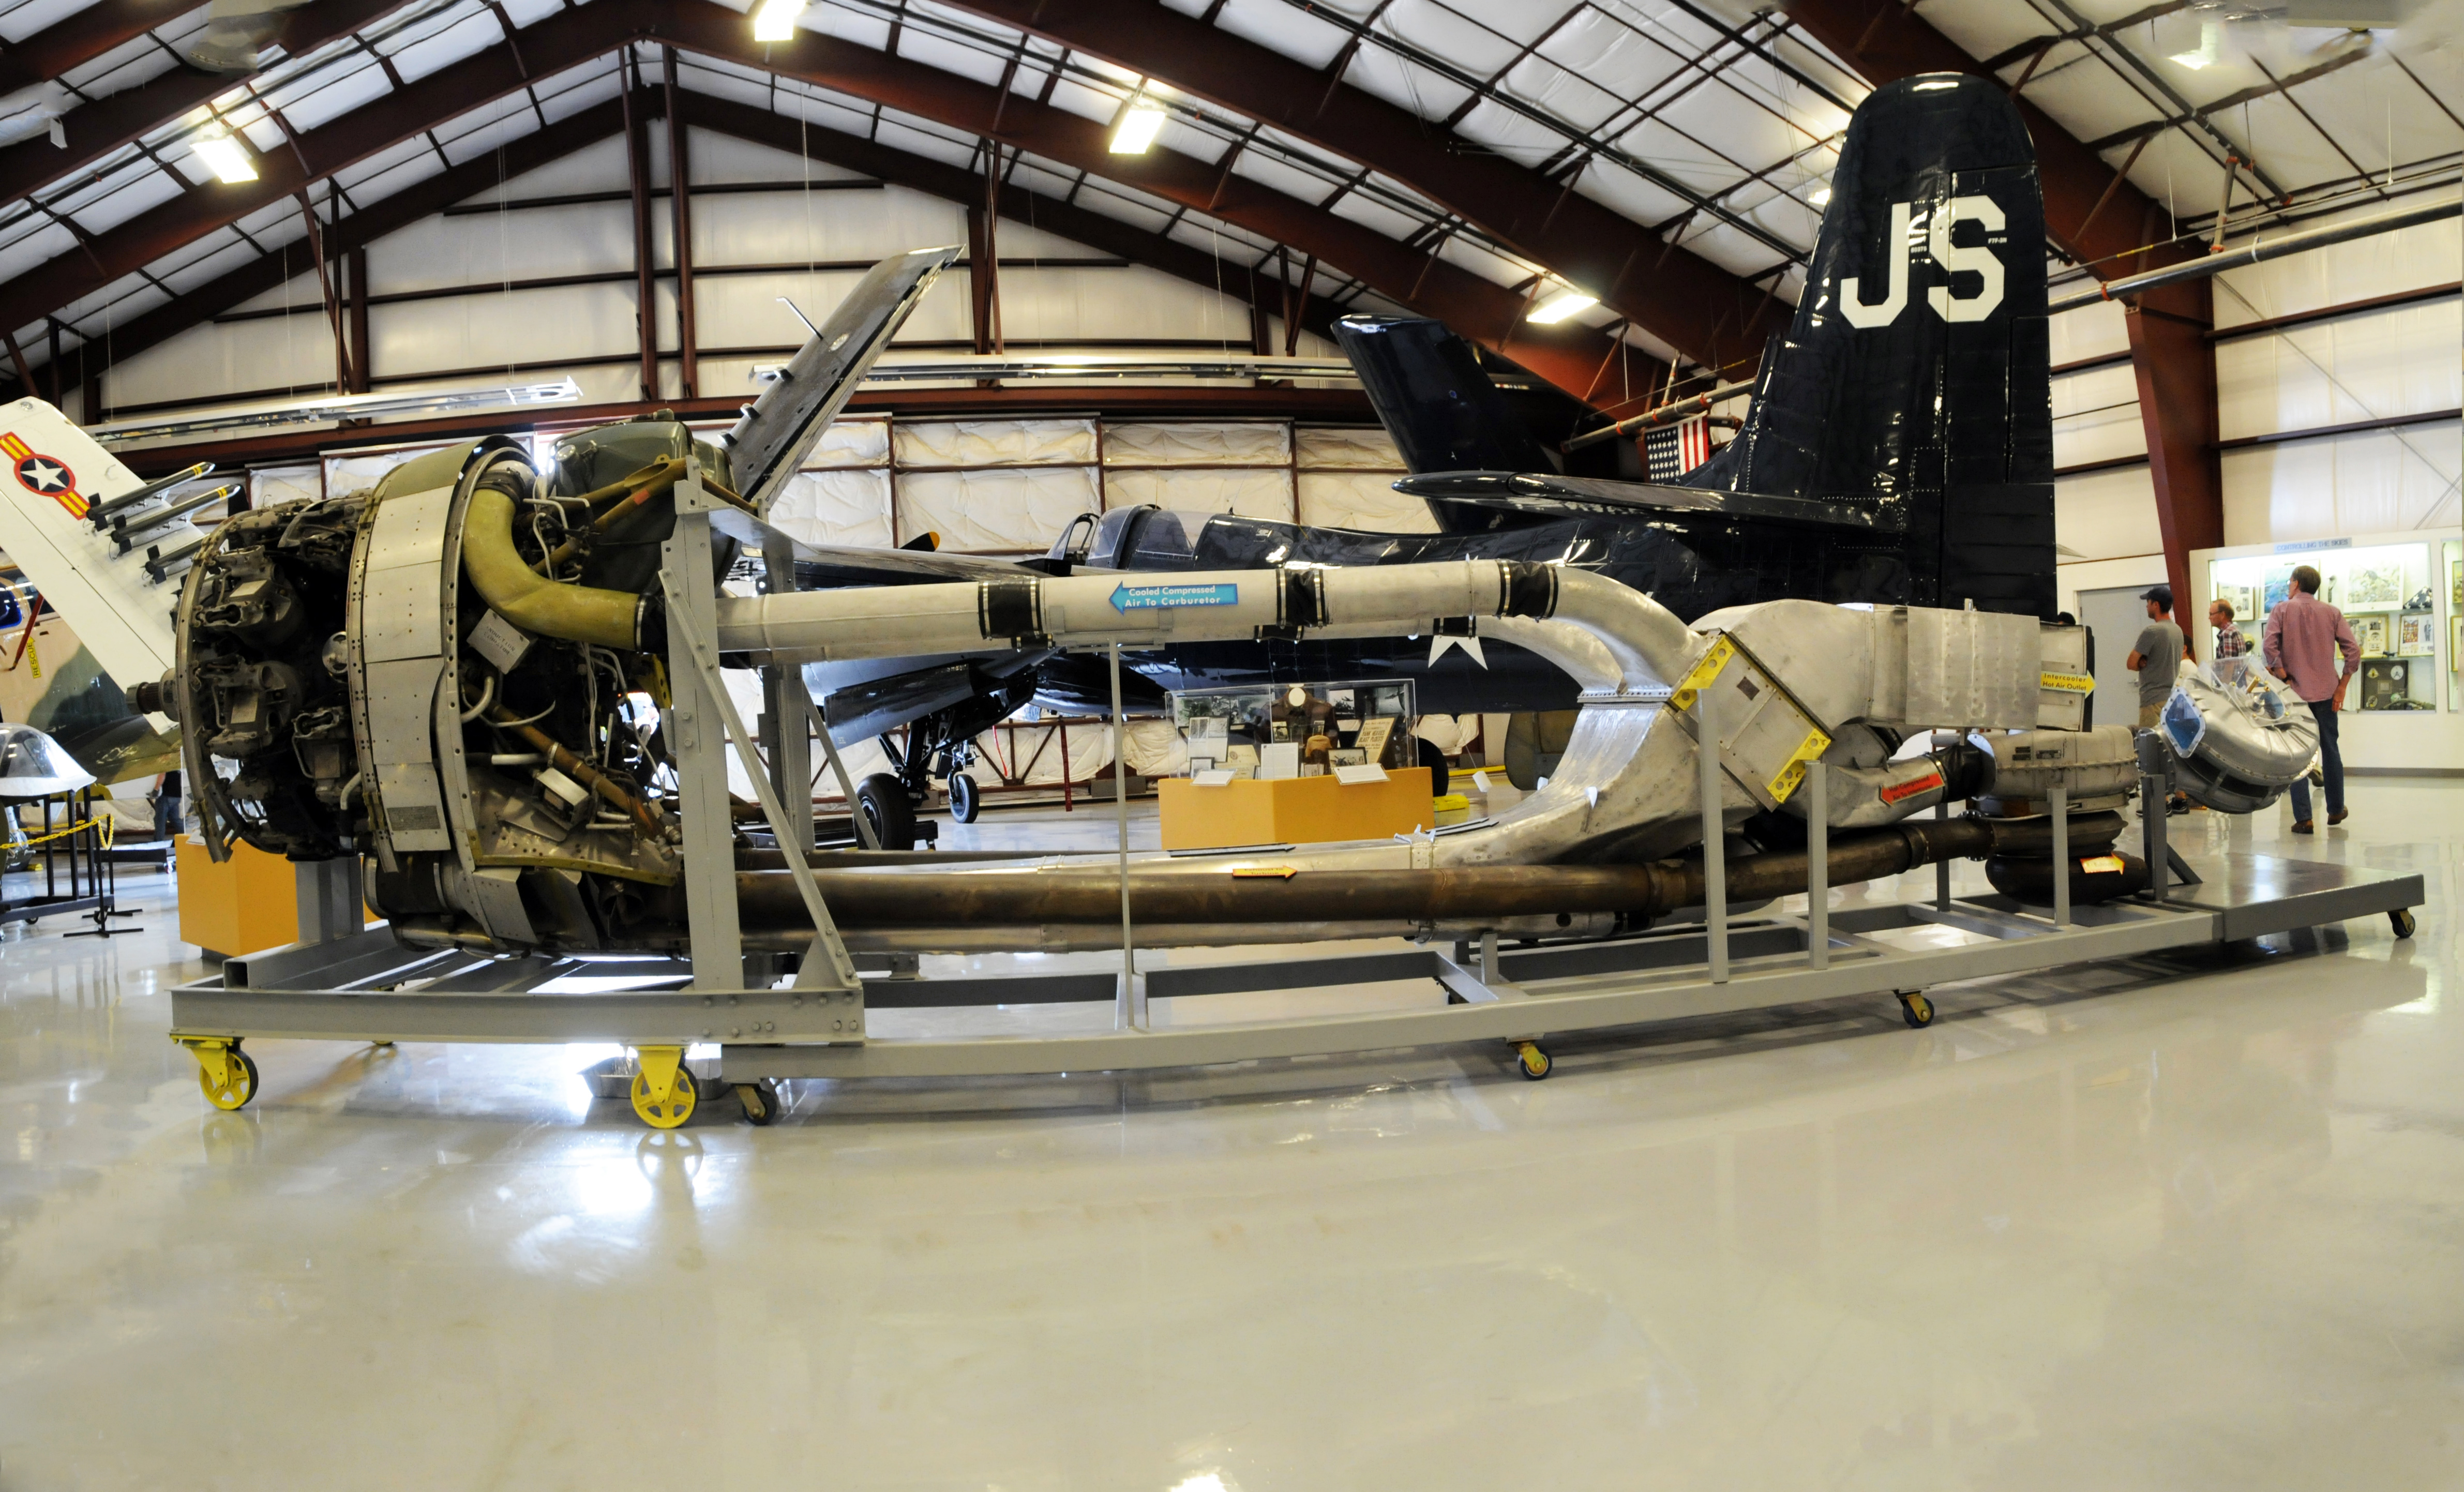
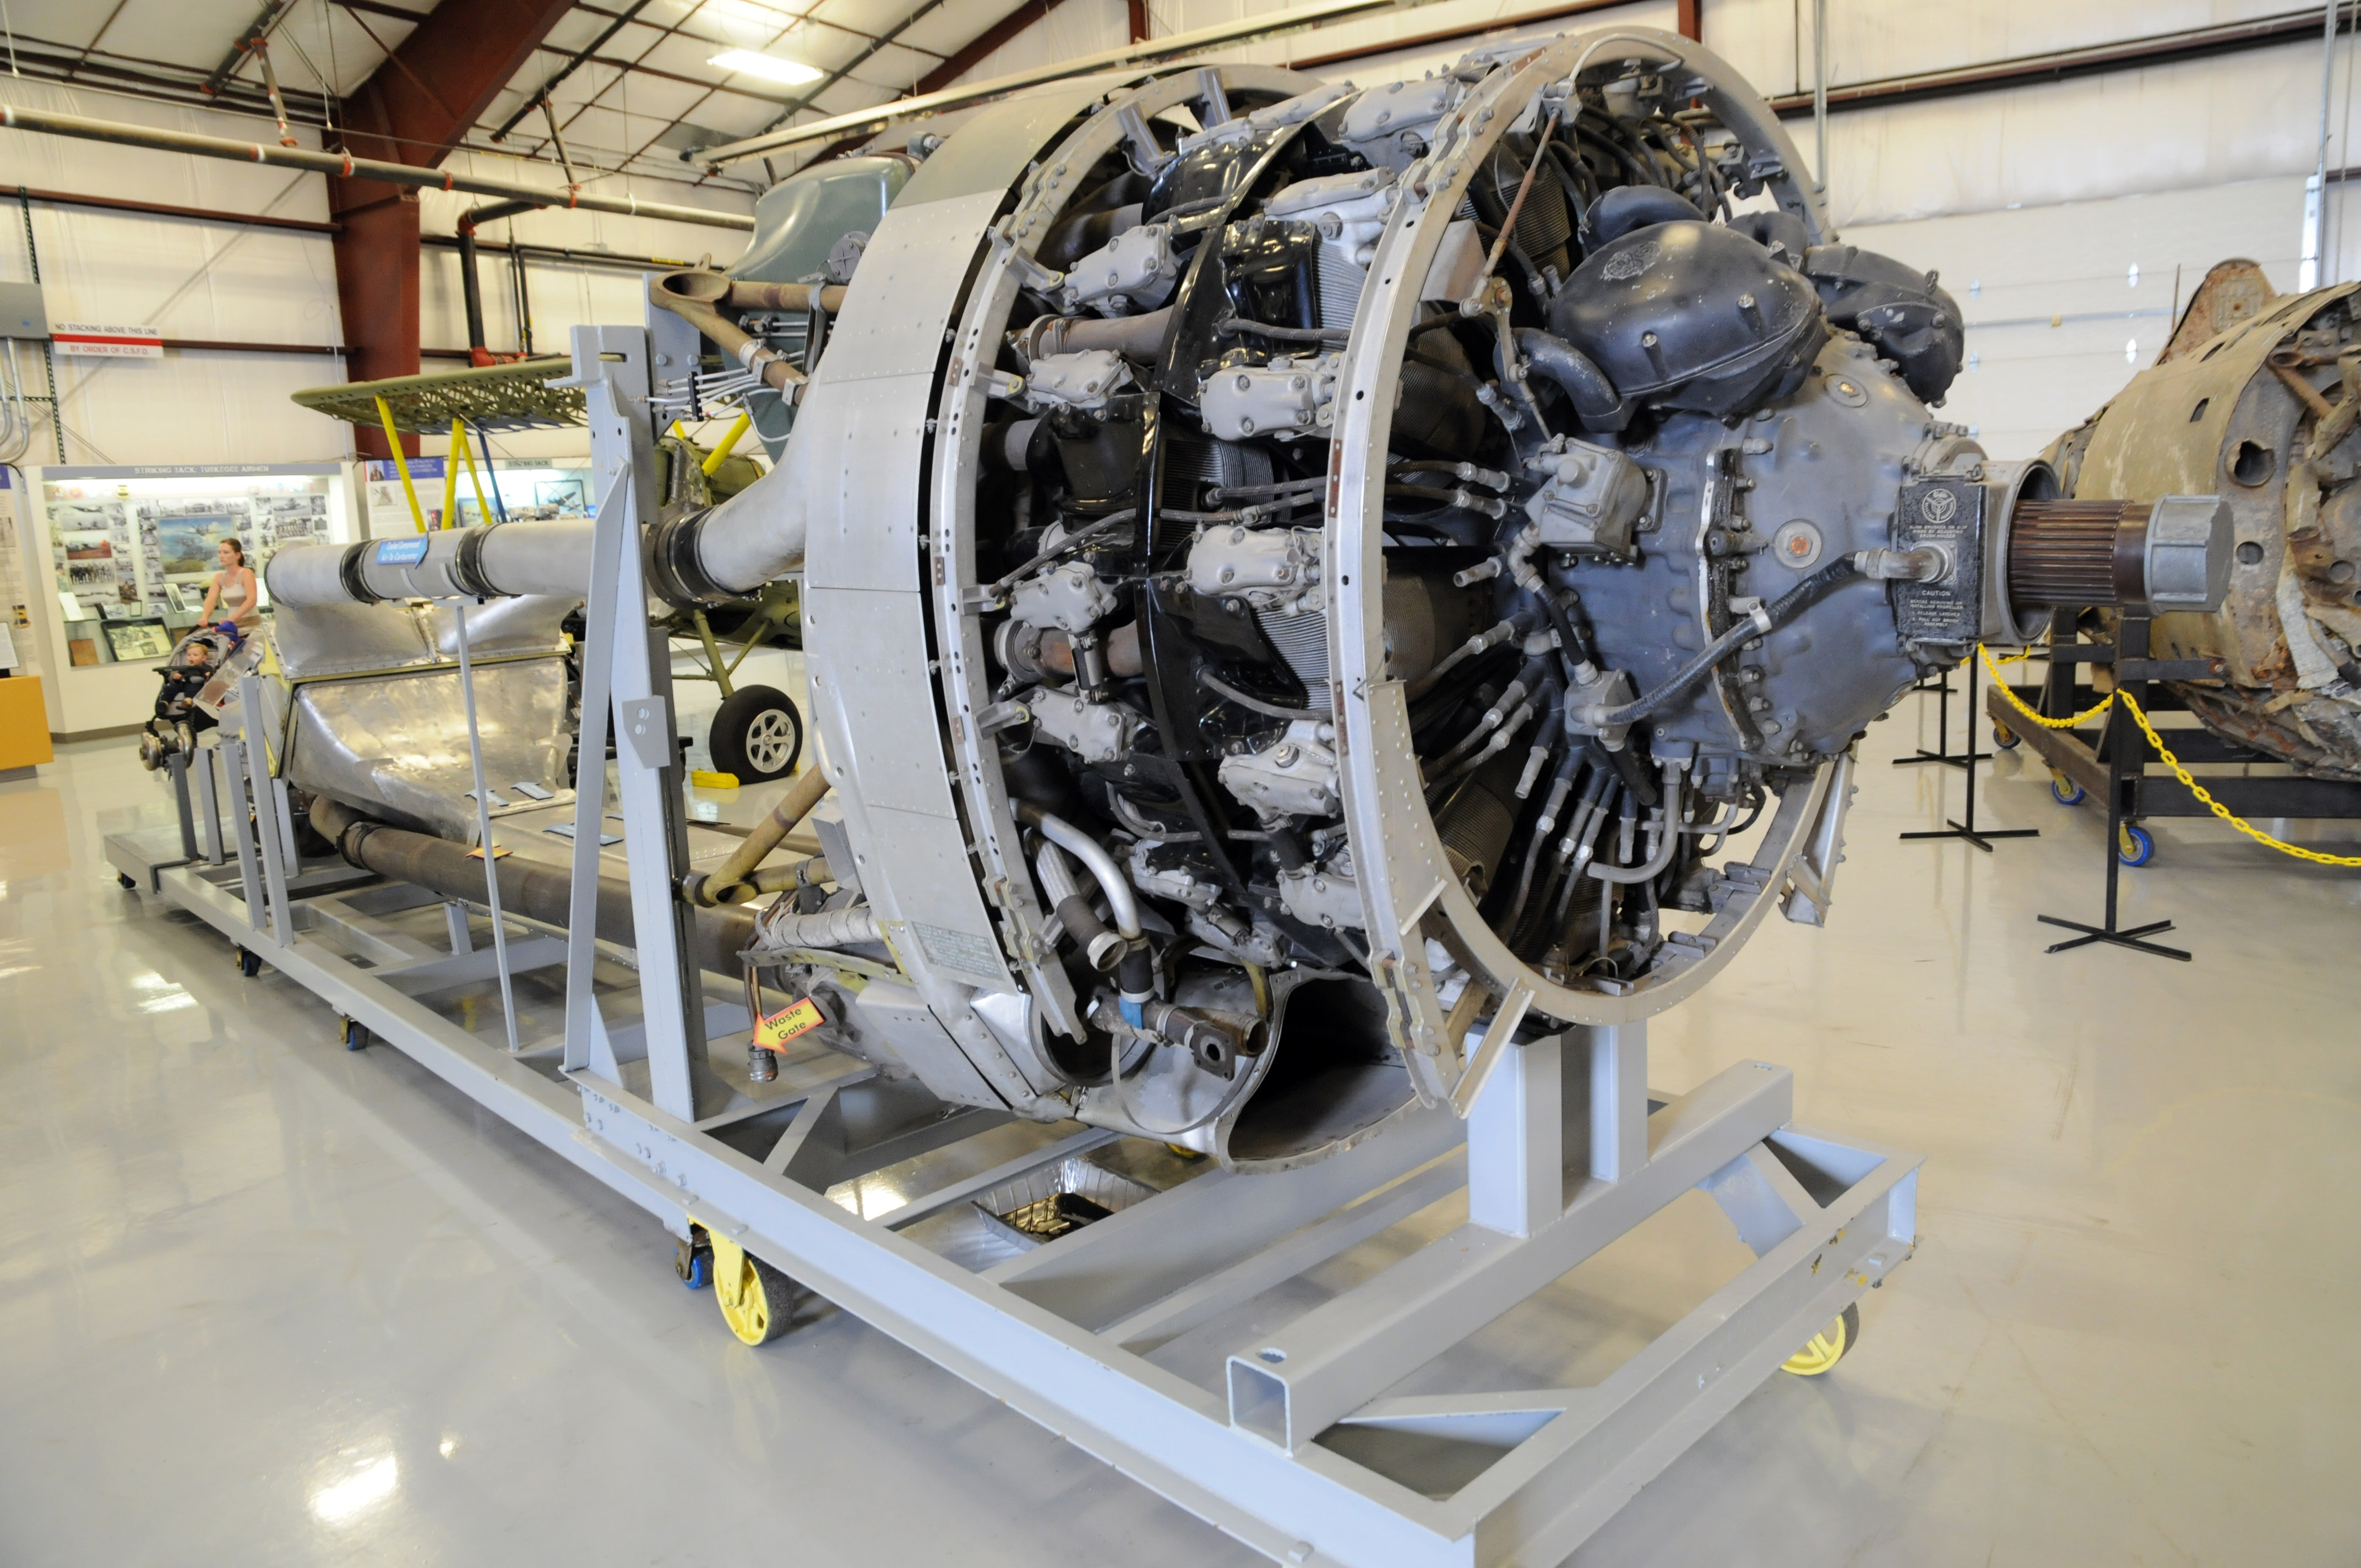
 Source: Author photo
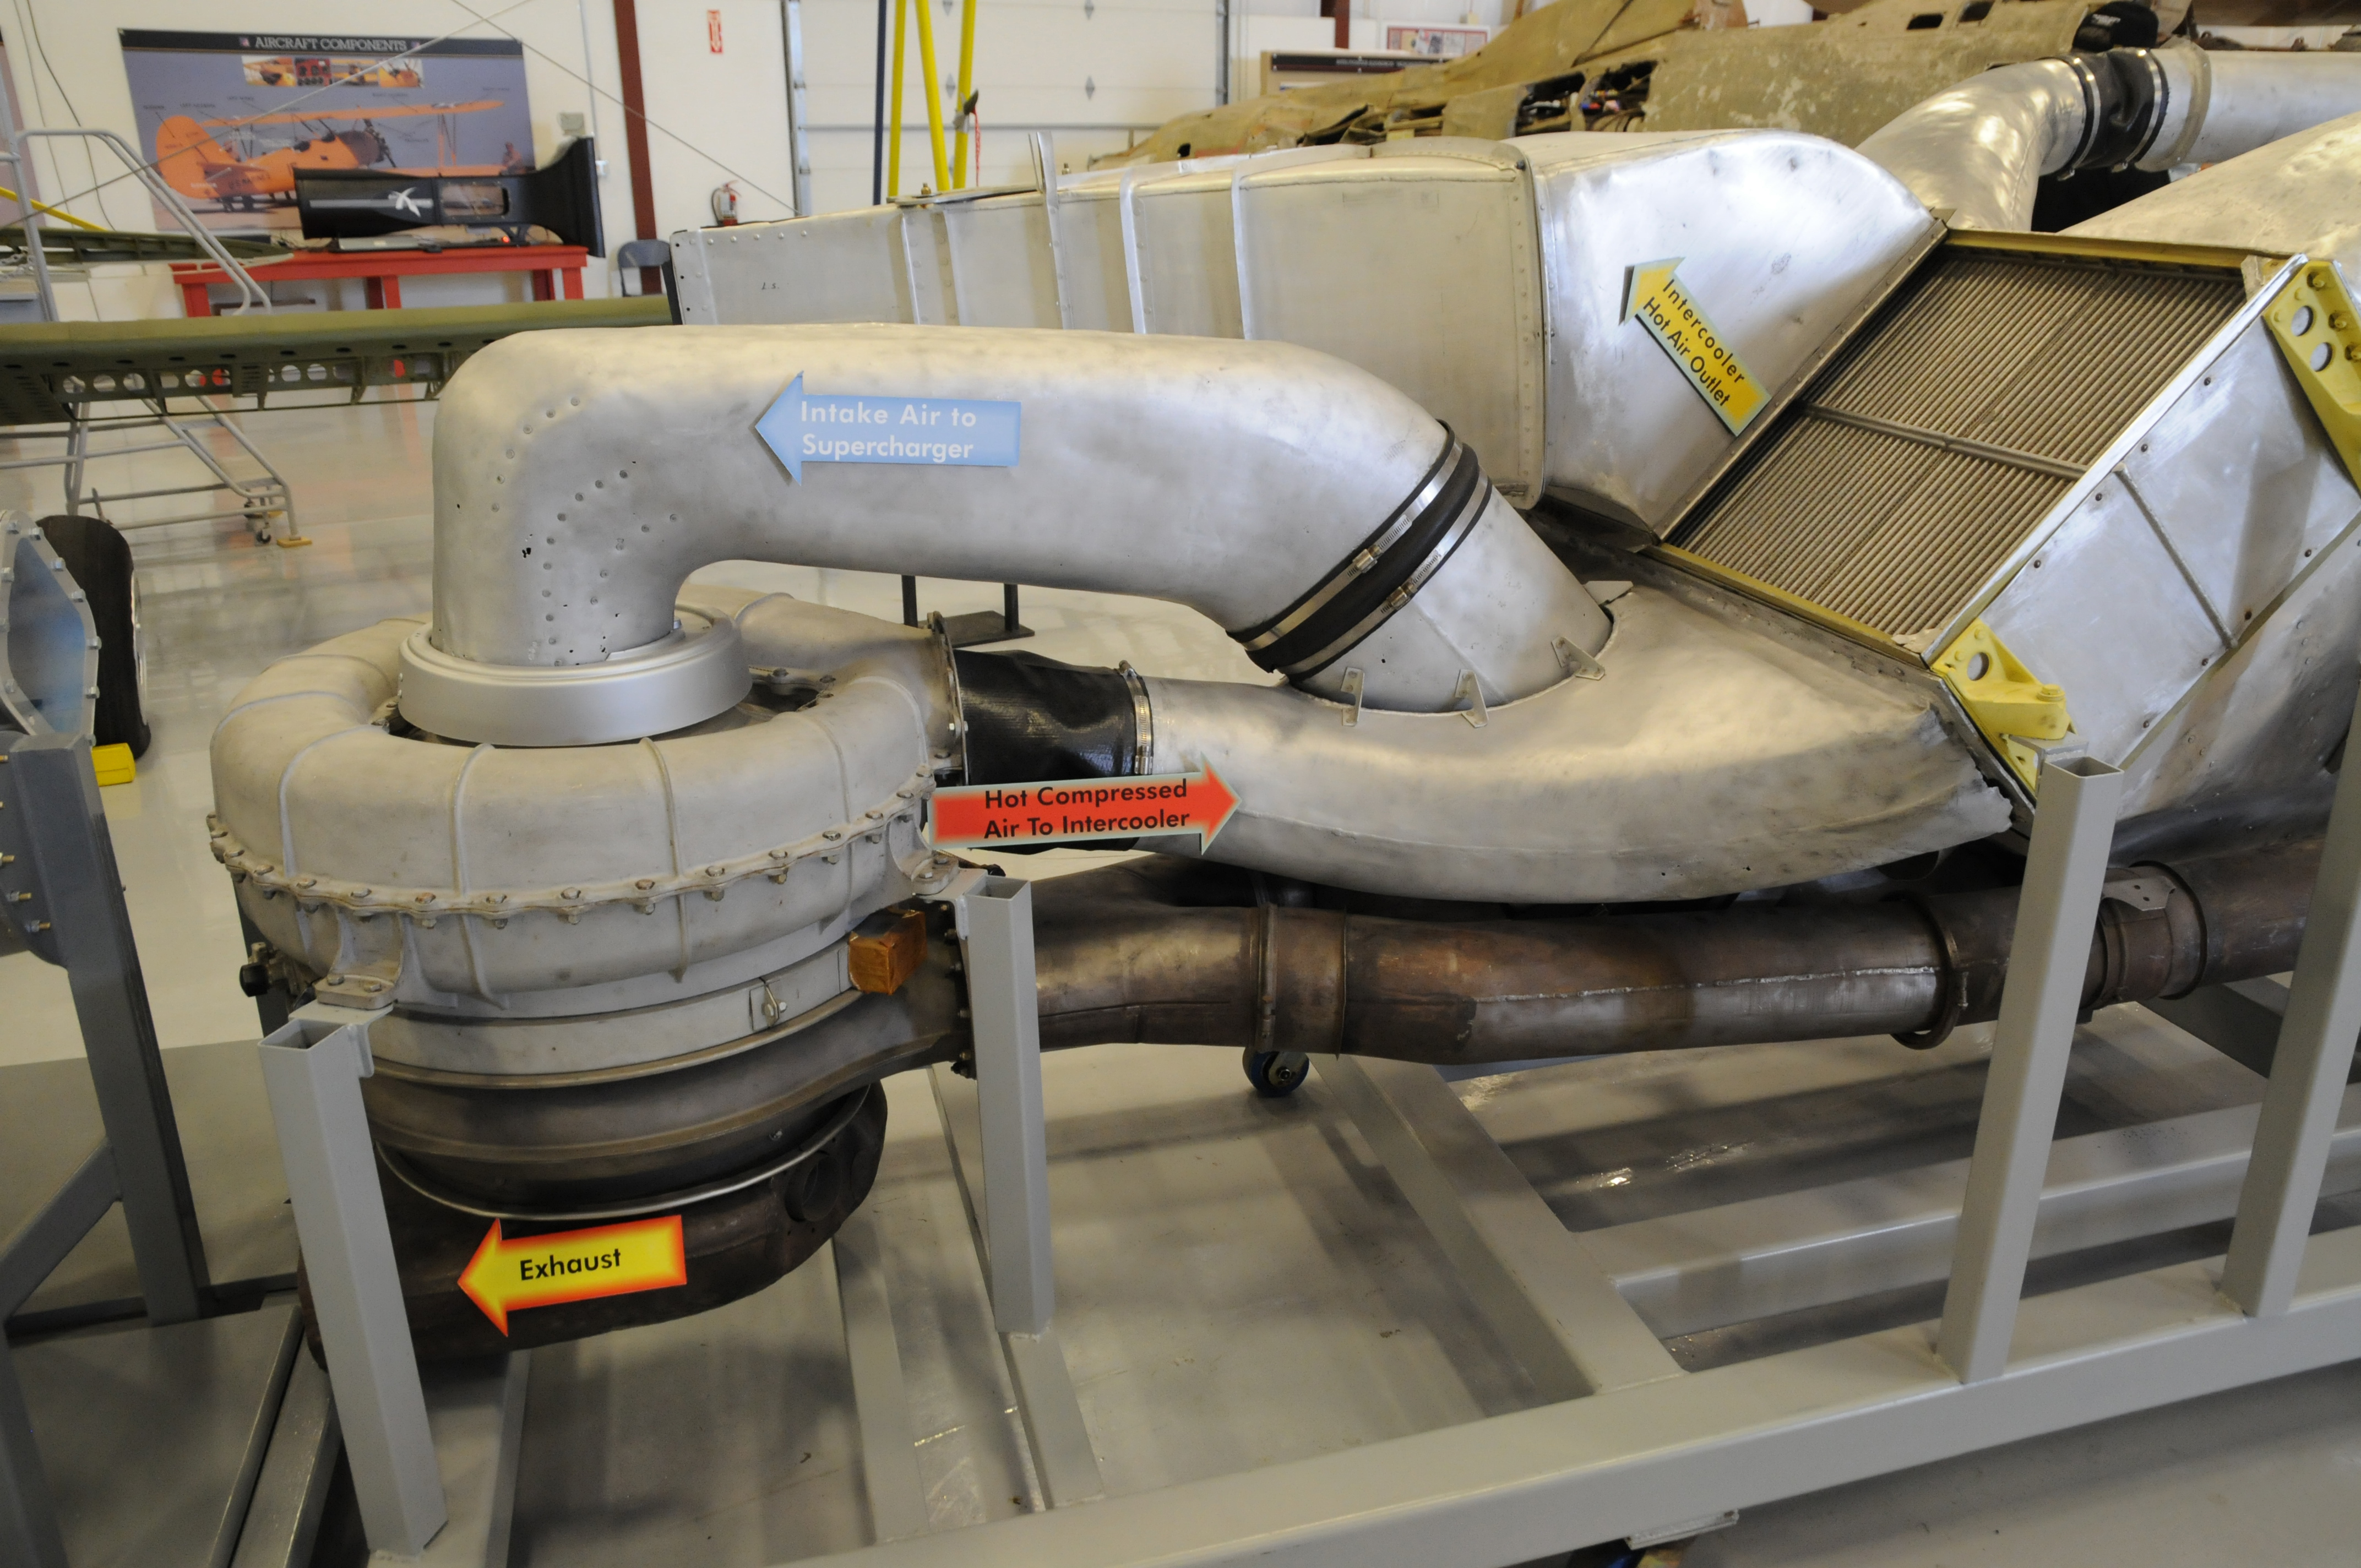


