Peter Lobner
The nuclear weapons doctrines of India and Pakistan are different. This means that these two countries are not in sync on the matters of how and when they might use nuclear weapons in a regional military conflict. I’d like to think that cooler heads would prevail during a crisis and use of nuclear weapons would be averted. In light of current events, there may not be enough “cooler heads” on both sides in the region to prevail every time there is a crisis.
Case in point: In late September 2016, India announced it had carried out “surgical strikes” (inside Pakistan) on suspected militants preparing to infiltrate from the Pakistan-held part of Kashmir into the Indian-held part of that state. Responding to India’s latest strikes, Pakistan’s Defense Minister, Khawaja Muhammad Asif, has been reported widely to have made the following very provocative statement, which provides unsettling insights into Pakistan’s current nuclear weapons doctrine:
“Tactical weapons, our programs that we have developed, they have been developed for our protection. We haven’t kept the devices that we have just as showpieces. But if our safety is threatened, we will annihilate them (India).”
You can see a short Indian news video on this matter at the following link:
1. Asymmetry in nuclear weapons doctrines
There are two recent papers that discuss in detail the nuclear weapons doctrines of India and Pakistan. Both papers address the issue of asymmetry and its operational implication. However, the papers differ a bit on the details of the nuclear weapons doctrines themselves. I’ll start by briefly summarizing these papers and using them to synthesize a short list of the key points in the respective nuclear weapons doctrines.
The first paper, entitled “India and Pakistan’s Nuclear Doctrines and Posture: A Comparative Analysis,” by Air Commodore (Retired) Khalid Iqbal, former Assistant Chief of Air Staff, Pakistan Air Force was published in Criterion Quarterly (Islamabad), Volume 11, Number 3, Jul-Sept 2016. The author’s key points are:
“Having preponderance in conventional arms, India subscribed to ‘No First Use’ concept but, soon after, started diluting it by attaching conditionalities to it; and having un-matching conventional capability, Pakistan retained the options of ‘First Use.’. Ever since 1998, doctrines of both the countries are going through the pangs of evolution. Doctrines of the two countries are mismatched. India intends to deter nuclear use by Pakistan while Pakistan’s nuclear weapons are meant to compensate for conventional arms asymmetry.”
You will read Khalid Iqbal’s complete paper at the following link:
The second paper, entitled “A Comparative Study of Nuclear Doctrines of India and Pakistan,” by Amir Latif appeared in the June 2014, Vol. 2, No. 1 issue of Journal of Global Peace and Conflict. The author provides the following summary (quoted from a 2005 paper by R. Hussain):
“There are three main attributes of the Pakistan’s undeclared nuclear doctrine. It has three distinct policy objectives: a) deter a first nuclear use by India; b) enable Pakistan to deter Indian conventional attack; c) allow Islamabad to “internationalize the crisis and invite outside intervention in the unfavorable circumstance.”
You can read Amir Latif’s complete paper at the following link
http://jgpcnet.com/journals/jgpc/Vol_2_No_1_June_2014/7.pdf
Synopsis of India’s nuclear weapons doctrine
India published its official nuclear doctrine on 4 January 2003. The main points related to nuclear weapons use are the following.
- India’s nuclear deterrent is directed toward Pakistan and China.
- India’s will build and maintain a credible minimum deterrent against those nations.
- India’s adopted a “No First Use” policy, subject to the following caveats:
- India may use nuclear weapons in retaliation after a nuclear attack on its territory or on its military forces (wherever they may be).
- In the event of a major biological or chemical attack, India reserves the option to use nuclear weapons.
- Only the civil political leadership (the Nuclear Command Authority) can authorize nuclear retaliatory attacks.
- Nuclear weapons will not be used against non-nuclear states (see caveat above regarding chemical or bio weapon attack).
Synopsis of Pakistan’s nuclear weapons doctrine
Pakistan does not have an officially declared nuclear doctrine. Their doctrine appears to be based on the following points:
- Pakistan’s nuclear deterrent is directed toward India.
- Pakistan will build and maintain a credible minimum deterrent.
- The sole aim of having these weapons is to deter India from aggression that might threaten Pakistan’s territorial integrity or national independence / sovereignty.
- Size of the deterrent force is enough inflict unacceptable damage on India with strikes on counter-value targets.
- Pakistan has not adopted a “No First Use” policy.
- Nuclear weapons are essential to counter India’s conventional weapons superiority.
- Nuclear weapons reestablish an overall Balance of Power, given the unbalanced conventional force ratios between the two sides (favoring India).
- National Command Authority (NCA), comprising the Employment Control Committee, Development Control Committee and Strategic Plans Division, is the center point of all decision-making on nuclear issues.
- Nuclear assets are considered to be safe, secure and almost free from risks of improper or accidental use.
The nuclear weapons doctrine asymmetry between India and Pakistan really boils down to this:
India’s No First Use policy (with some caveats) vs. Pakistan’s policy of possible first use to compensate for conventional weapons asymmetry.
2. Nuclear tests and current nuclear arsenals
India
India tested its first nuclear device on 18 May 1974. Twenty-four years later, in mid-1998, tests of three devices were conducted, followed two days later by two more tests. All of these tests were low-yield, but multiple weapons configurations were tested in 1998.
India’s current nuclear arsenal is described in a paper by Hans M. Kristensen and Robert S. Norris entitled, “Indian Nuclear Forces, 2015,” which was published online on 27 November 2015 in the Bulletin of Atomic Scientists, Volume 71 at the following link:
http://www.tandfonline.com/doi/full/10.1177/0096340215599788
In this paper, authors Kristensen and Norris make the following points regarding India’s nuclear arsenal.
- India is estimated to have produced approximately 540 kg of weapon-grade plutonium, enough for 135 to 180 nuclear warheads, though not all of that material is being used.
- India has produced between 110 and 120 nuclear warheads.
- The country’s fighter-bombers are the backbone of its operational nuclear strike force.
- India also has made considerable progress in developing land-based ballistic missile and cruise missile delivery systems.
- India is developing a nuclear-powered missile submarine and is developing sea-based ballistic missile (and cruise missile) delivery systems.
Pakistan
Pakistan is reported to have conducted many “cold” (non-fission) tests in March 1983. Shortly after the last Indian nuclear tests, Pakistan conducted six low-yield nuclear tests in rapid succession in late May 1998.
On 1 August 2016, the Congressional Research Service published the report, “Pakistan’s Nuclear Weapons,” which provides an overview of Pakistan’s nuclear weapons program. You can download this report at the following link:
https://www.fas.org/sgp/crs/nuke/RL34248.pdf
An important source for this CRS report was another paper by Hans M. Kristensen and Robert S. Norris entitled, “Pakistani Nuclear Forces, 2015,” which was published online on 27 November 2015 in the Bulletin of Atomic Scientists, Volume 71 at the following link:
http://www.tandfonline.com/doi/full/10.1177/0096340215611090
In this paper, authors Kristensen and Norris make the following points regarding Pakistan’s nuclear arsenal.
- Pakistan has a nuclear weapons stockpile of 110 to 130 warheads.
- As of late 2014, the International Panel on Fissile Materials estimated that Pakistan had an inventory of approximately 3,100 kg of highly enriched uranium (HEU) and roughly 170kg of weapon-grade plutonium.
- The weapons stockpile realistically could grow to 220 – 250 warheads by 2025.
- Pakistan has several types of operational nuclear-capable ballistic missiles, with at least two more under development.
3. Impact on global climate and famine of a regional nuclear war between India and Pakistan
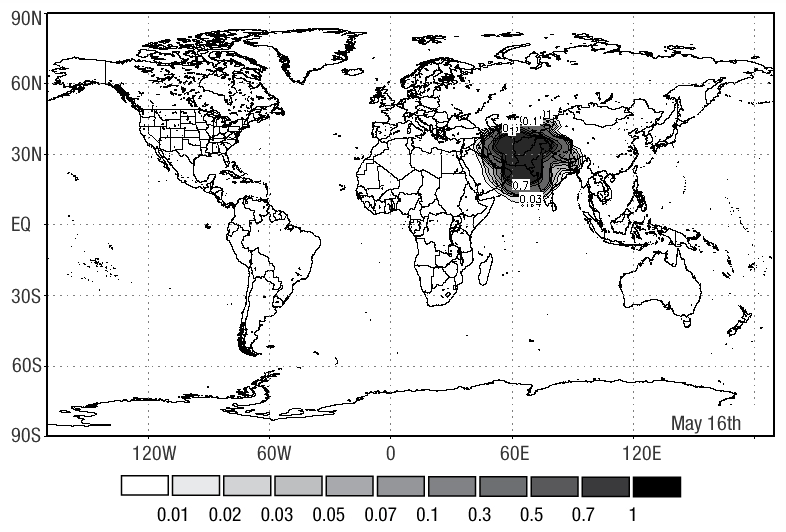
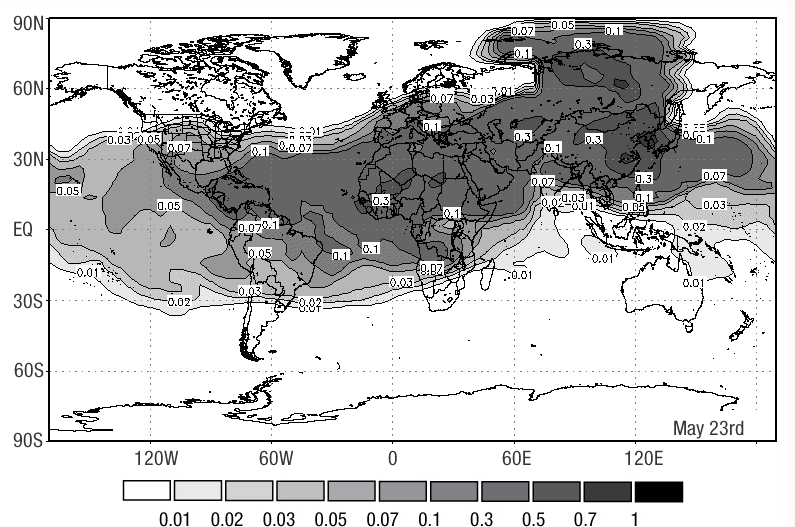
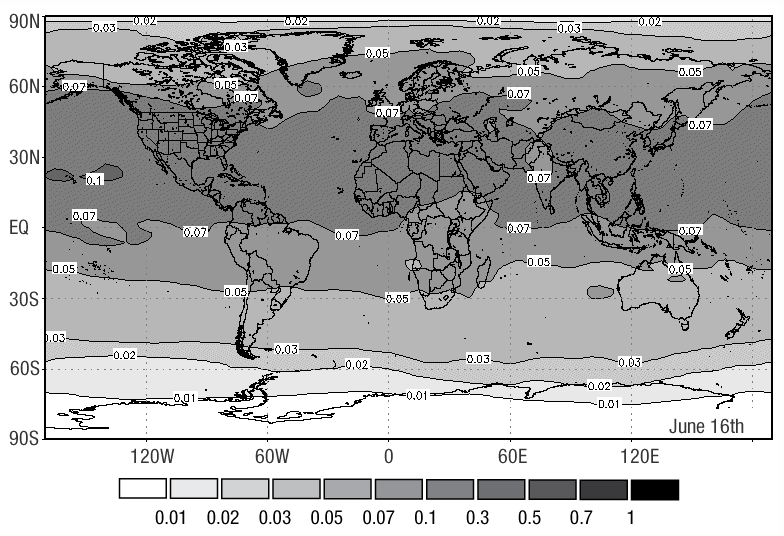
On their website, the organization NuclearDarkness presents the results of analyses that attempt to quantify the effects on global climate of a nuclear war, based largely on the quantity of smoke lofted into the atmosphere by the nuclear weapons exchange. Results are presented for three cases: 5, 50 and 150 million metric tons (5, 50 and 150 Teragrams, Tg). The lowest case, 5 million tons, represents a regional nuclear war between India and Pakistan, with both sides using low-yield nuclear weapons. A summary of the assessment is as follows:
“Following a war between India and Pakistan, in which 100 Hiroshima-size (15 kiloton) nuclear weapons are detonated in the large cities of these nations, 5 million tons of smoke is lofted high into the stratosphere and is quickly spread around the world. A smoke layer forms around both hemispheres which will remain in place for many years to block sunlight from reaching the surface of the Earth. One year after the smoke injection there would be temperature drops of several degrees C within the grain-growing interiors of Eurasia and North America. There would be a corresponding shortening of growing seasons by up to 30 days and a 10% reduction in average global precipitation.”
You will find more details, including a day-to-day animation of the global distribution of the dust cloud for a two-month period after the start of the war, at the following link:
http://www.nucleardarkness.org/warconsequences/fivemilliontonsofsmoke/
In the following screenshots from the animation at the above link, you can see how rapidly the smoke distributes worldwide in the upper atmosphere after the initial regional nuclear exchange.
This consequence assessment on the nucleardarkness.org website is based largely on the following two papers by Robock, A. et al., which were published in 2007:
The first paper, entitled, “Nuclear winter revisited with a modern climate model and current nuclear arsenals: Still catastrophic consequences,” was published in the Journal of Geophysical Research, Vol. 112. The authors offer the following comments on the climate model they used.
“We use a modern climate model to reexamine the climate response to a range of nuclear wars, producing 50 and 150 Tg of smoke, using moderate and large portions of the current global arsenal, and find that there would be significant climatic responses to all the scenarios. This is the first time that an atmosphere-ocean general circulation model has been used for such a simulation and the first time that 10-year simulations have been conducted.”
You can read this paper at the following link:
http://climate.envsci.rutgers.edu/pdf/RobockNW2006JD008235.pdf
The second paper, entitled, “Climatic consequences of regional nuclear conflicts”, was published in Atmospheric Chemistry and Physics, 7, pp. 2003 – 2012. This paper provides the analysis for the 5 Tg case.
“We use a modern climate model and new estimates of smoke generated by fires in contemporary cities to calculate the response of the climate system to a regional nuclear war between emerging third world nuclear powers using 100 Hiroshima-size bombs.”
You can read this paper at the following link:
http://www.atmos-chem-phys.net/7/2003/2007/acp-7-2003-2007.pdf
Building on the work of Roblock, Ira Helhand authored the paper, “An Assessment of the Extent of Projected Global Famine Resulting From Limited, Regional Nuclear War.” His main points with regard to a post-war famine are:
“The recent study by Robock et al on the climatic consequences of regional nuclear war shows that even a “limited” nuclear conflict, involving as few as 100 Hiroshima-sized bombs, would have global implications with significant cooling of the earth’s surface and decreased precipitation in many parts of the world. A conflict of this magnitude could arise between emerging nuclear powers such as India and Pakistan. Past episodes of abrupt global cooling, due to volcanic activity, caused major crop failures and famine; the predicted climate effects of a regional nuclear war would be expected to cause similar shortfalls in agricultural production. In addition large quantities of food might need to be destroyed and significant areas of cropland might need to be taken out of production because of radioactive contamination. Even a modest, sudden decline in agricultural production could trigger significant increases in the prices for basic foods and hoarding on a global scale, both of which would make food inaccessible to poor people in much of the world. While it is not possible to estimate the precise extent of the global famine that would follow a regional nuclear war, it seems reasonable to postulate a total global death toll in the range of one billion from starvation alone. Famine on this scale would also lead to major epidemics of infectious diseases, and would create immense potential for war and civil conflict.”
You can download this paper at the following link:
http://www.psr.org/assets/pdfs/helfandpaper.pdf
4. Conclusions
The nuclear weapons doctrines of India and Pakistan are not in sync on the matters of how and when they might use nuclear weapons in a regional military conflict. The highly sensitive region of Kashmir repeatedly has served as a flashpoint for conflicts between India and Pakistan and again is the site of a current conflict. If the very provocative recent statements by Pakistan’s Defense Minister, Khawaja Muhammad Asif, are to be believed, then there are credible scenarios in which Pakistan makes first use of low-yield nuclear weapons against India’s superior conventional forces.
The consequences to global climate from this regional nuclear conflict can be quite significant and lasting, with severe impacts on global food production and distribution. With a bit of imagination, I’m sure you can piece together a disturbing picture of how an India – Pakistan regional nuclear conflict can evolve into a global disaster.
Let’s hope that cooler heads in that region always prevail.


 Planck all-sky survey 2013 CBM temperature map shows anisotropies in the temperature of the CMB at the full resolution obtained by Planck. Source: ESA / Planck Collaboration