Peter Lobner
Updated 18 May 2016 and 30 October 2018
 Source: NASA
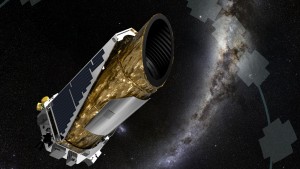
NASA’s Kepler extrasolar planet (exoplanet) hunting observatory was launched on 7 March 2009 into an Earth-trailing orbit around the Sun. From this vantage point, Kepler has a continuous, unobstructed view of the selected target areas in the “northern” sky, above the ecliptic plane (plane of the solar system). Kepler has a very narrow field of view, which is about twice the size of the scoop of the Big Dipper as we see it from Earth (about 1/400th of the sky).
NASA’s Kepler mission website is at the following link:
http://www.nasa.gov/kepler
The Kepler mission team primarily uses the “transit” method to detect exoplanets. NASA explains the transit method as follows:
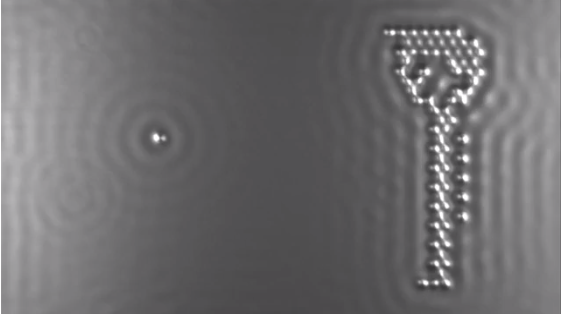
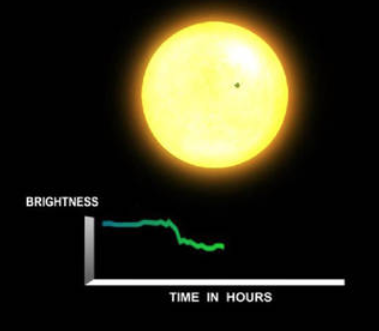
“When a planet passes in front of a star as viewed from Earth, the event is called a ‘transit’. On Earth, we can observe an occasional Venus or Mercury transit. These events are seen as a small black dot creeping across the Sun — Venus or Mercury blocks sunlight as the planet moves between the Sun and us. Kepler finds planets by looking for tiny dips in the brightness of a star when a planet crosses in front of it — we say the planet transits the star.
Once detected, the planet’s orbital size can be calculated from the period (how long it takes the planet to orbit once around the star) and the mass of the star using Kepler’s Third Law of planetary motion. The size of the planet is found from the depth of the transit (how much the brightness of the star drops) and the size of the star. From the orbital size and the temperature of the star, the planet’s characteristic temperature can be calculated. From this the question of whether or not the planet is habitable (not necessarily inhabited) can be answered”.
The following figure illustrates the effect on brightness of a planet transiting across a star.
 Source: NASA Ames
Kepler originally used four reaction wheels to orient the spacecraft to observe specific regions of the sky. After failure of a second reaction wheel in 2013, Kepler no longer was able to maintain a desired orientation with sufficient accuracy. The mission was stopped and the spacecraft was put in “safe mode” until a modified mission plan, dubbed “K2” or “Second Light” was tested and then implemented in May 2014. This K2 mission plan defined new target areas that could be observed using the two remaining reaction wheels and thrusters to orient and stabilize the spacecraft. Measured pointing accuracy in the K2 configuration has been shown to be almost equal to the pointing accuracy with three reaction wheels. The K2 mission is expected to continue through the end of 2016.
The Kepler mission team announced discovery of the first Earth-sized planet in the habitable zone of a star in April 2014. This planet, named Kepler-186f, orbits a red dwarf, the most common type of star in the Milky Way, about 500 light years from Earth.
You will find current information on the confirmed and candidate exoplanets discovered by Kepler at the following link to the NASA Kepler website:
http://www.nasa.gov/kepler/discoveries
In March 2015, NASA’s Kepler team won the National Air and Space Museum 2015 Trophy for Current Achievement. Read more about this award at the following link:
http://www.jpl.nasa.gov/news/news.php?feature=4519
Update – 18 May 2016:
The 10 May 2016 issue of The Astrophysical Journal includes an article entitled, “False Positive Probabilities for all Kepler Objects of Interest: 1284 Newly Validated Planets and 428 Likely False Positives,” by T.D. Morton et al. This paper reports the results of the first large-scale demonstration of a fully automated transiting planet validation process that calculates the probability of an observation being a false positive. A remarkable aspect of this work is that the automated validation process was applied to every Kepler Object of Interest (KOI). The key results reported in this paper are as follows:
- Out of 7,056 KOIs, the team determine that 1,935 have probabilities <1% of being astrophysical false positives, and thus may be considered validated planets.
- Of these, 1,284 have not yet been validated or confirmed by other methods.
- 428 KOIs are likely to be false positives, but have not yet been identified as such by other means
You can download the complete paper at the following link:
http://iopscience.iop.org/article/10.3847/0004-637X/822/2/86
Update – 30 October 2018:
NASA announced that the Kepler Space Telescope ran out of fuel today and no longer could orient itself to study cosmic objects or transmit data to Earth.
“As NASA’s first planet-hunting mission, Kepler has wildly exceeded all our expectations and paved the way for our exploration and search for life in the solar system and beyond,” said Thomas Zurbuchen, associate administrator of NASA’s Science Mission Directorate in Washington. “Not only did it show us how many planets could be out there, it sparked an entirely new and robust field of research that has taken the science community by storm. Its discoveries have shed a new light on our place in the universe, and illuminated the tantalizing mysteries and possibilities among the stars.”
You can read the NASA press release here:
https://www.nasa.gov/press-release/nasa-retires-kepler-space-telescope-passes-planet-hunting-torch
The complete Kepler and K2 missions are described in detail on the NASA website:
https://www.nasa.gov/mission_pages/kepler/main/index.html
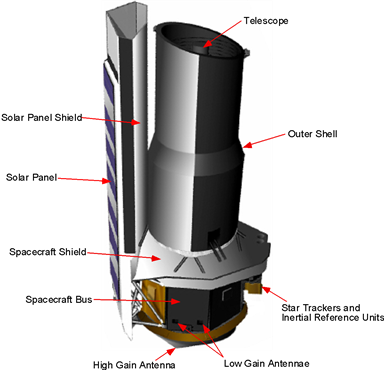 Diagram source: NASA
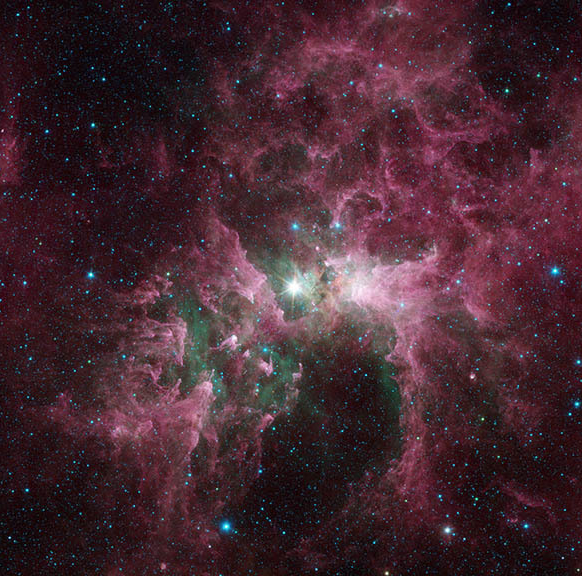 Photo source: NASA