All posts by Drummer

New Testable Theory on the Flow of Time and the Meaning of Now

Peter Lobner

Richard A. Muller, a professor of physics at the University of California, Berkeley, and Facility Senior Scientist at Lawrence Berkeley Laboratory, is the author of in intriguing new book entitled, “NOW, the Physics of Time.”

NOW cover page  Source: W. W. Norton & Company

In Now, Muller addresses weaknesses in past theories about the flow of time and the meaning of “now.” He also presents his own revolutionary theory, one that makes testable predictions. He begins by describing the physics building blocks of his theory: relativity, entropy, entanglement, antimatter, and the Big Bang. Muller points out that the standard Big Bang theory explains the ongoing expansion of the universe as the continuous creation of new space. He argues that time is also expanding and that the leading edge of the new time is what we experience as “now.”

You’ll find a better explanation in the UC Berkeley short video, “Why does time advance?: Richard Muller’s new theory,” at the following link:

https://www.youtube.com/watch?v=FYxUzm7gQkY

In the video, Muller explains that his theory would have resulted in a measurable 1 millisecond delay in “chirp” seen in the first gravitational wave signals detected on 11 February 2016 by the Laser Interferometer Gravitational-Wave Observatory (LIGO). LIGO’s current sensitivity precluded seeing the predicted small delay. If LIGO and other and-based gravity wave detector sensitivities are not adequate, a potentially more sensitive space-based gravity wave detection array, eLISA, should be in place in the 2020s to test Muller’s theory.

It’ll be interesting to see if LIGO, any of the other land-based gravity wave detectors, or eLISA will have the needed sensitivity to prove or disprove Muller’s theory.

For more information related to gravity wave detection, see my following posts:

  • 16 December 2015 post, “100th Anniversary of Einstein’s General Theory of Relativity and the Advent of a New Generation of Gravity Wave Detectors ”
  • 11 February 2016 post, “NSF and LIGO Team Announce First Detection of Gravitational Waves”
  • 27 September 2016, “Space-based Gravity Wave Detection System to be Deployed by ESA”

The Vision for Manned Exploration and Colonization of Mars is Alive Again

Peter Lobner

On 25 May 1961, President John F. Kennedy made an important speech to a joint session of Congress in which he stated:

“I believe that this nation should commit itself to achieving the goal, before this decade is out, of landing a man on the moon and returning him safely to the Earth.”

This was a very bold statement considering the state-of-the-art of U.S. aerospace technology in mid-1961. Yuri Gagarin became the first man to orbit the Earth on 12 April 1961 in a Soviet Vostok spacecraft and Alan Shepard completed the first Project Mercury suborbital flight on 5 May 1961. No American had yet flown in orbit. It wasn’t until 20 February 1962 that the first Project Mercury capsule flew into Earth orbit with astronaut John Glenn. The Soviets had hit the Moon with Luna 2 and returned photos from the backside of the moon with Luna 3. The U.S had only made one distant lunar flyby with the tiny Pioneer 4 spacecraft. The Apollo manned lunar program was underway, but still in the concept definition phase. The first U.S. heavy booster rocket designed to support the Apollo program, the Saturn 1, didn’t fly until 27 October 1961.

President Kennedy concluded this part of his 25 May 1961 speech with the following admonition:

“This decision (to proceed with the manned lunar program) demands a major national commitment of scientific and technical manpower, materiel and facilities, and the possibility of their diversion from other important activities where they are already thinly spread. It means a degree of dedication, organization and discipline, which have not always characterized our research and development efforts. It means we cannot afford undue work stoppages, inflated costs of material or talent, wasteful interagency rivalries, or a high turnover of key personnel.

New objectives and new money cannot solve these problems. They could in fact, aggravate them further–unless every scientist, every engineer, every serviceman, every technician, contractor, and civil servant gives his personal pledge that this nation will move forward, with the full speed of freedom, in the exciting adventure of space.”

This was the spirit that lead to the great success of the Apollo program, which landed the first men on the Moon, astronauts Neil Armstrong and Ed Aldrin, on 20 July 1969; a little more than 8 years after President Kennedy’s speech.

NASA’s plans for manned Mars exploration

By 1964, exciting concepts for manned Mars exploration vehicles were being developed under National Aeronautics and Space Administration (NASA) contract by several firms. One example is a Mars lander design shown below from Aeronutronic (then a division of Philco Corp). A Mars Excursion Module (MEM) would descend to the surface of Mars from a larger Mars Mission Module (MMM) that remained in orbit. The MEM was designed for landing a crew of three on Mars, spending 40 days on the Martian surface, and then returning the crew back to Mars orbit and rendezvousing with the MMM for the journey back to Earth.

1963 Aeronutronic Mars lander concept
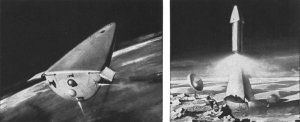
Source: NASA / Aviation Week 24Feb64

This and other concepts developed in the 1960s are described in detail in Chapters 3 – 5 of NASA’s Monograph in Aerospace History #21, “Humans to Mars – Fifty Years of Mission Planning, 1950 – 2000,” which you can download at the following link:

http://www.nss.org/settlement/mars/2001-HumansToMars-FiftyYearsOfMissionPlanning.pdf

In the 1960’s the U.S. nuclear thermal rocket development program led to the development of the very promising NERVA nuclear engine for use in an upper stage or an interplanetary spacecraft. NASA and the Space Nuclear Propulsion Office (SNPO) felt that tests had “confirmed that a nuclear rocket engine was suitable for space flight application.”

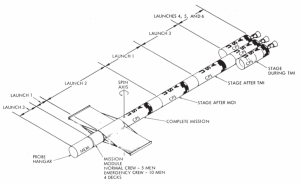
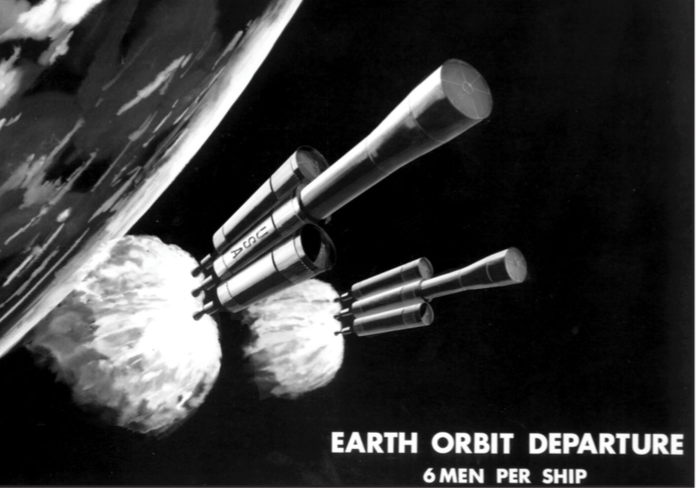
In 1969, Marshall Space Flight Director Wernher von Braun propose sending 12 men to Mars aboard two rockets, each propelled by three NERVA engines. This spacecraft would have measured 270 feet long and 100 feet wide across the three nuclear engine modules, with a mass of 800 tons, including 600 tons of liquid hydrogen propellant for the NERVA engines. The two outboard nuclear engine modules only would be used to inject the spacecraft onto its trans-Mars trajectory, after which they would separate from the spacecraft. The central nuclear engine module would continue with the manned spacecraft and be used to enter and leave Mars orbit and enter Earth orbit at the end of the mission. The mission would launch in November 1981 and land on Mars in August 1982.

Marshall 1969 NERVA mars missionNERVA-powered Mars spacecraft. Source: NASA / Monograph #21

NASA’s momentum for conducting a manned Mars mission by the 1980s was short-lived. Development of the super heavy lift Nova booster, which was intended to place about 250 tons to low Earth orbit (LEO), was never funded. Congress reduced NASA’s funding in the FY-69 budget, resulting in NASA ending production of the Saturn 5 heavy-lift booster rocket (about 100 tons to LEO) and cancelling Apollo missions after Apollo 17. This left NASA without the heavy-lift booster rocket needed to carry NERVA and/or assembled interplanetary spacecraft into orbit.

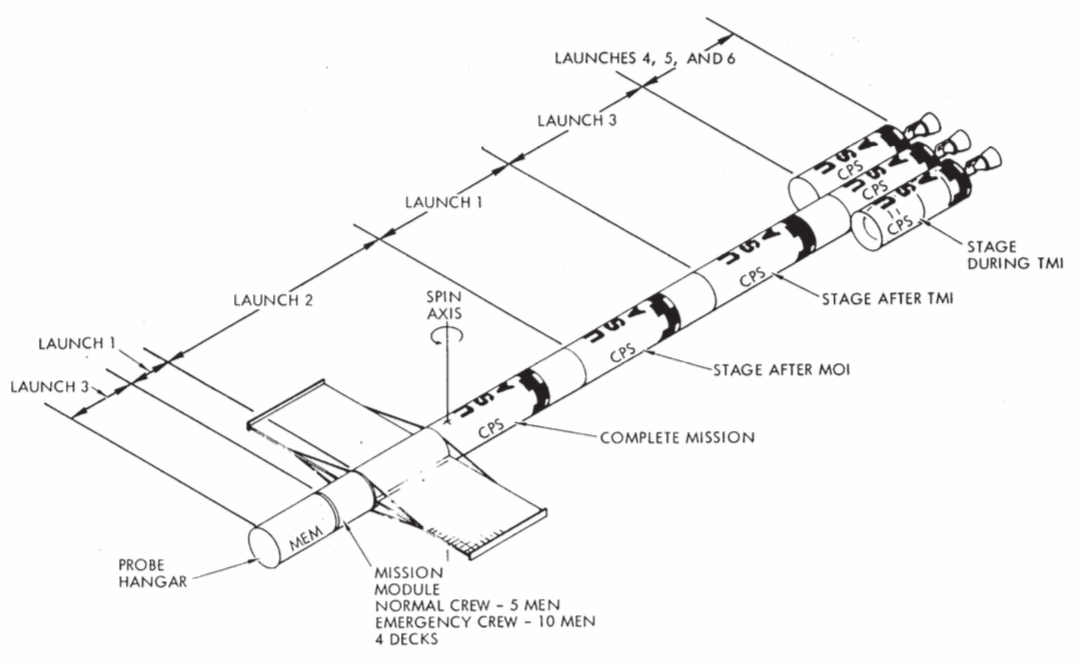
NASA persevered with chemical rocket powered Mars mission concepts until 1971. The final NASA concept vehicle from that era, looking much like von Braun’s 1969 nuclear-powered spacecraft, is shown below.

NASA 1971 mars concept

Source: NASA / Monograph #21

The 24-foot diameter modules would have required six Shuttle-derived launch vehicles (essentially the large center tank and the strap-in solid boosters, without the Space Shuttle itself) to deliver the various modules for assembly in orbit.

While no longer a factor in Mars mission planning, the nuclear rocket program was canceled in 1972. You can read a history of the U.S. nuclear thermal rocket program at the following links:

http://www.lanl.gov/science/NSS/issue1_2011/story4full.shtml

and,

http://ntrs.nasa.gov/archive/nasa/casi.ntrs.nasa.gov/19910017902.pdf

NASA budget realities in subsequent years, dictated largely by the cost of Space Shuttle and International Space Station development and operation, reduced NASA’s manned Mars efforts to a series of design studies, as described in the Monograph #21.

Science Applications International Corporation (SAIC) conducted manned Mars mission studies for NASA in 1984 and 1987. The latter mission design study was conducted in collaboration with astronaut Sally Ride’s August 1987 report, Leadership and America’s Future in Space. You can read this report at the following link.

http://history.nasa.gov/riderep/cover.htm

Details on the 1987 SAIC mission study are included in Chapter 8 of the Monograph #21. SAIC’s mission concept employed two chemically-fueled Mars spacecraft in “split/sprint” roles. An automated cargo-carrying spacecraft would be first to depart Earth. It would fly an energy-saving trajectory and enter Mars orbit carrying the fuel needed by the future manned spacecraft for its return to Earth. After the cargo spacecraft was in Mars orbit, the manned spacecraft would be launched on a faster “sprint” trajectory, taking about six months to get to Mars. With one month allocated for exploration of the Martian surface, total mission time would be on the order of 12 – 14 months.

President Obama’s FY-11 budget redirected NASA’s focus away from manned missions to the Moon and Mars. The result is that there are no current programs with near-term goals to establish a continuous U.S. presence on the Moon or conduct the first manned mission to Mars. Instead, NASA is engaged in developing hardware that will be used initially for a relatively near-Earth (but further out than astronauts have gone before) “asteroid re-direct mission.” NASA’s current vision for getting to Mars is summarized below.

  • In the 2020s, NASA will send astronauts on a year-long mission into (relatively near-Earth) deep space, verifying spacecraft habitation and testing our readiness for a Mars mission.
  • In the 2030s, NASA will send astronauts first to low-Mars orbit. This phase will test the entry, descent and landing techniques needed to get to the Martian surface and study what’s needed for in-situ resource utilization.
  • Eventually, NASA will land humans on Mars.

You can read NASA’s Journey to Mars Overview at the following link:

https://www.nasa.gov/content/journey-to-mars-overview

NASA’s current plans for getting to Mars don’t really sound like much of a plan to me. Think back to President Kennedy’s speech that outlined the national commitment needed to accomplish a lunar landing within the decade of the 1960s. There is no real sense of timeliness in NASA plans for getting to Mars.

Thinking back to the title of NASA’s Monograph #21, “Humans to Mars – Fifty Years of Mission Planning, 1950 – 2000,” I’d say that NASA is quite good at manned Mars mission planning, but woefully short on execution. I recognize that NASA’s ability to execute anything is driven by its budget. However, in 1969, Wernher von Braun thought the U.S. was about 12 years from being able to launch a nuclear-powered manned Mars mission in 1981. Now it seems we’re almost 20 years away, with no real concept for the spacecraft that will get our astronauts there and back.

Commercial plans for manned Mars exploration

Fortunately, the U.S. commercial aerospace sector seems more committed to conducting manned Mars missions than NASA. The leading U.S. contenders are Bigelow Aerospace and SpaceX. Let’s look at their plans.

Bigelow Aerospace

Bigelow is developing expandable structures that can be used to house various types of occupied spaces on manned Earth orbital platforms or on spacecraft destined for lunar orbital missions or long interplanetary missions. Versions of these expandable structures also can be used for habitats on the surface of the Moon, Mars, or elsewhere.

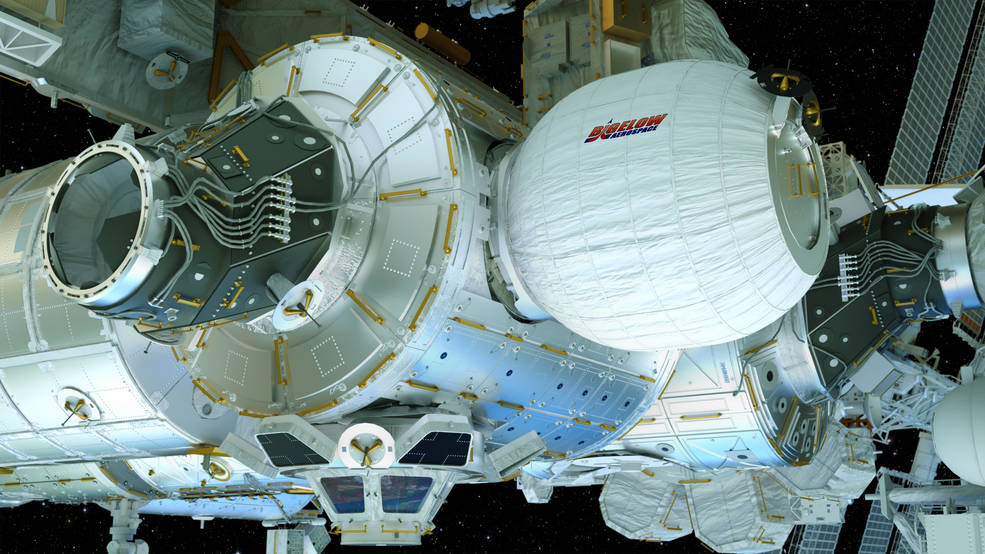
The first operational use of this type of expandable structure in space occurred on 26 May 2016, when the BEAM (Bigelow Expandable Activity Module) was deployed to its full size on the International Space Station (ISS). BEAM was expanded by air pressure from the ISS.

Bigelow BEAMBEAM installed in the ISS. Source: Bigelow Aerospace

You can view a NASA time-lapse video of BEAM deployment at the following link:

https://www.youtube.com/watch?v=QxzCCrj5ssE

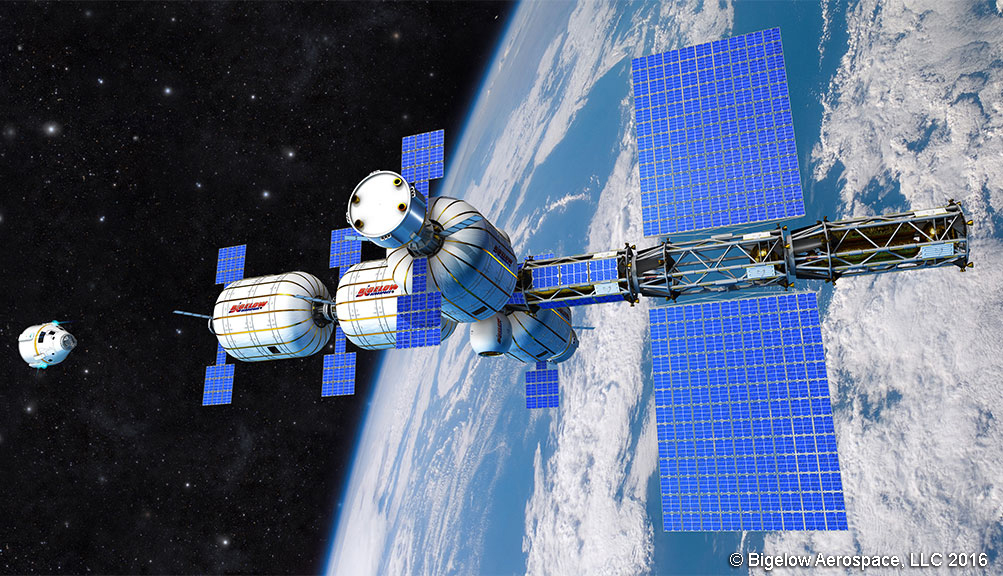
A large, complex space vehicle can be built with a combination of relatively conventional structures and Bigelow inflatable modules, as shown in the following concept drawing.

Bigelow spacecraft conceptSource: Bigelow Aerospace

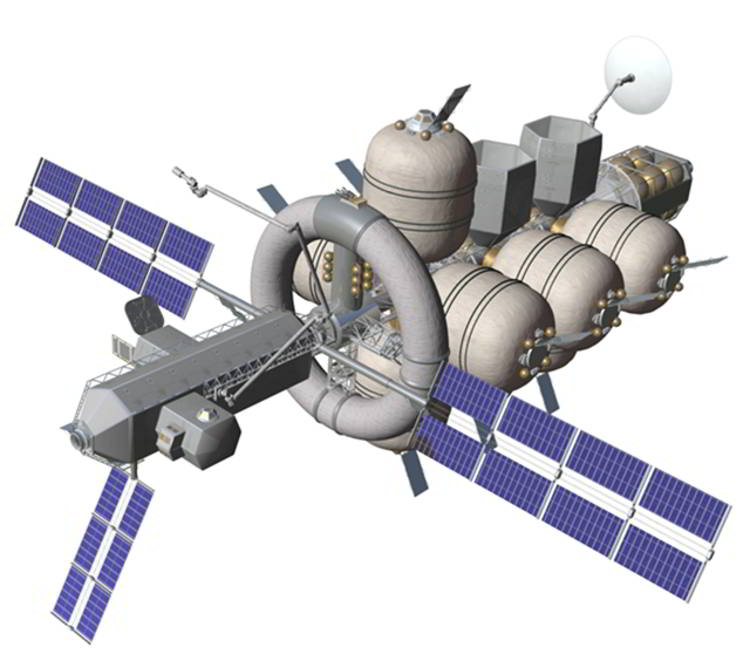
A 2011 NASA concept named Nautilus-X, also making extensive use of inflatable structures, is shown in the following concept drawing. Nautilus is an acronym for Non-Atmospheric Universal Transport Intended for Lengthy United States Exploration.

NASA Nautilus-X-space-exploration-vehicle-concept-1

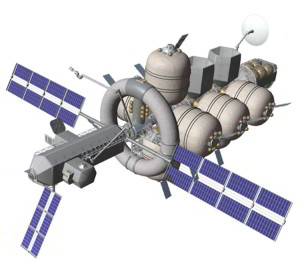
Source: NASA / NASA Technology Applications Assessment Team

SpaceX

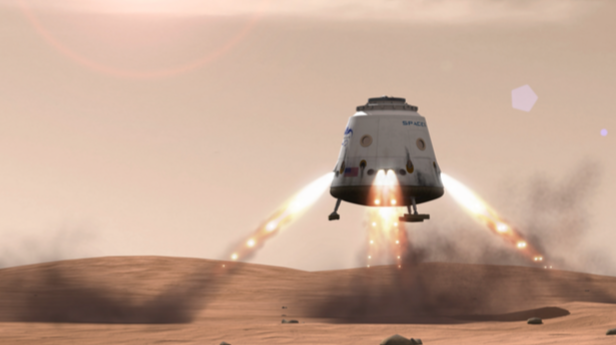
SpaceX announced that it plans to send its first Red Dragon capsule to Mars in 2018 to demonstrate the ability to land heavy loads using a combination of aero braking with the capsule’s ablative heat shield and propulsive braking using rocket engines for the final phase of landing.

Red Dragon landing on MarsSource: SpaceX

More details on the Red Dragon spacecraft are in a 2012 paper by Karcs, J. et al., entitled, “Red Dragon: Low-cost Access to the Surface of Mars Using Commercial Capabilities,” which you’ll find at the following link:

https://www.nas.nasa.gov/assets/pdf/staff/Aftosmis_M_RED_DRAGON_Low-Cost_Access_to_the_Surface_of_Mars_Using_Commercial_Capabilities.pdf

NASA is collaborating with SpaceX to gain experience with this landing technique, which NASA expects to employ in its own future Mars missions.

On 27 September 2016, SpaceX CEO Elon Musk unveiled his grand vision for colonizing Mars at the 67th International Astronautical Congress in Guadalajara, Mexico. You’ll find an excellent summary in the 29 September 2016 article by Dave Mosher entitled, “Elon Musk’s complete, sweeping vision on colonizing Mars to save humanity,” which you can read on the Business Insider website at the following link:

http://www.businessinsider.com/elon-musk-mars-speech-transcript-2016-9

The system architecture for the SpaceX colonizing flights is shown in the following diagram. Significant features include:

  • 100 passengers on a one-way trip to Mars
  • Booster and spacecraft are reusable
  • No spacecraft assembly in orbit required.
  • The manned interplanetary vehicle is fueled with methane in Earth orbit from a tanker spacecraft.
  • The entire manned interplanetary vehicle lands on Mars. There is no part of the vehicle left orbiting Mars.
  • The 100 passengers disembark to colonize Mars
  • Methane fuel for the return voyage to Earth is manufactured on the surface of Mars.
  • The spacecraft returns to Earth for reuse on another mission.
  • Price per person for Mars colonists could be in the $100,000 to $200,000 range.

The Mars launcher for this mission would have a gross lift-off mass of 10,500 tons; 3.5 times the mass of NASA’s Saturn 5 booster for the Apollo Moon landing program.
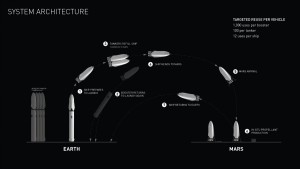
SpaceX colonist architectureSource: SpaceX

 Terraforming Mars

Colonizing Mars will require terraforming to transform the planet so it can sustain human life. Terraforming the hostile environment of another planet has never been done before. While there are theories about how to accomplish Martian terraforming, there currently is no clear roadmap. However, there is a new board game named, “Terraforming Mars,” that will test your skills at using limited resources wisely to terraform Mars.

Nate Anderson provides a detailed introduction to this board game in his 1 October 2016 article entitled, “Terraforming Mars review: Turn the ‘Red Planet’ green with this amazing board game,” which you can read at the following link:

http://arstechnica.com/gaming/2016/10/terraforming-mars-review/?utm_source=howtogeek&utm_medium=email&utm_campaign=newsletter

71RW5ZM0bBL._SL1000_Source: Stronghold GamesTerraforming Mars gameboard
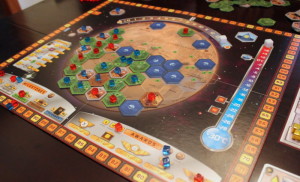
Source: Nate Anderson / arsTECHNICA

Nate Anderson described the game as follows:

“In Terraforming Mars, you play one of several competing corporations seeking to terraform the Red Planet into a livable—indeed, hospitable—place filled with cows, dogs, fish, lichen, bacteria, grasslands, atmosphere, and oceans. That goal is achieved when three things happen: atmospheric oxygen rises to 14 percent, planetary temperature rises to 8°C, and all nine of the game’s ocean tiles are placed.

Real science rests behind each of these numbers. The ocean tiles each represent one percent coverage of the Martian surface; once nine percent of the planet is covered with water, Mars should develop its own sustainable hydrologic cycle. An atmosphere of 14 percent oxygen is breathable by humans (though it feels like a 3,000 m elevation on Earth). And at 8°C, water will remain liquid in the Martian equatorial zone.

Once all three milestones have been achieved, Mars has been successfully terraformed, the game ends, and scores are calculated.”

The players are competing corporations, each with limited resources. The game play evolves based how each player (corporation) chooses to spend their resources to build their terraforming engines (constrained by some rules of precedence), and the opportunities dealt to them in each round.

You can buy the game Terraforming Mars on Amazon.

So, before you sign up with SpaceX to become a Martian colonist, practice your skills at terraforming Mars. You’ll be in high demand as an expert terraformer when you get to Mars on a SpaceX colonist ship in the late 2020s.

India and Pakistan’s Asymmetrical Nuclear Weapons Doctrines Raise the Risk of a Regional Nuclear War With Global Consequences

Peter Lobner

The nuclear weapons doctrines of India and Pakistan are different. This means that these two countries are not in sync on the matters of how and when they might use nuclear weapons in a regional military conflict. I’d like to think that cooler heads would prevail during a crisis and use of nuclear weapons would be averted. In light of current events, there may not be enough “cooler heads” on both sides in the region to prevail every time there is a crisis.

Case in point: In late September 2016, India announced it had carried out “surgical strikes” (inside Pakistan) on suspected militants preparing to infiltrate from the Pakistan-held part of Kashmir into the Indian-held part of that state. Responding to India’s latest strikes, Pakistan’s Defense Minister, Khawaja Muhammad Asif, has been reported widely to have made the following very provocative statement, which provides unsettling insights into Pakistan’s current nuclear weapons doctrine:

“Tactical weapons, our programs that we have developed, they have been developed for our protection. We haven’t kept the devices that we have just as showpieces. But if our safety is threatened, we will annihilate them (India).”

You can see a short Indian news video on this matter at the following link:

http://shoebat.com/2016/09/29/pakistan-defense-minister-threatens-to-wipe-out-india-with-a-nuclear-attack-stating-we-will-annihilate-india/

 1. Asymmetry in nuclear weapons doctrines

There are two recent papers that discuss in detail the nuclear weapons doctrines of India and Pakistan. Both papers address the issue of asymmetry and its operational implication. However, the papers differ a bit on the details of the nuclear weapons doctrines themselves. I’ll start by briefly summarizing these papers and using them to synthesize a short list of the key points in the respective nuclear weapons doctrines.

The first paper, entitled “India and Pakistan’s Nuclear Doctrines and Posture: A Comparative Analysis,” by Air Commodore (Retired) Khalid Iqbal, former Assistant Chief of Air Staff, Pakistan Air Force was published in Criterion Quarterly (Islamabad), Volume 11, Number 3, Jul-Sept 2016. The author’s key points are:

“Having preponderance in conventional arms, India subscribed to ‘No First Use’ concept but, soon after, started diluting it by attaching conditionalities to it; and having un-matching conventional capability, Pakistan retained the options of ‘First Use.’. Ever since 1998, doctrines of both the countries are going through the pangs of evolution. Doctrines of the two countries are mismatched. India intends to deter nuclear use by Pakistan while Pakistan’s nuclear weapons are meant to compensate for conventional arms asymmetry.”

You will read Khalid Iqbal’s complete paper at the following link:

https://www.academia.edu/28382385/India_and_Pakistans_Nuclear_Doctrines_and_Posture_A_Comparative_Analysis

The second paper, entitled “A Comparative Study of Nuclear Doctrines of India and Pakistan,” by Amir Latif appeared in the June 2014, Vol. 2, No. 1 issue of Journal of Global Peace and Conflict. The author provides the following summary (quoted from a 2005 paper by R. Hussain):

“There are three main attributes of the Pakistan’s undeclared nuclear doctrine. It has three distinct policy objectives: a) deter a first nuclear use by India; b) enable Pakistan to deter Indian conventional attack; c) allow Islamabad to “internationalize the crisis and invite outside intervention in the unfavorable circumstance.”

You can read Amir Latif’s complete paper at the following link

http://jgpcnet.com/journals/jgpc/Vol_2_No_1_June_2014/7.pdf

Synopsis of India’s nuclear weapons doctrine

India published its official nuclear doctrine on 4 January 2003. The main points related to nuclear weapons use are the following.

  1. India’s nuclear deterrent is directed toward Pakistan and China.
  2. India’s will build and maintain a credible minimum deterrent against those nations.
  3. India’s adopted a “No First Use” policy, subject to the following caveats:
    • India may use nuclear weapons in retaliation after a nuclear attack on its territory or on its military forces (wherever they may be).
    • In the event of a major biological or chemical attack, India reserves the option to use nuclear weapons.
  4. Only the civil political leadership (the Nuclear Command Authority) can authorize nuclear retaliatory attacks.
  5. Nuclear weapons will not be used against non-nuclear states (see caveat above regarding chemical or bio weapon attack).

Synopsis of Pakistan’s nuclear weapons doctrine

Pakistan does not have an officially declared nuclear doctrine. Their doctrine appears to be based on the following points:

  1. Pakistan’s nuclear deterrent is directed toward India.
  2. Pakistan will build and maintain a credible minimum deterrent.
    • The sole aim of having these weapons is to deter India from aggression that might threaten Pakistan’s territorial integrity or national independence / sovereignty.
    • Size of the deterrent force is enough inflict unacceptable damage on India with strikes on counter-value targets.
  3. Pakistan has not adopted a “No First Use” policy.
    • Nuclear weapons are essential to counter India’s conventional weapons superiority.
    • Nuclear weapons reestablish an overall Balance of Power, given the unbalanced conventional force ratios between the two sides (favoring India).
  4. National Command Authority (NCA), comprising the Employment Control Committee, Development Control Committee and Strategic Plans Division, is the center point of all decision-making on nuclear issues.
  5. Nuclear assets are considered to be safe, secure and almost free from risks of improper or accidental use.

The nuclear weapons doctrine asymmetry between India and Pakistan really boils down to this:

 India’s No First Use policy (with some caveats) vs. Pakistan’s policy of possible first use to compensate for conventional weapons asymmetry.

2. Nuclear tests and current nuclear arsenals

India

India tested its first nuclear device on 18 May 1974. Twenty-four years later, in mid-1998, tests of three devices were conducted, followed two days later by two more tests. All of these tests were low-yield, but multiple weapons configurations were tested in 1998.

India’s current nuclear arsenal is described in a paper by Hans M. Kristensen and Robert S. Norris entitled, “Indian Nuclear Forces, 2015,” which was published online on 27 November 2015 in the Bulletin of Atomic Scientists, Volume 71 at the following link:

http://www.tandfonline.com/doi/full/10.1177/0096340215599788

In this paper, authors Kristensen and Norris make the following points regarding India’s nuclear arsenal.

  • India is estimated to have produced approximately 540 kg of weapon-grade plutonium, enough for 135 to 180 nuclear warheads, though not all of that material is being used.
  • India has produced between 110 and 120 nuclear warheads.
  • The country’s fighter-bombers are the backbone of its operational nuclear strike force.
  • India also has made considerable progress in developing land-based ballistic missile and cruise missile delivery systems.
  • India is developing a nuclear-powered missile submarine and is developing sea-based ballistic missile (and cruise missile) delivery systems.

Pakistan

Pakistan is reported to have conducted many “cold” (non-fission) tests in March 1983. Shortly after the last Indian nuclear tests, Pakistan conducted six low-yield nuclear tests in rapid succession in late May 1998.

On 1 August 2016, the Congressional Research Service published the report, “Pakistan’s Nuclear Weapons,” which provides an overview of Pakistan’s nuclear weapons program. You can download this report at the following link:

https://www.fas.org/sgp/crs/nuke/RL34248.pdf

An important source for this CRS report was another paper by Hans M. Kristensen and Robert S. Norris entitled, “Pakistani Nuclear Forces, 2015,” which was published online on 27 November 2015 in the Bulletin of Atomic Scientists, Volume 71 at the following link:

http://www.tandfonline.com/doi/full/10.1177/0096340215611090

In this paper, authors Kristensen and Norris make the following points regarding Pakistan’s nuclear arsenal.

  • Pakistan has a nuclear weapons stockpile of 110 to 130 warheads.
  • As of late 2014, the International Panel on Fissile Materials estimated that Pakistan had an inventory of approximately 3,100 kg of highly enriched uranium (HEU) and roughly 170kg of weapon-grade plutonium.
  • The weapons stockpile realistically could grow to 220 – 250 warheads by 2025.
  • Pakistan has several types of operational nuclear-capable ballistic missiles, with at least two more under development.

3. Impact on global climate and famine of a regional nuclear war between India and Pakistan

On their website, the organization NuclearDarkness presents the results of analyses that attempt to quantify the effects on global climate of a nuclear war, based largely on the quantity of smoke lofted into the atmosphere by the nuclear weapons exchange. Results are presented for three cases: 5, 50 and 150 million metric tons (5, 50 and 150 Teragrams, Tg). The lowest case, 5 million tons, represents a regional nuclear war between India and Pakistan, with both sides using low-yield nuclear weapons. A summary of the assessment is as follows:

“Following a war between India and Pakistan, in which 100 Hiroshima-size (15 kiloton) nuclear weapons are detonated in the large cities of these nations, 5 million tons of smoke is lofted high into the stratosphere and is quickly spread around the world. A smoke layer forms around both hemispheres which will remain in place for many years to block sunlight from reaching the surface of the Earth. One year after the smoke injection there would be temperature drops of several degrees C within the grain-growing interiors of Eurasia and North America. There would be a corresponding shortening of growing seasons by up to 30 days and a 10% reduction in average global precipitation.”

You will find more details, including a day-to-day animation of the global distribution of the dust cloud for a two-month period after the start of the war, at the following link:

http://www.nucleardarkness.org/warconsequences/fivemilliontonsofsmoke/

In the following screenshots from the animation at the above link, you can see how rapidly the smoke distributes worldwide in the upper atmosphere after the initial regional nuclear exchange.

Regional war cloud dispersion 1

Regional war cloud dispersion 2

Regional war cloud dispersion 3

This consequence assessment on the nucleardarkness.org website is based largely on the following two papers by Robock, A. et al., which were published in 2007:

The first paper, entitled, “Nuclear winter revisited with a modern climate model and current nuclear arsenals: Still catastrophic consequences,” was published in the Journal of Geophysical Research, Vol. 112. The authors offer the following comments on the climate model they used.

“We use a modern climate model to reexamine the climate response to a range of nuclear wars, producing 50 and 150 Tg of smoke, using moderate and large portions of the current global arsenal, and find that there would be significant climatic responses to all the scenarios. This is the first time that an atmosphere-ocean general circulation model has been used for such a simulation and the first time that 10-year simulations have been conducted.”

You can read this paper at the following link:

http://climate.envsci.rutgers.edu/pdf/RobockNW2006JD008235.pdf

The second paper, entitled, “Climatic consequences of regional nuclear conflicts”, was published in Atmospheric Chemistry and Physics, 7, pp. 2003 – 2012. This paper provides the analysis for the 5 Tg case.

“We use a modern climate model and new estimates of smoke generated by fires in contemporary cities to calculate the response of the climate system to a regional nuclear war between emerging third world nuclear powers using 100 Hiroshima-size bombs.”

You can read this paper at the following link:

http://www.atmos-chem-phys.net/7/2003/2007/acp-7-2003-2007.pdf

Building on the work of Roblock, Ira Helhand authored the paper, “An Assessment of the Extent of Projected Global Famine Resulting From Limited, Regional Nuclear War.” His main points with regard to a post-war famine are:

“The recent study by Robock et al on the climatic consequences of regional nuclear war shows that even a “limited” nuclear conflict, involving as few as 100 Hiroshima-sized bombs, would have global implications with significant cooling of the earth’s surface and decreased precipitation in many parts of the world. A conflict of this magnitude could arise between emerging nuclear powers such as India and Pakistan. Past episodes of abrupt global cooling, due to volcanic activity, caused major crop failures and famine; the predicted climate effects of a regional nuclear war would be expected to cause similar shortfalls in agricultural production. In addition large quantities of food might need to be destroyed and significant areas of cropland might need to be taken out of production because of radioactive contamination. Even a modest, sudden decline in agricultural production could trigger significant increases in the prices for basic foods and hoarding on a global scale, both of which would make food inaccessible to poor people in much of the world. While it is not possible to estimate the precise extent of the global famine that would follow a regional nuclear war, it seems reasonable to postulate a total global death toll in the range of one billion from starvation alone. Famine on this scale would also lead to major epidemics of infectious diseases, and would create immense potential for war and civil conflict.”

You can download this paper at the following link:

http://www.psr.org/assets/pdfs/helfandpaper.pdf

 4. Conclusions

The nuclear weapons doctrines of India and Pakistan are not in sync on the matters of how and when they might use nuclear weapons in a regional military conflict. The highly sensitive region of Kashmir repeatedly has served as a flashpoint for conflicts between India and Pakistan and again is the site of a current conflict. If the very provocative recent statements by Pakistan’s Defense Minister, Khawaja Muhammad Asif, are to be believed, then there are credible scenarios in which Pakistan makes first use of low-yield nuclear weapons against India’s superior conventional forces.

The consequences to global climate from this regional nuclear conflict can be quite significant and lasting, with severe impacts on global food production and distribution. With a bit of imagination, I’m sure you can piece together a disturbing picture of how an India – Pakistan regional nuclear conflict can evolve into a global disaster.

Let’s hope that cooler heads in that region always prevail.

Rosetta Spacecraft Lands on Comet 67P, Completing its 12-Year Mission

Peter Lobner

The European Space Agency (ESA) launched the Rosetta mission in 2004. After its long journey from Earth, followed by 786 days in orbit around comet 67P / Churyumov–Gerasimenko, the Rosetta spacecraft managers maneuvered the spacecraft out of its orbit and directed it to a “hard” landing on the “head” (the smaller lobe) of the comet.

Comet_67P_15_April_2015Comet 67P. Source: ESA – European Space Agency

The descent path, which started from an altitude of 19 km (11.8 miles), was designed to bring Rosetta down in the vicinity of active pits that had been observed from higher altitude earlier in the mission. ESA noted:

  • The descent gave Rosetta the opportunity to study the comet’s gas, dust and plasma environment very close to its surface, as well as take very high-resolution images.
  • Pits are of particular interest because they play an important role in the comet’s activity (i.e., venting gases to space).

The spacecraft impacted at a speed of about 90 cm/sec (about 2 mph) at 11:19 AM GMT (4:19 AM PDT) on 30 September 2016. I stayed up in California to watch the ESA’s live stream of the end of this important mission. I have to say that the live stream was not designed as a media event. As the landing approached, only a few close-up photos of the surface were shown, including the following photo taken from an altitude of about 5.7 km (3.5 miles).

Comet 67P 30Sep2016Source: ESA – European Space Agency

At the appointed moment, touchdown was marked by the loss of the telemetry signal from Rosetta. ESA said that the Rosetta spacecraft contained a message in many languages for some future visitor to 67P to find.

You can read the ESA’s press release on the end of the Rosetta mission at the following link:

http://www.esa.int/For_Media/Press_Releases/Mission_complete_Rosetta_s_journey_ends_in_daring_descent_to_comet

Some of the key Rosetta mission findings reported by ESA include:

  • Comet 67P likely was “born” in a very cold region of the protoplanetary nebula when the Solar System was still forming more than 4.5 billion years ago.
  • The comet’s two lobes probably formed independently, joining in a low-speed collision in the early days of the Solar System.
  • The comet’s shape influences its “seasons,” which are characterized by variations in dust moving across its surface and variations in the density and composition of the coma, the comet’s ‘atmosphere’.
  • Gases streaming from the comet’s nucleus include molecular oxygen and nitrogen, and water with a different ‘flavor’ than water in Earth’s oceans.
    • 67P’s water contains about three times more deuterium (a heavy form of hydrogen) than water on Earth.
    • This suggests that comets like Rosetta’s may not have delivered as much of Earth’s water as previously believed.
  • Numerous inorganic chemicals and organic compounds were detected by Rosetta (from orbit) and the Philae lander (on the surface). These include the amino acid glycine, which is commonly found in proteins, and phosphorus, a key component of DNA and cell membranes.

Analysis of data from the Rosetta mission will continue for several years. It will be interesting to see how our understanding of comet 67P and similar comets evolve in the years ahead.

For more information on the Rosetta mission, visit the ESA’s Rosetta website at the following link:

http://sci.esa.int/rosetta/

Also see my following postings: 24 August 2016, “Exploring Microgravity Worlds,” and 6 September 2016, “Philae Found in a Rocky Ditch on Comet 67P/Churyumov-Gerasimenko.”

Atacama Large Millimeter / submillimeter Array (ALMA) Provides a Unique Window on the Universe

Peter Lobner

The Atacama Large Millimeter / submillimeter Array (ALMA) is a single telescope composed of 66 high-precision, 12-meter antennas. ALMA operates at wavelengths of 0.3 to 9.6 millimeters. As shown in the following chart, this puts ALMAs observing range around the boundary between microwave and infrared.

wavelength-spectrum1Source: physics.tutorvista.com

This enables ALMA’s users to examine “cold” regions of the universe, which are optically dark but radiate brightly in the millimeter / submillimeter portions of the electromagnetic spectrum. In that frequency range, ALMA is a complete astronomical imaging and spectroscopic instrument with a resolution better than the Hubble Space Telescope.

The ALMA Array Operations Site (AOS) is located on the Chajnantor plateau (which in the local Atacameño language, Kunza, means “place of departure”), at an elevation of about 5,000 meters (16,400 feet) above sea level in northern Chile.

ALMA_AOSView of the AOS. Source: ESO

On 30 September 2013 the last of the 66 antennas, each of which weighs more than 100 tons, was delivered to the AOS on the giant transporter named Otto (one of two available for the task) and handed over to the ALMA Observatory. The 12 meter antennas have reconfigurable baselines ranging from 15 meters to 18 km. Depending on what is being observed, the transporters can move ALMA antennas to establish the desired array. The transporters carry power generators to maintain the cryogenic systems needed to ensure that the antenna continues functioning during transport.

ALMA_antenna on transporterSource: ESOalma_antennas_nrao04bSource: ESO

ALMA is managed by an international partnership  of the European Southern Observatory (ESO), the U.S. National Science Foundation (NSF) and the National Institutes of Natural Sciences (NINS) of Japan, together with NRC (Canada), NSC and ASIAA (Taiwan), and KASI (Republic of Korea), in cooperation with the Republic of Chile.

The ALMA telescope is operated from the Operations Support Facilities (OSF), which is located at a considerable distance from the telescope at an elevation of about 2,900 meters (9,500 feet). The OSF also served as the Assembly, Integration, Verification, and Commissioning (AIVC) station for all the antennas and other high technology equipment before they were moved to the AOS.

The ALMA website is at the following link:

http://www.almaobservatory.org

You’ll find many downloadable ALMA-related documents on the Publications tab of this website. A good overview of the ALMA telescope and the design of the individual antennas is available at:

http://www.almaobservatory.org/images/pdfs/alma_brochure_explore_2007.pdf

ALMA press releases, with details of on many of interesting observations being made at the observatory are at the following link:

http://www.almaobservatory.org/en/press-room/press-releases

An example of the type of remarkable observations being made with ALMA is in the 16 July 2016 press release, ALMA Observes First Protoplanetary Water Snow Line Thanks to Stellar Outburst.”

“This line marks where the temperature in the disk surrounding a young star drops sufficiently low for snow to form. A dramatic increase in the brightness of the young star V883 Orionis flash heated the inner portion of the disk, pushing the water snow line out to a far greater distance than is normal for a protostar, and making it possible to observe it for the first time.”

ALMA was looking in the right place at the right time. An artist’s impression of the water-snow line around V883 Orionis is shown in the ESO image below.

eso1626aCredit: A. Angelich (NRAO/AUI/NSF)/ALMA (ESO/NAOJ/NRAO)

You can read this ALMA press release and view a short video simulation of the event at the following link:

http://www.eso.org/public/usa/news/eso1626/

No doubt ALMA’s unique capabilities will continue to expand our knowledge of the universe in the millimeter / submillimeter portions of the electromagnetic spectrum. In collaboration with great land-based and space-based observatories operating in other portions of the spectrum, ALMA will help create a more comprehensive understanding of our universe. See my 6 March 2016 post, Remarkable Multispectral View of Our Milky Way Galaxy,” to see how different a portion of the night sky can look in different portions of the electromagnetic spectrum.

Is it Possible to Attribute Specific Extreme Weather Events to Global Climate Change?

Peter Lobner

On 7 September 2016, the National Oceanic and Atmospheric Administration (NOAA) reported that climate change increased the chance of record rains in Louisiana by at least 40%. This finding was based on a rapid assessment conducted by NOAA and partners after unusually severe and prolonged rains affected a broad area of Louisiana in August 2016. You can read this NOAA news release at the following link:

http://www.noaa.gov/media-release/climate-change-increased-chances-of-record-rains-in-louisiana-by-at-least-40-percent

NOAA reported that models indicated the following:

  • The return period for extreme rain events of the magnitude of the mid-August 2016 downpour in Louisiana has decreased from an average of 50 years to 30 years.
  • A typical 30-year event in 1900 would have had 10% less rain than a similar event today; for example, 23 inches instead of 25 inches.

NOAA notes that “return intervals” are statistical averages over long periods of time, which means that it’s possible to have more than one “30-year event” in a 30-year period.

NOAA Lousiana Aug2016 extreme rain graphSource: NOAA

In their news release NOAA included the following aerial photos of Denham Springs, Louisiana. The photo on the left was at the height of the flooding on August 15, 2016. The photo on the right was taken three days later when floodwaters had receded.

NOAA Lousiana Aug2016 extreme rain photosSource: NOAA / National Geodetic Survey

World Weather Attribution (WWA) is an international effort that is, “designed to sharpen and accelerate the scientific community’s ability to analyze and communicate the possible influence of climate change on extreme-weather events such as storms, floods, heat waves and droughts”. Their website is at the following link:

https://wwa.climatecentral.org

WWA attempts to address the question: “Did climate change have anything to do with this?” but on their website, WWA cautions:

“Scientists are now able to answer this for many types of extremes. But the answer may vary depending on how the question is framed……..it is important for every extreme event attribution study to clearly define the event and state the framing of the attribution question.”

To get a feeling for how they applied this principal, you can read the WWA report, “Louisiana Downpours, August 2016,” at the following link:

https://wwa.climatecentral.org/analyses/louisiana-downpours-august-2016/

I find this report quite helpful in putting the Louisiana extreme precipitation event in perspective. I object to the reference to “human-caused climate change,” in the report because the findings should apply regardless of the source of the observed change in climate between 1900 and 2016.

On the WWA website, you can easily navigate to several other very interesting analyses of extreme weather events, and much more.

The National Academies Press (NAP) recently published the following two reports on extreme weather attribution, both of which are worth your attention.

The first NAP report, “Attribution of Extreme Weather Events in the Context of Climate Change,” applies to the type of rapid assessment performed by NOAA after the August 2016 extreme precipitation event in Louisiana. The basic premise of this report is as follows:

“The media, the public, and decision makers increasingly ask for results from event attribution studies during or directly following an extreme event. To meet this need, some groups are developing rapid and/or operational event attribution systems to provide attribution assessments on faster timescales than the typical research mode timescale, which can often take years.”

NAP Attribution of Severe Weather Events  Source: NAP

If you have established a free NAP account, you can download a pdf copy of this report for free at the following link:

http://www.nap.edu/catalog/21852/attribution-of-extreme-weather-events-in-the-context-of-climate-change

The second NAP report, “Frontiers of Decadal Climate Variability,” addresses a longer-term climate issue. This report documents the results of a September 2015 workshop convened by the National Academies of Sciences, Engineering, and Medicine to examine variability in Earth’s climate on decadal timescales, which they define as 10 to 30 years.

NAP Decadal Climate Variation   Source: NAP

This report puts the importance of understanding decadal climate variability in the following context:

“Many factors contribute to variability in Earth’s climate on a range of timescales, from seasons to decades. Natural climate variability arises from two different sources: (1) internal variability from interactions among components of the climate system, for example, between the ocean and the atmosphere, and (2) natural external forcing (functions), such as variations in the amount of radiation from the Sun. External forcing (functions) on the climate system also arise from some human activities, such as the emission of greenhouse gases (GHGs) and aerosols. The climate that we experience is a combination of all of these factors.

Understanding climate variability on the decadal timescale is important to decision-making. Planners and policy makers want information about decadal variability in order to make decisions in a range of sectors, including for infrastructure, water resources, agriculture, and energy.”

While decadal climate variability is quite different than specific extreme weather events, the decadal variability establishes the underlying climate patterns on which extreme weather events may occur.

You can download a pdf copy of this report for free at the following link:

http://www.nap.edu/catalog/23552/frontiers-in-decadal-climate-variability-proceedings-of-a-workshop

I think it’s fair to say that, in the future, we will be seeing an increasing number of “quick response” attributions of extreme weather events to climate change. Each day in the financial section of the newspaper (Yes, I still get a printed copy of the daily newspaper!), there is an attribution from some source about why the stock market did what it did the previous day. Some days these financial attributions seem to make sense, but other days they’re very much like reading a fortune cookie or horoscope, offering little more than generic platitudes.

Hopefully there will be real science behind attributions of extreme weather events to climate change and the attributors will heed WWA’s caution:

“…it is important for every extreme event attribution study to clearly define the event and state the framing of the attribution question.”

Modernizing the Marine Corps Amphibious Landing Capabilities

Peter Lobner

Updated 7 January 2019 and 15 December 2020

1.  Introduction

The U.S. Marine Corps is taking a two-prong approach to ensure their readiness to conduct forcible amphibious landing operations: (1) modernize the fleet of existing Assault Amphibious Vehicles (AAVs), the 71A, and (2) select the contractor for the next-generation Amphibious Combat Vehicles (ACVs). The firms involved in these programs are Science Applications International Corporation (SAIC) and BAE Systems.

Both the existing Marine AAVs and the new ACVs are capable of open-ocean ship launch and recovery operations from a variety of the Navy’s amphibious warfare ships, such as a landing ship dock (LSD) or landing platform dock (LPD). These ships may be as much as 12 miles (19 km) offshore. After traveling like a small boat toward the shore, maneuvering through the surf line, and landing on the beach, the AAVs and new ACVs operate as land vehicles to deliver troops, cargo, or perform other missions.

AAVs_preparing_to_debark_USS_Gunston_HallCurrent-generation AAV 71As in an LPD well deck. Source: Wikimedia Commons / U.S. Navy091016-N-5148B-052Current-generation AAV 71A disembarking from an LPD well deck into the open ocean. Source: U.S. Navy

The Marine Corps plans to maintain the ability to put 10 amphibious battalions ashore during a forcible landing operation.

Let’s take a look in more detail at the Marine Corps AAV 71A modernization program and the new ACV competition.

2.  The modernized AAV SU

The AAV SU is upgraded version of the existing, venerable Marine Corps AAV 71A, which can carry 25 embarked Marines. The AAV SU incorporates the following modernized systems and survivability upgrades:

  • armor protection on its flat underbelly
  • buoyant ceramic armor on the flanks
  • blast-resistant seats replacing legacy bench seating
  • new engine & transmission; greater horsepower & torque
  • improved water jets propulsors yielding higher speed at sea
  • external fuel tanks, and
  • upgraded vehicle controls and driver interface

Marine AAV 71ACurrent-generation AAV 71A after landing on a beach. Source: okrajoeSAIC AAV SU unveilingUnveiling AAV SU. Source: SAIC

In January 2016, SAIC unveiled the modernized AAV SU at its facility in Charleston SC and delivered the first prototype for testing at U.S. Marine Corps Base Quantico, VA on 4 March 2016. A total of 10 AAV SUs will be tested before the Marine Corps commits to upgrading its entire fleet of 392 AAVs.

Even after ACV deployment, the Marine Corps plans to maintain enough AAV SUs to equip four amphibious battalions.

You can view a Marine Corps video on the AAV survivability upgrade program at the following link:

3. The Next-generation ACV

On 24 November 2015, BAE Systems and SAIC were down-selected from a field of five competitors and awarded contracts to build engineering and manufacturing development prototypes of their respective next-generation ACVs. Both of the winning firms are offering large, eight-wheel drive vehicles that are designed to be more agile and survivable on land than the current AAV, with equal performance on the water.  The ACV is air-transportable in a C-130 Hercules or larger transport aircraft.

Under contracts valued at more than $100 million, BAE Systems and SAIC each will build 16 ACVs to be delivered in the January – April 2017 time frame for test and evaluation. It is expected that a winner will be selected in 2018 and contracted to deliver 204 ACVs starting in 2020. The new ACVs will form six Marine amphibious battalions that are all scheduled to be operational by the summer of 2023.

At the following link, you can view a Marine Corps video on the ACV program and its importance to the Marine’s “service defining” mission of making amphibious landings in contested areas:

BAE Systems ACV: Super AV

In 2011, BAE Systems teamed with the Italian firm Iveco to offer a variant of the Italian 8-wheeled Super AV amphibious vehicle to the Marine Corps.

The BAE version of this diesel-powered vehicle has a top speed of 65 mph (105 kph) on paved roads and 6 knots (6.9 mph, 11 kph) in the water. Its range is 12 miles (19 km) at sea followed by 200 miles on land. Two small shrouded propellers provide propulsion at sea. On land, the “H-drive” system provides power to individual wheels, so the vehicle can continue operating if an individual wheel is damaged or destroyed.

The armored passenger and crew compartments are protected by a V-shaped hull. Individuals are further protected from blast effects by shock-mounted seats.

On 27 September 2016, BAE Systems unveiled their 34-ton Super AV ACV, which normally will carry a crew of three and 11 embarked Marines, with a capability to carry two more for a total of 13 (i.e., a full Marine squad).

BAE Super AV unveiledBAE Super AV ACV unveiled. Source: BAE Systems

You can view a 2014 BAE Systems video on their Super AV at the following link:

https://www.youtube.com/watch?v=9QK7xUtzjA4

SAIC ACV: Terrex 2

SAIC partnered with ST Kinetics, which developed the Terrex amphibious vehicle currently in use by Singapore’s military. This vehicle currently is configured for a crew of three and 11 embarked Marines.

The basic configuration of SAIC’s Terrex 2 is similar to the BAE Super AV: V-shaped hull, shock-mounted seats and other protection for occupants, propeller driven in the water, independent wheel-driven on land, with similar mobility. SAIC’s Terrex 2 can reach speeds of 55 mph on paved roads and 7 knots (8 mph, 12.9 kph) in the open ocean. A Remote Weapon System (machine guns and cannon) and 10 “fusion cameras” allow closed-hatch missions with day/night 360-degree situational awareness.

SAIC Terrex 2 landing on beachSource: SAICSAIC ACVSource: SAIC

You can see a short 2014 SAIC video on their AAV SU upgrade program and their Terrex 2 ACV at the following link:

7 January 2019 Update:  BAE won the ACV competition in June 2018

On 19 June 2018, it was announced that the Marine Corps had selected BAE to build the next generation Amphibious Combat Vehicle and a contract for $198 million for the first 30 ACVs had been awarded to BAE.  These vehicles are due to be delivered in the fall of 2019 for use in Initial Operational Testing & Evaluation (IOT&E). A decision to begin full rate production of the ACV is expected in 2020.

You’ll find more information on the ACV selection and BAE contract award on the Breaking Defense website here:

https://breakingdefense.com/2018/06/bae-beats-upstart-saic-to-build-marine-amphibious-combat-vehicle/

15 December 2020 Update:  BAE Set to Begin Full-Rate Production of the Marines’ New Amphibious Combat Vehicles 

In December 2020, the Marine Corps awarded BAE Systems a contract valued at almost $185 million to start full-rate production of the ACV and deliver the first 36 amphibious combat vehicles. BAE expects that this first-lot order will increase to 72 vehicles in early 2021.  In following years, the Marines have options to order 80 vehicles annually over five years.

The Marine’s new BAE AVC on the beach at Marine Corps Base Camp Pendleton, California. Source: Andrew Cortez / U.S. Marine Corps

You’ll find more information at the following link:

https://www.military.com/daily-news/2020/12/14/marines-new-amphibious-combat-vehicles-set-begin-full-rate-production.html?ESRC=eb_201215.nl

Deadline – Espionage or Innocent Coincidence?

Peter Lobner

The March 1944 issue of Astounding Science Fiction magazine contained a short story by Cleve Cartmill entitled, Deadline, that may, or may not have revealed secrets related to the Manhattan Project. This short story was edited by MIT-educated John W. Campbell Jr.

ASF_March 1944 cover                             Source: Astounding Science Fiction

Cleve Cartmill’s notoriety after the publication of Deadline is described in The Encyclopedia of Science Fiction (http://www.sf-encyclopedia.com/entry/cartmill_cleve):

“He is best remembered in the field for one famous (but untypical) story, “Deadline” (March 1944 Astounding),which described the atomic bomb a year before it was dropped: in this near-future fable, the evil Sixa (i.e., Axis) forces are prevented from dropping the Bomb, and the Seilla (Allies) decline to do so, justly fearing its dread potential. US Security subsequently descended on Astounding, but was persuaded (truthfully) by John W.Campbell Jr that Cartmill had used for his research only material available in public libraries. Cartmill’s prediction made sf fans enormously proud, and the story was made a prime exhibit in the arguments about prediction in sf.”

I’ve been unable to find an online source for the full-text of Deadline, but here’s a sample of the March 1944 text:

“U-235 has been separated in quantity sufficient for preliminary atomic-power research and the like. They get it out of uranium ores by new atomic isotope separation methods; they now have quantities measured in pounds….But they have not brought it together, or any major portion of it. Because they are not at all sure that, once started, it would stop before all of it had been consumed….They could end the war overnight with controlled U-235 bombs……So far, they haven’t worked out any way to control the explosion.”

The status of the Manhattan Project’s nuclear weapons infrastructure at the time that Deadline was published in March 1944 is outlined below.

  • The initial criticality at the world’s first nuclear reactor, the CP-1 pile in Chicago, occurred on 2 December 1942.
  • The initial criticality at the world’s second nuclear reactor, the X-10 Graphite Reactor in Oak Ridge (also known as the Clinton pile and the X-10-pile), and the first reactor designed for continuous operation, occurred 4 November 1943. X-10 produced its first plutonium in early 1944.
  • The initial criticality of the first large-scale production reactor, Hanford B, occurred in September 1944. This was followed by Hanford D in December 1944, and Hanford F in February 1945.
  • Initial operation of the first production-scale thermal diffusion plant (S-50 at Oak Ridge) began in January 1945, delivering 0.8 – 1.4% enriched uranium initially to the Y-12 calutrons, and later to the K-25 gaseous diffusion plant.
  • Initial operation of the first production-scale gaseous diffusion plant (K-25 at Oak Ridge) began operation in February 1945, delivering uranium enriched up to about 23% to the Y-12 calutrons
  • The Y-12 calutrons began operation in February 1945 with feed from S-50, and later from K-25. The calutrons provided uranium at the enrichment needed for the first atomic bombs.
  • The Trinity nuclear test occurred on 16 July 1945
  • The Little Boy uranium bomb was dropped on Hiroshima on 6 August 1945
  • The Fat Man plutonium bomb was dropped on Nagasaki on 9 August 1945

You can read more about of Deadline, including reaction at Los Alamos to this short story, on Wikipedia at the following link:

https://en.wikipedia.org/wiki/Deadline_(science_fiction_story)

You also can download, “The Astounding Investigation: The Manhattan Project’s Confrontation With Science Fiction,” by Albert Berger at the following link:

https://www.gwern.net/docs/1984-berger.pdf

This investigation report, prepared by Astounding Science Fiction, identifies a number of sci-fi stories from 1934 to 1944 that included references to atomic weapons in their story lines, so Deadline was not the first to do so. Regarding the source of the technical information used in Deadline, the investigation report notes:

“However, when questioned as to the source of the technical material in “Deadline,” the references to U-235 separation, and to bomb and fuse design, Cartmill ‘explained that he took the major portion of it directly from letters sent to him by John Campbell…and a minor portion of it from his own general knowledge.’”

While Deadline may have angered many Manhattan Project Military Intelligence senior security officers, neither Cartmill nor Campbell were ever charged with a crime. The investigation noted that stories like Deadline could cause unwanted public speculation about actual classified projects. In addition, such stories might help people working in compartmented classified programs to get a better understanding of the broader context of their work.

I don’t think there was any espionage involved, but, for its time, Deadline provided very interesting insights into a fictional nuclear weapons project. What do you think?

The Universe is Isotropic

Peter Lobner, Updated 12 January 2021

The concepts of up and down appear to be relatively local conventions that can be applied at the levels of subatomic particles, planets and galaxies. However, the universe as a whole apparently does not have a preferred direction that would allow the concepts of up and down to be applied at such a grand scale.

A 7 September 2016 article entitled, “It’s official: You’re lost in a directionless universe,” by Adrian Cho, provides an overview of research that demonstrates, with a high level of confidence, that the universe is isotropic. The research was based on data from the Planck space observatory. In this article, Cho notes:

“Now, one team of cosmologists has used the oldest radiation there is, the afterglow of the big bang, or the cosmic microwave background (CMB), to show that the universe is “isotropic,” or the same no matter which way you look: There is no spin axis or any other special direction in space. In fact, they estimate that there is only a one-in-121,000 chance of a preferred direction—the best evidence yet for an isotropic universe. That finding should provide some comfort for cosmologists, whose standard model of the evolution of the universe rests on an assumption of such uniformity.”

The European Space Agency (ESA) developed the Planck space observatory to map the CMB in microwave and infrared frequencies at unprecedented levels of detail. Planck was launched on 14 May 2009 and was placed in a Lissajous orbit around the L2 Lagrange point, which is 1,500,000 km (930,000 miles) directly behind the Earth. L2 is a quiet place, with the Earth shielding Planck from noise from the Sun. The approximate geometry of the Earth-Moon-Sun system and a representative spacecraft trajectory (not Planck, specifically) to the L2 Lagrange point is shown in the following figure.

Lissajous orbit L2Source: Abestrobi / Wikimedia Commons

The Planck space observatory entered service on 3 July 2009. At the end of its service life, Planck departed its valuable position at L2, was placed in a heliocentric orbit, and was deactivated on 23 October 2013. During more than four years in service, Planck performed its CBM mapping mission with much greater resolution than NASA’s Wilkinson Microwave Anisotropy Probe (WMAP), which operated from 2001 to 2010.  Planck was designed to map the CMB with an angular resolution of 5-10 arc minutes and a sensitivity of a millionth of a degree.

One key result of the Planck mission is the all-sky survey shown below.

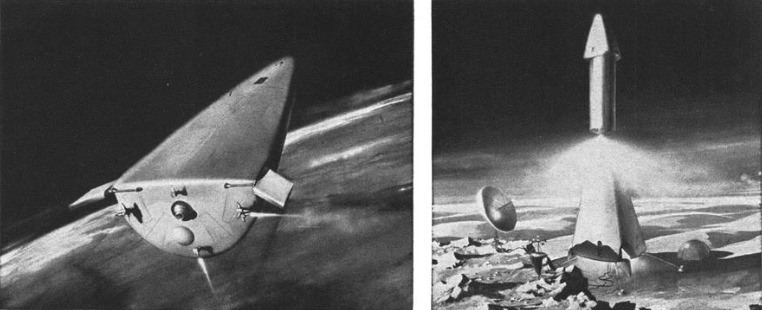
Planck all-sky survey 2013 CBM temperature map shows anisotropies in the temperature of the CMB at the full resolution obtained by Planck. Source: ESA / Planck Collaboration

ESA characterizes this map as follows:

“The CMB is a snapshot of the oldest light in our Universe, imprinted on the sky when the Universe was just 380,000 years old. It shows tiny temperature fluctuations that correspond to regions of slightly different densities, representing the seeds of all future structure: the stars and galaxies of today.”

The researchers who reported that the universe was isotropic noted that an anisotropic universe would leave telltale patterns in the CMB. However, these researchers found that the actual CMB shows only random noise and no signs of such patterns.

The researchers who reported that the universe was isotropic noted that an anisotropic universe would leave telltale patterns in the CMB.  However, these researchers found that the actual CMB shows only random noise and no signs of such patterns.

In 2015, the ESA / Planck Collaboration used CMB data to estimate the age of the universe at 13.813 ± 0.038 billion years.  This was lightly higher than, but within the uncertainty band of, an estimate derived in 2012 from nine years of data from NASA’s Wilkinson Microwave Anisotropy Probe (WMAP) spacecraft.

In July 2018, the ESA / Planck Collaboration published the “Planck Legacy” release of their results, which included the following two additional CBM sky survey maps.

Planck all-sky survey 2013 CBM smoothed temperature map (top) and smoothed temperature + polarization map (bottom). Source: ESA / Planck Collaboration

The ESA/Planck Collaboration described these two new maps as follows:

  • (In the top map), “the temperature anisotropies have been filtered to show mostly the signal detected on scales around 5º on the sky. The lower view shows the filtered temperature anisotropies with an added indication of the direction of the polarized fraction of the CMB.”
  • “A small fraction of the CMB is polarized – it vibrates in a preferred direction. This is a result of the last encounter of this light with electrons, just before starting its cosmic journey. For this reason, the polarization of the CMB retains information about the distribution of matter in the early Universe, and its pattern on the sky follows that of the tiny fluctuations observed in the temperature of the CMB” (in the 2013 map, above).

Using Planck CMB data, the ESA / Planck Collaboration team has estimated the value of the Hubble constant. Their latest estimate, in 2018, was 67.4 km / second / megaparsec with an uncertainty of less than 1%.  This is lower than the value derived from astrophysical measurements: 73.5 km / second / megaparsec with an uncertainty of 2%.

You’ll find more details on the Planck mission and scientific results on the ESA’s website at the following link: http://www.esa.int/Our_Activities/Space_Science/Planck

For more information:

New Catalyst Could Greatly Reduce the Cost of Splitting Water

Peter Lobner

Splitting water (H2O) is the process of splitting the water molecule into its constituent parts: hydrogen (H2) and oxygen (O2). A catalyst is a substance that speeds up a chemical reaction or lowers the energy required to get a reaction started, without being consumed itself in a chemical reaction.

Water moleculeWater molecule.  Source: Laguna Design, Getty Images

A new catalyst, created as a thin film crystal comprised of one layer of iridium oxide (IrOx) and one layer of strontium iridium oxide (SrIrO3), is described in a September 2016 article by Umair Irfan entitled, “How Catalyst Could Split Water Cheaply.” This article is available on the Scientific American website at the following link:

http://www.scientificamerican.com/article/new-catalyst-could-split-water-cheaply/?utm_source=howtogeek&utm_medium=email&utm_campaign=newsletter

The new catalyst, which is the only known catalyst to work in acid, applies to the oxygen evolution reaction; the slower half of the water-splitting process.

Author Irfan notes that, “Many of the artificial methods of making hydrogen and oxygen from water require materials that are too expensive, require too much energy or break down too quickly in real-world conditions…” The availability of a stable catalyst that can significantly improve the speed and economics of water splitting could help promote the shift toward more widespread use of clean, renewable fuels. The potential benefits include:

  • May significantly improve hydrogen fuel economics
  • May allow water splitting to compete with other technologies (i.e., batteries and pumped storage) for energy storage. See my 4 March 2016 posting on the growing need for grid energy storage.
  • May improve fuel cells

At this point, it is not clear exactly how the IrOx / SrIrO3 catalyst works, so more research is needed before the practicality of its use in industrial processes can be determined.

The complete paper, “A highly active and stable IrOx/SrIrO3 catalyst for the oxygen evolution reaction,” by Seitz, L. et al., is available to subscribers on the Science magazine website at the following link:

http://science.sciencemag.org/content/353/6303/1011.full