Peter Lobner
Congratulations to the Lyncean Group founders who had the vision in November 2002 to create the Group as a forum for retired and semi-retired technical professionals to meet regularly to discuss subjects associated with science and technology, to learn from one another, to share thoughts and ideas, and to enjoy their mutual interest in science, technology and related fields.
Bill Hagan reported that Lyncean Group membership now stands at 122, and this week’s meeting was the 100th meeting of the Lyncean Group. To commemorate this milestone, Dr. Lorenz (Larry) Kull was recognized as the chief instigator behind the formation of the Lyncean Group. Larry was presented with a Lyncean clock made by Bill Hagan’s Dad.
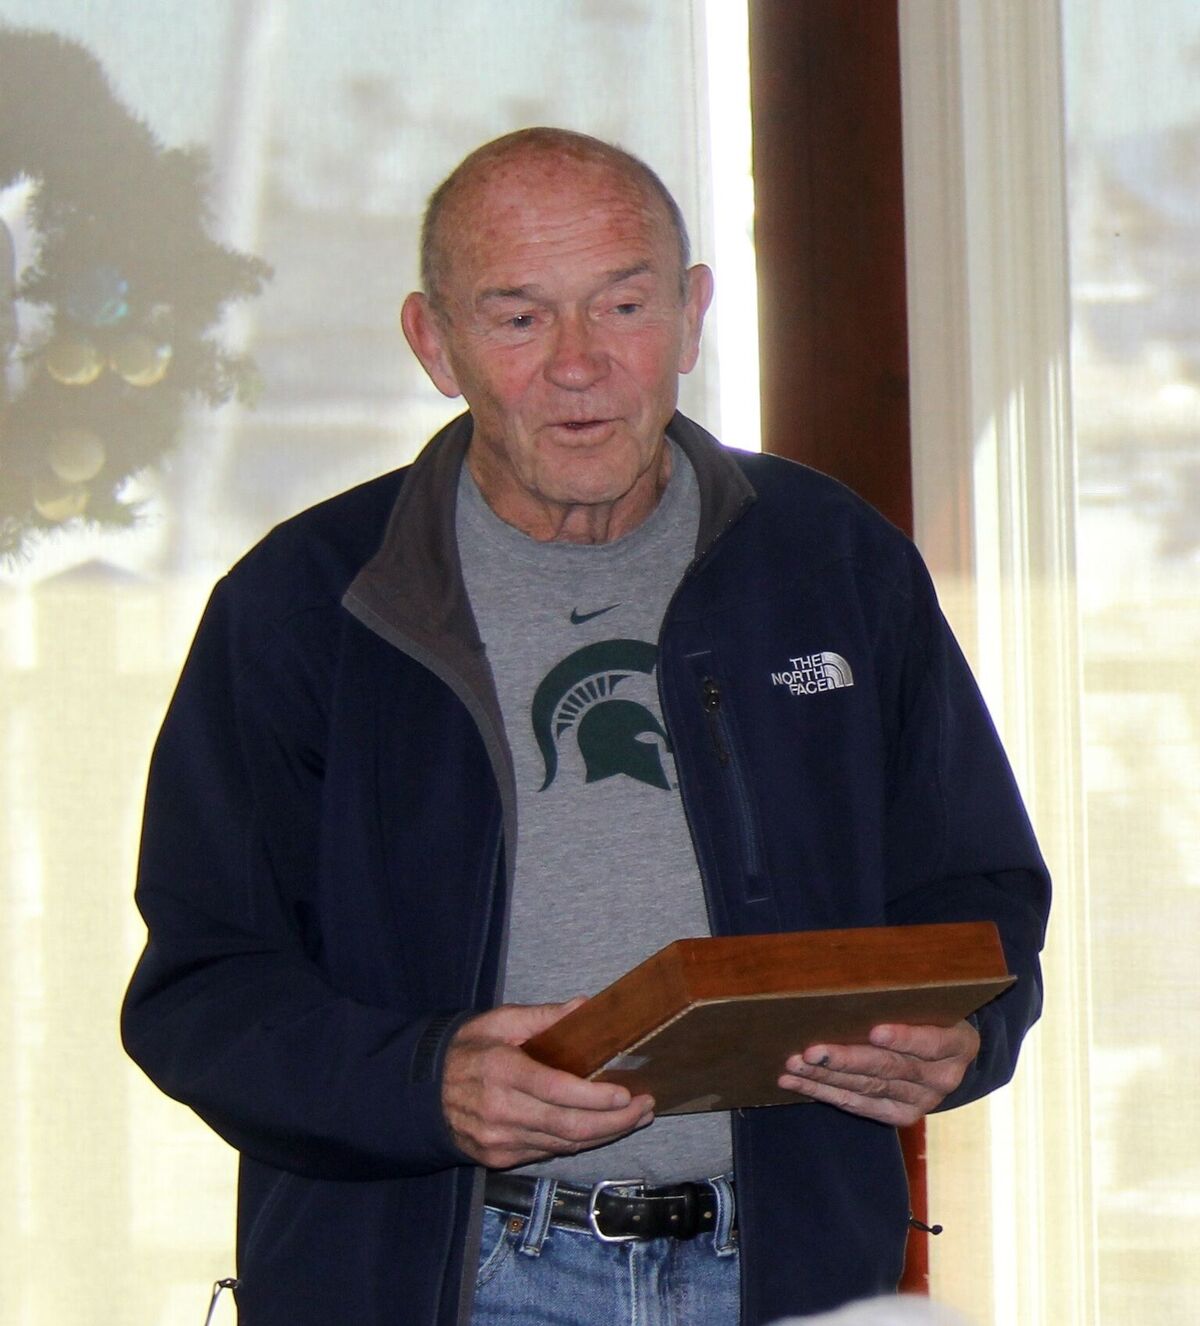
Larry noted that it really was the founder’s wives who were the driving force for forming the Lyncean Group because it would give the founders a reason to get out of the house more often.
Starting with meeting #2 in February 2003, each meeting has included a presentation by a Lyncean Group member or an invited guest speaker. You can access the list of past meetings from the Lyncean Group home page or directly from the following link:
https://lynceans.org/pastmeetings/
In most cases, the list of past meetings includes links to the presentation material also available on the Lyncean Group website. For the 100th meeting, guest speaker, Dr. Hosseni Eslambolchi, made an outstanding presentation on, “The Power of Technology to Transform the Future.”
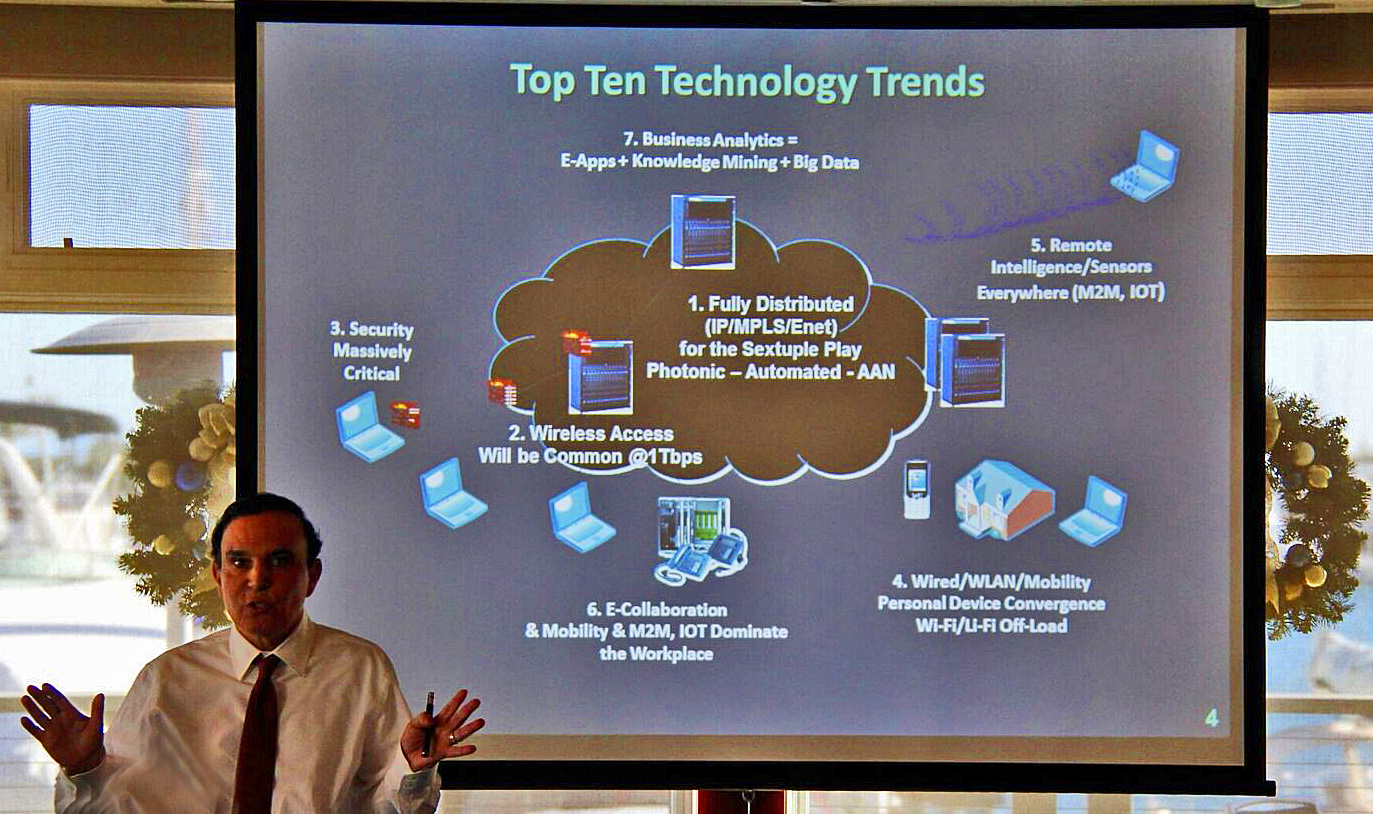
Dr. Eslambolchi’s presentation slides have been posted on the Lyncean Group website and are available to view or download.
Future meetings already are scheduled well into 2016. Our next meeting will be on 27 January 2016. To see the list of planned speakers and topics, you can access the schedule from the Lyncean Group home page or directly from the following link:
https://lynceans.org/upcoming/
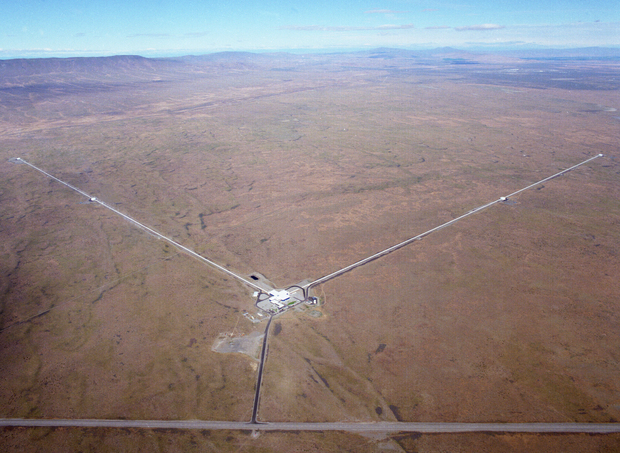
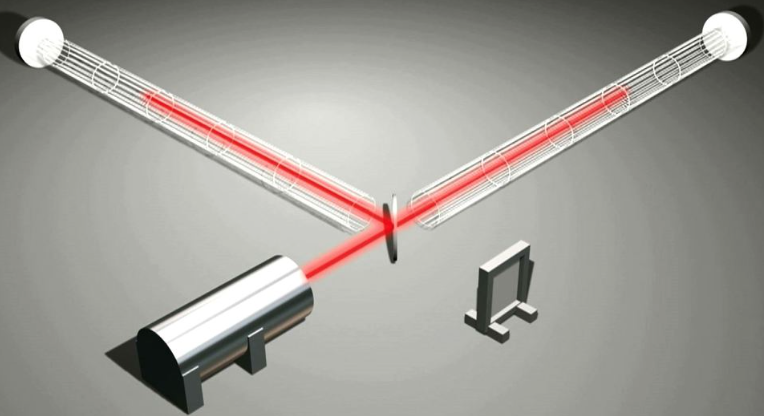
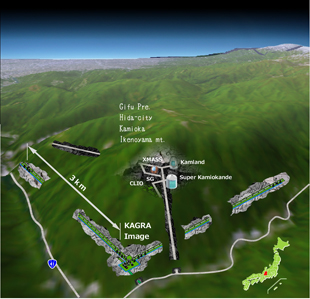
As of today, there are 100 posts on the Lyncean technical blog site, Pete’s Lynx; the last being, “100th Anniversary of Einstein’s General Theory of Relativity and the Advent of a New Generation of Gravity Wave Detectors.” You can access the blog site from the Lyncean Group home page or directly from the following link:
https://lynceans.org/petes-lynx/
If you have comments on this blog, please use the Contacts page on the Lyncean Group website to send Pete a message. The following link will take you to that page.
Thanks to all Lyncean Group members for helping to make the Group a success through your participation in the group’s meetings. Just try to imagine the technical topics we will be addressing in the next 100 meetings. Our mutual interest in the rapidly changing technologies affecting our world should make for lively discussions and engaging meetings.
Happy holidays to all!


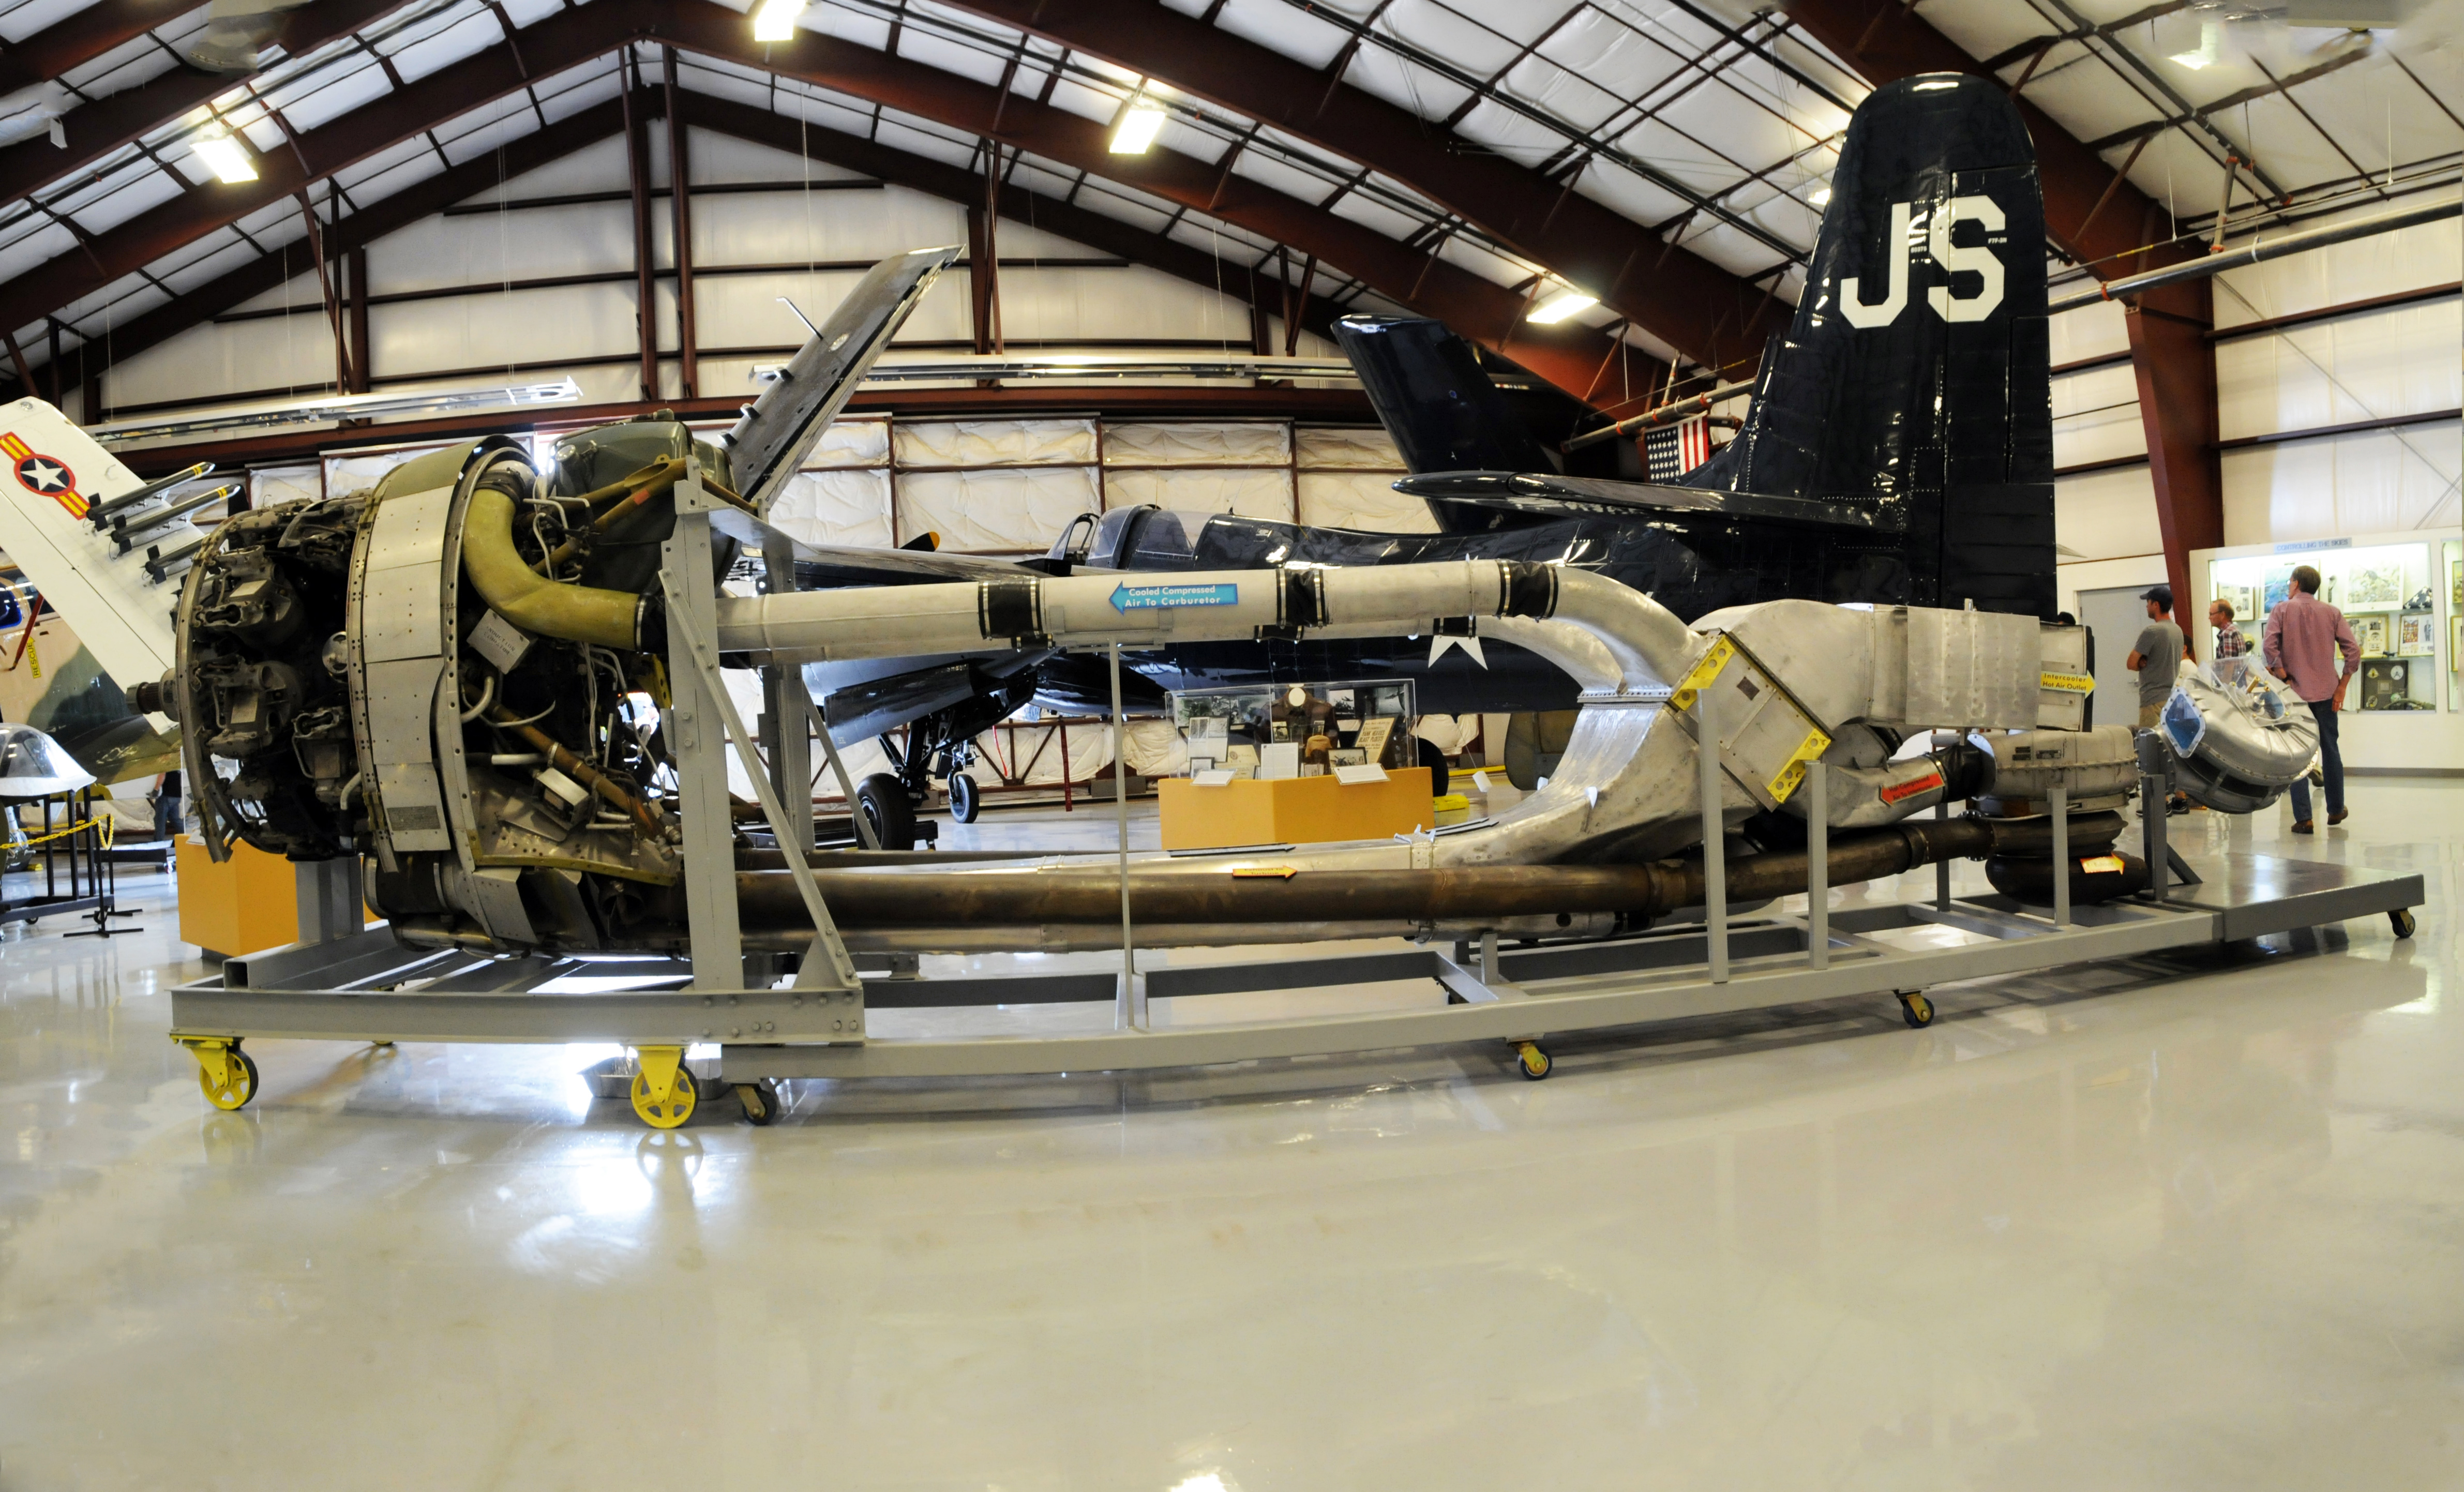
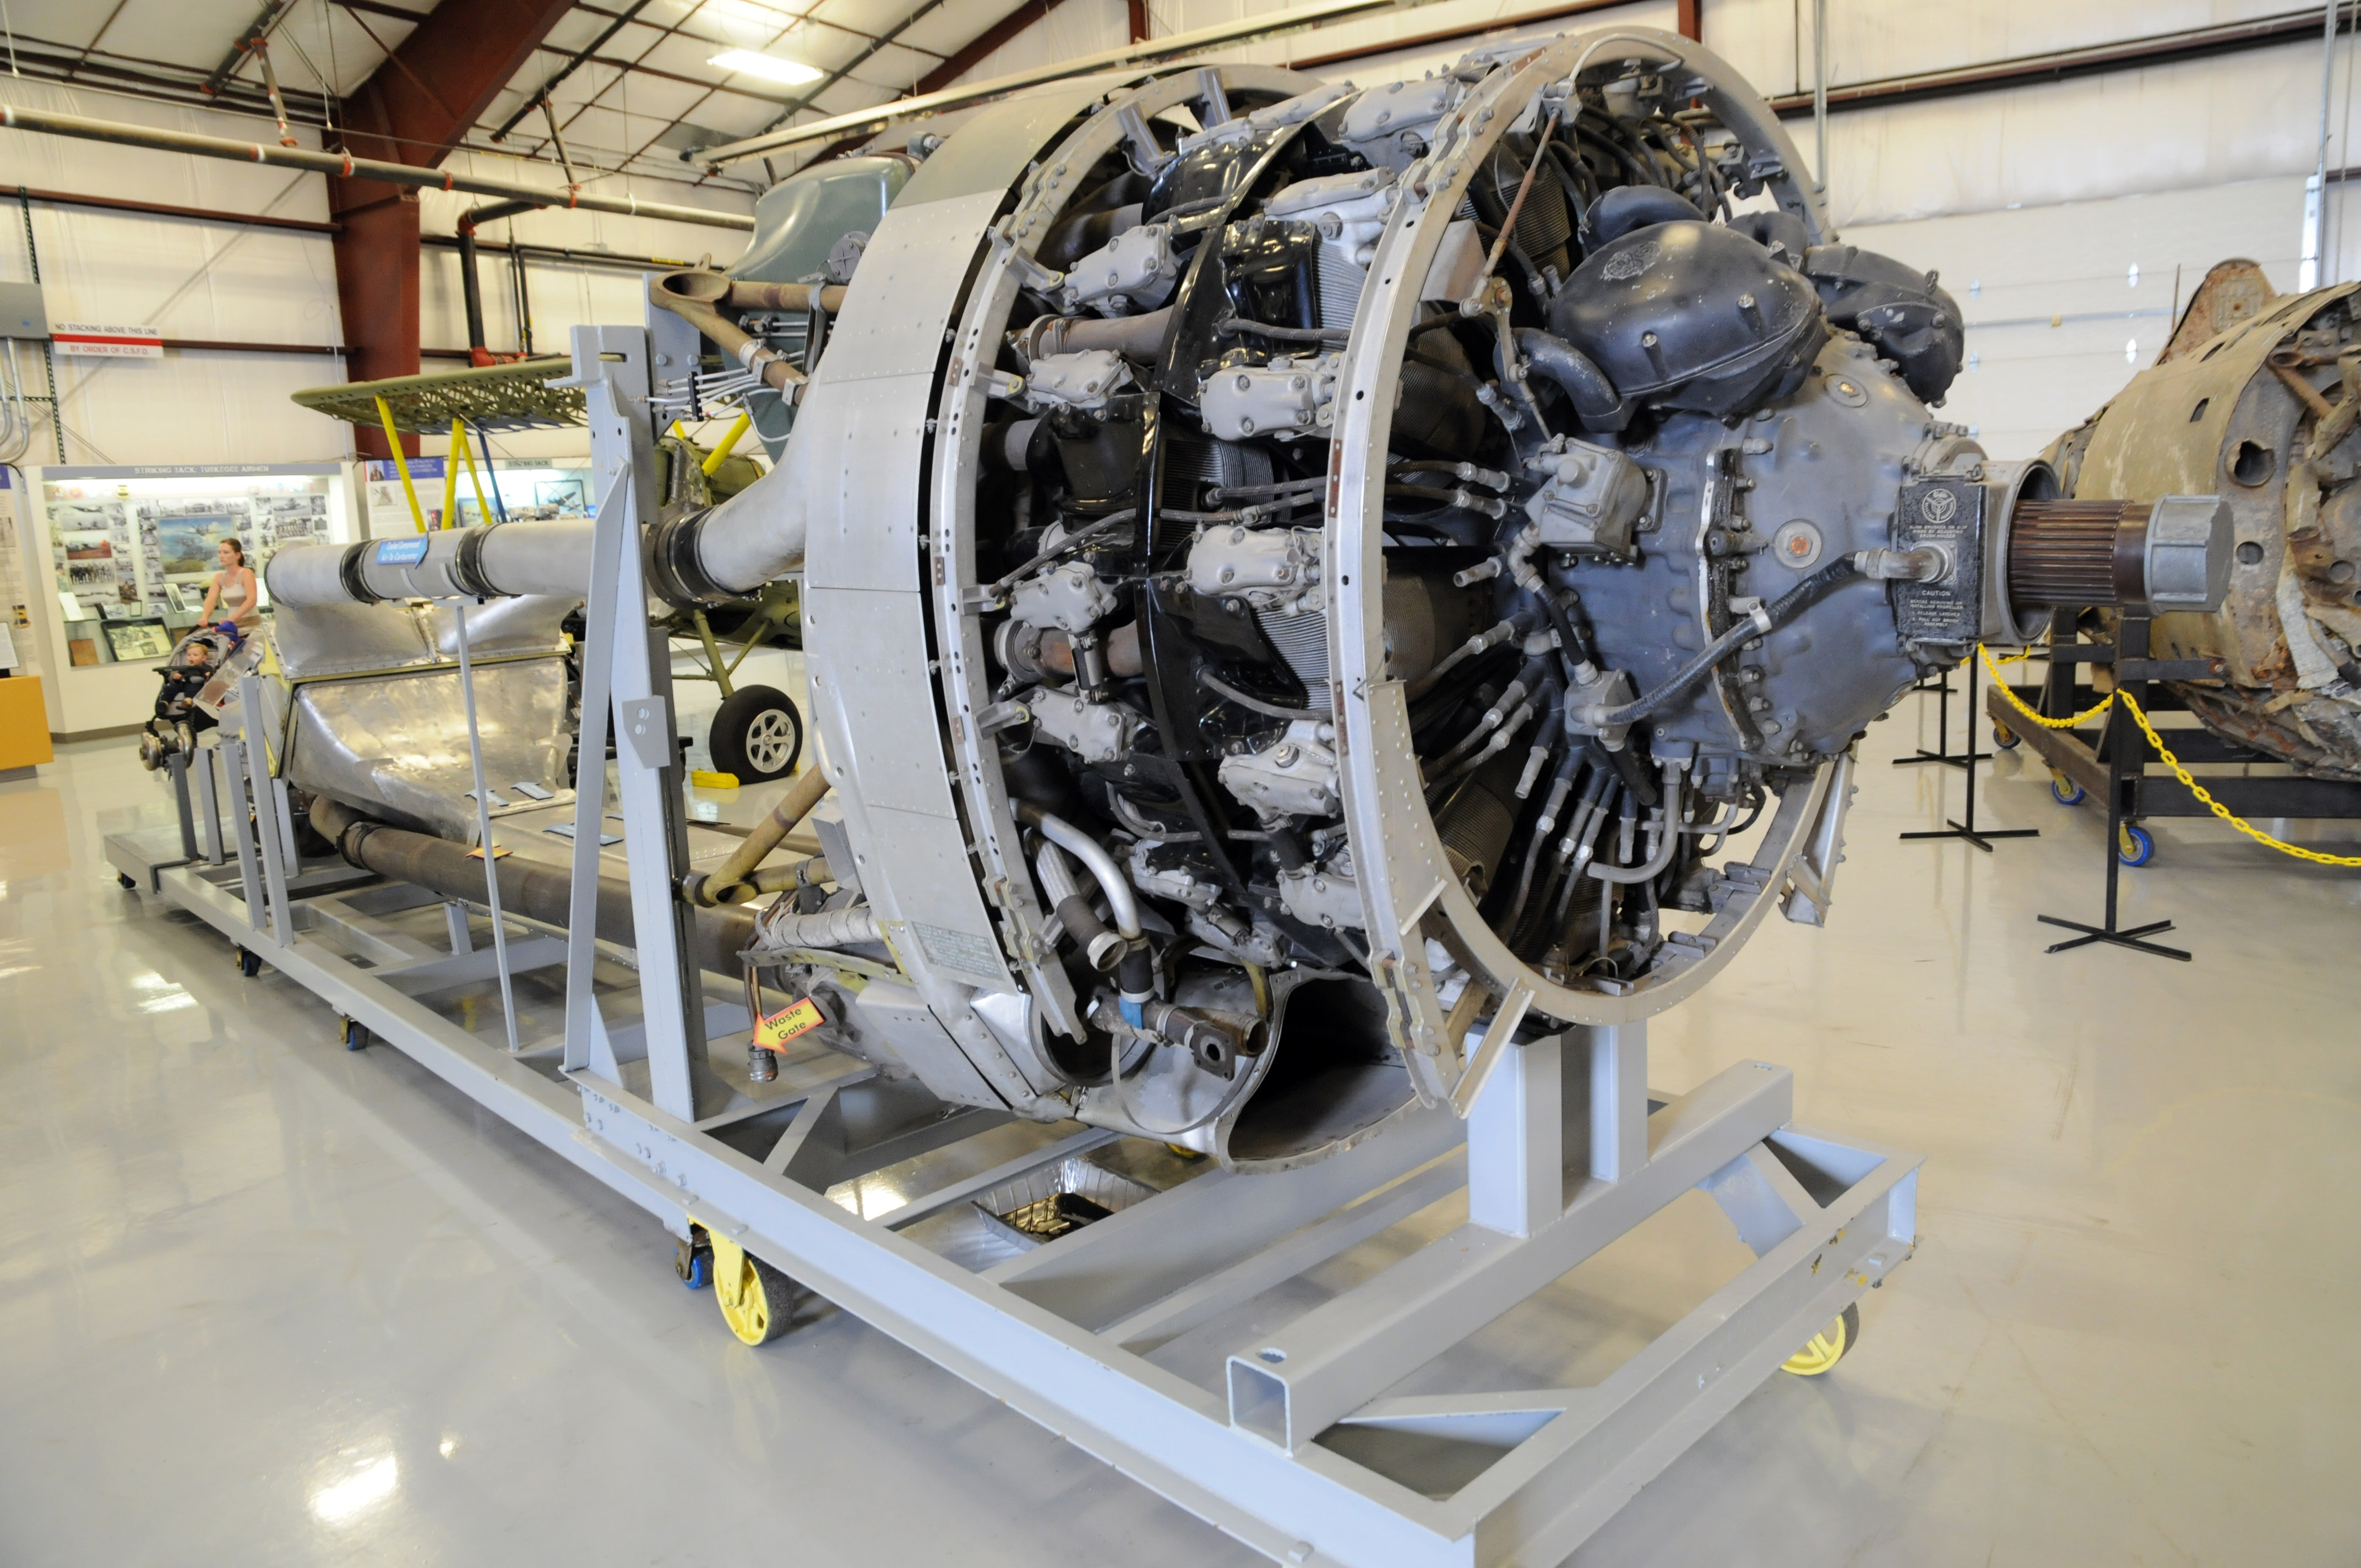
 Source: Author photo


