All posts by Drummer

What are the Sources of Electric Power in the USA?

Peter Lobner

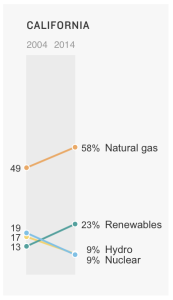
The sources of electric power used in California have changed significantly between 2004 and 2014. The distribution of California’s energy sources, among natural gas, renewables (wind & solar), hydroelectric, and nuclear is shown in the following chart. California does not use coal or petroleum to generate electric power.

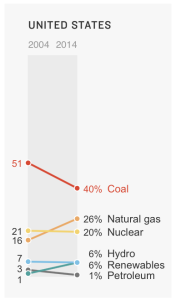
CA energy use 2004 - 2014  USA energy use 2004 - 2014

Nationally, on a percentage basis, coal use is on the decline and use of natural gas and renewables is on the increase in most states.

Check out the following NPR website, which is the source of the above charts, to see similar charts for all 50 states.

http://www.npr.org/2015/09/10/319535020/coal-gas-nuclear-hydro-how-your-state-generates-power?utm_source=howtogeek&utm_medium=email&utm_campaign=newsletter

Remarkable Video and Synchronized Audio Record of the Apollo 11 Landing in the Sea of Tranquility

Peter Lobner

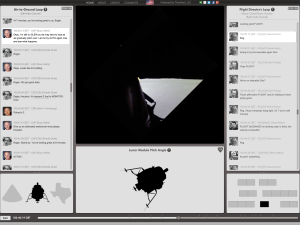
Thamtech, LLC produced a remarkable 18-minute video of the first landing on the Moon, which occurred on 20 July 1969 when Apollo 11 landed in the Sea of Tranquility. Here is a screenshot from that video.

Apollo 11 lunar landing video screenshot

In the center, the video shows the view from the Lunar Landing Module (LEM) during descent and landing. To the left and right are the two synchronized audio tracks:

  • The Air-to-Ground Loop on the left has all the communications between the Capsule Communicator (CAPCOM Charlie Duke) in Houston and the Apollo astronaut crew on the LEM (Buzz Aldrin & Neil Armstrong) and in the Moon-orbiting Apollo capsule (Michael Collins).
  • The Flight Director’s Loop on the right has all the communications among the Flight Director (Gene Kranz, who is responsible for the go/no-go and stay/no-stay decisions) and his team of flight controllers in Houston.

The icon at the bottom center of the screen shows the orientation of the LEM relative to local horizontal (the Moon’s surface).

You can see this video at the following link:

http://www.firstmenonthemoon.com

Ensure that “Sync On” is ON (both left and right sides) so the transmissions will scroll automatically in unison.

The success of this first landing on the Moon is a great credit to the professionalism of the Apollo astronauts and the flight control team, and of course, to the whole NASA-led team that created the Saturn V launch vehicle, the Apollo and LEM spacecraft, and the infrastructure needed to support the Apollo program.

The first landing on the Moon occurred more than 46 years ago. The last Apollo Moon landing occurred almost 3-1/2 years later when Apollo 17 landed in the hilly Taurus-Littrow valley on 10 December 1972.

How much longer do you think we will have to wait for the next Moon landing, and what nation do you think will make that landing?

Just How Flat is Hakskeen Pan?

Peter Lobner

If you will be driving the UK’s Bloodhound supersonic car (SSC) in 2019, you really care about the answer to that question.

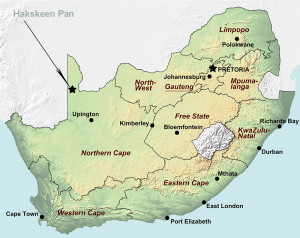
Hakskeen Pan is a very flat region in the Northwestern corner of South Africa, and it is the site selected by the Bloodhound Project team for a 16 km (9.94 mile) track that will be used for their world land speed record attempt.

Hakskeen Pan mapSource: adapted from http://southafricamap.facts.co/

My 2 March 2015 post introduced you to the Bloodhound Project and gave you the link to their website where you can get a complete update on the project and sign up for their blog. Here again is the link to the Bloodhound Project home page:

http://www.bloodhoundssc.com/project

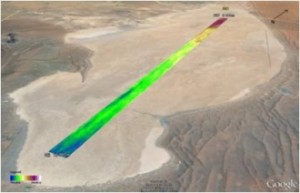
So, how flat is Hakskeen Pan and how much does it matter to a land speed record car traveling at 1,000 mph (1,609 kph)? The Cape Town, South Africa, survey company Lloyd & Hill surveyed the entire 16 km by 500 meter wide track surface (an area of about 8 million square meters) measuring the elevation in each square meter to an accuracy of 10 mm (0.39 in) or less. Using laser-scanning technology to collect data, and some considerable computing resources, Lloyd & Hill reduced four billion laser measurements into a 3-dimensional surface map of Hakskeen Pan. Key findings were:

  • Hakskeen Pan has a very gentle slope from north to south: dropping 300 mm in 16 km (about one foot in 10 miles)
  • Across the whole surface, the biggest ‘bumps’ and ‘dips’ are less than 50 mm (2 inches) from the average elevation
  • There’s an 80 mm (3.12 in) ‘step’ that occurs in a distance of 180 m (590 ft) running across the Pan, just over 9 km from the northern end of the track, and just where the car will be travelling at 1,000 mph.

BLOODHOUND SSC-scanned area of Hakskeen PanSource: The Bloodhound Project

The Bloodhound SSC has independent double-wishbone suspension on all four wheels. Preliminary dynamic analysis of the Bloodhound SSC’s suspension response to the measured surface irregularities shows that the vehicle should not be subject to loads of more than 1.0 – 1.5 g during it’s world land speed record attempt.   The suspension is designed to cope with up to 4 g.

Check out the details of the Hakskeen Pan site survey and the vehicle dynamic analysis at the following link:

http://www.bloodhoundssc.com/blog/andy-green’s-diary-–-august-2015

Also check out the Education tab on the Bloodhound Project website. I think you will be pleased to see how this exciting engineering project is working to engage with and inspire the next generation of scientists and engineers.

23 January 2017 Update – Hakskeen Pan floods

 Hakskeen Pan flooded Jan2017Source: The Bloodhound Project

The Bloodhound team reported:

“This particular flood was caused mainly by the rain in Namibia and flooding from the rivers, rather than actual rainfall on the Pan and surrounding catchment area, as there are many rivers that flow into the Pan.

Having the desert flood like this is very good news for us, as flooding helps to repair the surface from any damage that may have been caused in the final preparation and clearance of the desert, and it helps to create the best possible surface for land speed record racing.”

Read more at the following link:

http://www.bloodhoundssc.com/news/hakskeen-pan-update-0

The Sad State of Affairs of the U.S. Icebreaking Fleet and Implications for Future U.S. Arctic Operations

Peter Lobner

On 1 Sep 2015, while visiting Alaska, President Obama announced that he would speed up the acquisition of icebreakers to help the U.S. Coast Guard (USCG) operate in the Arctic. A Congressional Research Service report entitled, Coast Guard Polar Icebreaker Modernization: Background and Issues for Congress, was issued on 2 Sep 2015.  You can download this report at the following link:

https://www.fas.org/sgp/crs/weapons/RL34391.pdf

This report asserts that a new heavy polar icebreaker will cost in the range from $900 million to $1.1 billion.  The report also provides an interesting history of prior USCG assessments  of their icebreaker needs and  budget actions taken over the past few years that significantly reduced the budget available to pursue new icebreaker acquisition.

Role of the National Science Foundation

In 2006, the G.W. Bush administration moved budget and management authority for the U.S. polar icebreaker fleet from the USCG to the National Science Foundation (NSF). The USCG retained custody of the polar icebreakers, which continue to be operated by USCG crews. This arrangement is recorded in the following 2006 document: Memorandum of Agreement Between United States Coast Guard and National Science Foundation Regarding Polar Icebreaking Support and Reimbursement. You can read the details of this convoluted agreement at the following link:

https://www.nsf.gov/geo/plr/opp_advisory/briefings/oct2005/2005_uscgnsf_moa.pdf

The current U.S. polar icebreaker fleet

Currently the entire U.S. national capability for Arctic and Antarctic icebreaking operations is found in a very small icebreaking fleet consisting of:

  • One heavy polar icebreaker, Coast Guard Cutter Polar Star
    • Commissioned in 1976
    • Displacement: 13,194 tons
    • Horsepower: 75,000 hp (gas turbines) + 18,000 hp (diesels)
  • One medium polar icebreaker, Coast Guard Cutter Healy
    • Commissioned in 1999
    • Displacement: 16,000 tons
    • Horsepower: 30,000 (diesels)
  • Some ice-capable tugs and tenders

In addition to this active “fleet”, the U.S. also has an inactive heavy polar icebreaker; the  Polar Sea (sister ship of Polar Star), which was commissioned in 1978 and placed in inactive commission in Seattle, WA in 2010 after a major propulsion plant equipment casualty. A 2013 USCG analysis, required by Congress to forestall the planned scrapping of the Polar Sea, showed that Polar Sea could be rehabilitated and reactivated for a fraction of the cost of building a new icebreaker. Polar Sea remains in inactive commission.
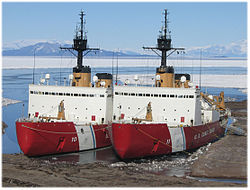
Polar Star_Polar SeaSource: Wikipedia

Polar Star & Polar Sea together in happier days.

In 2006, NSF put Polar Star in caretaker status due to equipment aging / wear-out issues. The ship originally was designed for a 30 year operating life.  After a modest refurbishment, the ship returned to Antarctic service in late 2013. Polar Star is expected to continue operating until about 2020.

After Polar Sea suffered its major propulsion system casualty in 2010, and until the Polar Star returned to service in late 2013, the medium icebreaker Healy was the only active U.S. polar icebreaker.

In February 2015, the USCG reported that it needed three heavy and three medium icebreakers to cover the U.S. “anticipated needs” in the Arctic and Antarctic. Six different U.S. agencies have missions in Polar regions.

U.S. Coast Guard’s 2013 Review of Major Icebreakers of the World is a chart that provides a good visual representation of the world’s icebreaker fleets. This chart is reproduced below, but you may need to go to the following link to see a more readable and downloadable pdf version of this  chart:

https://www.uscg.mil/hq/cg5/cg552/docs/20130718%20Major%20Icebreaker%20Chart.pdf
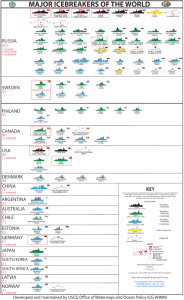
Icebreakers

The icons in this chart for the U.S. icebreaker fleet include the Polar Star, Polar Sea (inactive) and Healy, as expected. The other two vessels are:

  • Nathaniel B. Palmer, a privately owned, ice capable research ship leased by NSF to support Antarctic science missions.
  • Aiviq, a privately owned icebreaking, anchor-handling tug supply vessel chartered by Royal Dutch Shell to support their oil exploration activities in the Chukchi Sea off Alaska.

So, really, the U.S. currently only has two polar icebreakers. One typically serves the Antarctic and one serves the Arctic.  In 2013, the USCG got approval too explore developing a new heavy-duty icebreaker.  In mid-2015, the USCG website reports:

“The Coast Guard is in the preliminary phase of a new, heavy polar icebreaker acquisition program. This stage in the process includes developing a formal mission need statement, a concept of operations, and an operational requirements document – all necessary before developing and implementing a detailed acquisition plan.”

Russia’s polar icebreaker fleet

In comparison, the USCG’s 2013 chart shows that Russia fields almost 40 icebreakers with up to a dozen more planned or under construction. Russia has national plans to exploit its Arctic resources along the Northern Sea Route, which passes through the Arctic Ocean along the north coast of Russia. Nuclear-powered icebreakers play important roles in those plans.

The first of the new LK-60 nuclear-powered heavy polar icebreakers, Arktika, is under construction in St. Petersburg’s Baltic Shipyard and is expected to enter service in 2017. Its icebreaking bow was installed in August 2015.

LK-60_Arktika-bow_Aug2015 Source: http://bellona.org/

Contracts for two additional LK-60-class icebreakers were placed in May 2014. They are scheduled for delivery in 2019 and 2020.

U.S. Navy Arctic Roadmap 2014 – 2030

The recently published U.S. Navy Arctic Roadmap 2014 – 2030 includes the following observations:

  • U.S. Navy expects the Arctic “to remain a low threat security environment where nations resolve differences peacefully.”
  • It sees its role as mostly a supporter of U.S. Coast Guard (USCG) operations and responder to search-and-rescue and disaster situations.
  • However, the presence of vast resource endowments and territorial disagreements “contributes to a possibility of localized episodes of friction in the Arctic Region, despite the peaceful intentions of the Arctic nations.”
  • “Navy functions in the Arctic Region are not different from those in other maritime regions; however, the Arctic Region environment makes the execution of many of these functions much more challenging.”

Regarding the first and third points, above, Russian activities in the Arctic during the past year suggest that the U.S. Navy has underestimated, at least publically, the likelihood of non-peaceful actions in the Arctic and the potential need for a military response in the region. Recent Russian activities in the Arctic highlight this risk.

Given the poor state of the U.S. polar icebreaker fleet, I would say that the last point, above, is a gross understatement. The USCG and the Navy are not well-positioned for surface operations in the Arctic Ocean. Surface naval operations in ice-covered Arctic regions will be almost impossible to execute without a capable U.S. icebreaker fleet.

You can download a copy of the Navy’s Arctic Roadmap at the following link:

http://www.navy.mil/docs/USN_arctic_roadmap.pdf

Examples of worrisome recent Russian activities in the Arctic are:

  • Since early 2014, Russia has been conducting bomber and fighter missions close to the airspace of its Arctic neighbors.  This kind of military behavior has not been seen since the Cold War ended in the early 1990s.
  • 1 December 2014: Russia’s new Arctic Joint Strategic Command became operational. This provides central management of all Russian military resources in the Arctic, and there are a lot of them. The new command, based on the Northern Fleet and headquartered at Severomorsk, will acquire military, naval surface and strategic nuclear subsurface, air force and aerospace defense units, assets, and bases transferred from other Russian Military Districts
  • 15 – 20 March 2015: Russia conducted a massive, five-day military exercise in the Arctic involving about 80,000 troops, 220 aircraft, 41 ships, and 15 submarines. This exercise was conducted on the one-year anniversary of the Russian annexation of Crimea.
  • 4 August 2015: Russia’s Foreign Ministry confirmed that Russia had re-submitted to the United Nations it’s Arctic extended continental shelf claim. Russia is seeking recognition for its formal economic control of 1.2 million square kilometers (463,320 square miles) of Artic sea shelf extending more than 350 nautical miles from the shore.

The new U.S. Arctic Executive Steering Committee

In contrast to  Russia’s new Arctic Joint Strategic Command, President Obama issued an Executive Order in 15 January 2015 setting up the Arctic Executive Steering Committee, which will be responsible for enhancing coordination of national efforts in the Arctic.  How this new Steering Committee will affect progress on revitalizing the U.S. polar icebreaker fleet remains to be seen. You can read the full text of this Executive Order at the following link:

https://www.whitehouse.gov/the-press-office/2015/01/21/executive-order-enhancing-coordination-national-efforts-arctic

The bottom line

The U.S. is well behind the power curve for conducting operations in the Arctic that require icebreaker support.  Even with a well-funded new U.S. icebreaker construction program, it will take a decade before the first new ship is ready for service, and by that time, the new ship will be entering the fleet just as the  Polar Star is retiring or entering a comprehensive life-extension refurbishment program.

If you find yourself icebound in the Arctic anytime in the next decade, I think your best bet is to call the Canadians or the Russians for help.

5 February 2016 update:

In mid-January 2016, former Coast Guard Commandant Adm. Bob Papp made the following points at the annual Surface Navy Association meeting near Washington D.C.:

  • The U.S. will need eight icebreakers if it decides to have one patrolling in each polar region at all times.  The Coast Guard has never been able to support that high an operational tempo.
  • U.S. Arctic policy is a matter of national security; not just a matter of defense. The State Department’s vision focuses as well on sovereign rights and responsibilities of Arctic nations, maritime safety, energy, economic interests, environmental stewardship, scientific research and support to indigenous peoples.
  • More icebreakers are essential, because the U.S. can’t support its policies without being physically able to move about in the polar regions.

Read more details at the following link:

http://www.navytimes.com/story/military/2016/01/15/coast-guard-needs-8-icebreakers-cover-polar-regions-retired-4-star/78749864/

The current Coast Guard Commandant, Adm. Paul Zukunft, has stated that the schedule for the new icebreaker procurement program calls for a contract award for one icebreaker by fall 2019, with production beginning in 2020. Initial operational capability for this first new icebreaker would not be until the mid-2020s.  A Federal Business Opportunity (FBO) notice for the USCG Polar Icebreaker Replacement Program was posted online on 13 January 2016.  You can read the FBO notice and download the industry data package at the following link:

https://www.fbo.gov/index?s=opportunity&mode=form&id=68bf40747603b6acecc73e5ccc2974b6&tab=core&_cview=1

Well, this is a start.  When the new icebreaker enters the Coast Guard fleet and Polar Star retires after about 50 years of operation, the U.S. still will have only two polar icebreakers.
A Neural Algorithm of Artistic Style

Peter Lobner

Authors Leon A. Gatys, Alexander S. Ecker, and Matthias Bethge published the subject research paper on 26 Aug 2015 to, “Introduce an artificial system based on a Deep Neural Network that creates artistic images of high perceptual quality.”

Convolutional Neural Networks are a class of Deep Neural Network that is very powerful and well suited for image processing tasks. Common usage is in object and facial recognition systems. The authors explain how their neural algorithm works in a Convolutional Neural Network to independently capture content and style in a composite image that represents the content of an original image in a style derived from an arbitrarily selected second image. The authors state that: “The key finding of this paper is that the representations of content and style in the Convolutional Neural Network are separable. That is, we can manipulate both representations independently to produce new, perceptually meaningful images.”

In their paper, the authors selected the following photo to define the image content.

Neural net pic 1

Two examples of the image selected to define the style, and the resulting final image created by the neural algorithm are shown below.

Style derived from The Starry Night by Vincent van Gogh, 1889.

Neural net pic2

Style derived from Der Schrei by Edvard Munch, 1893

Neural net pic3

I find these results to be simply amazing in terms of their artistic composition and their effective implementation of the selected style.

It probably is premature, but I hope there soon will be a reasonably priced app for this to runs on a Mac or PC. I would buy that app in a heartbeat.

You can download the full paper, which includes all of the examples shown above, from the Cornell University Library at the following link:

http://arxiv.org/abs/1508.06576

Status Report on Global Nuclear Weapon and Fissile Material Stockpiles

Peter Lobner

The International Panel on Fissile Materials (IPFM) was founded in January 2006 as an independent group of arms-control and nonproliferation experts from both nuclear weapon and non-nuclear weapon states. The mission of the IPFM is to analyze the technical basis for practical and achievable policy initiatives to secure, consolidate, and reduce stockpiles of highly enriched uranium (HEU) and plutonium. The home page for IPFM is at the following link:

http://www.fissilematerials.org

On the IPFM home page, you will find the following summary information:

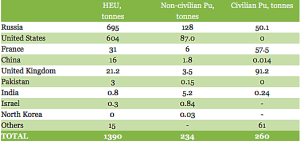
 As of January 2013, the global stockpile of highly enriched uranium (HEU) is estimated to be about 1390 tonnes. The global stockpile of separated plutonium is about 490 tonnes, of which about 260 tonnes is the material in civilian custody.

IPFM 2013 fissile material inventory crop

Numbers for weapon plutonium for the United States and United Kingdom are based on official data. Most numbers for civilian plutonium are based on declarations submitted to IAEA and reflect the status as of December 31, 2011. Other numbers are non-governmental estimates, often with large uncertainties. HEU amounts are 90% enriched HEU equivalent (with the exception of the number for non-nuclear weapon states). The totals are rounded. See individual country entries for details.

In the above table, a “tonne” is a metric ton, or 2,204.62 pounds. One tonne = 1.10231 (short) tons.

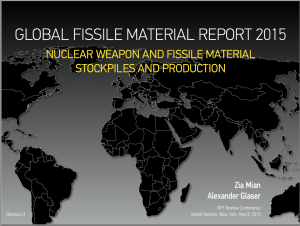
IPFM provides regular assessments of the global nuclear weapon and fissile material stockpiles. Their most recent report, Global Fissile Material Report 2015, was presented at the Non-Proliferation Treaty (NPT) Review Conference at the United Nations on 8 May 2015.

IPFM 2015 Report Cover  Source: IPFM

You can download a copy of the 8 May 2015 IPFM presentation at the following link:

http://fissilematerials.org/library/ipfm15.pdf

This definitely makes interesting reading.

A Framework for K-12 Science Education

Peter Lobner

NAP K-12 science education Source: NAP

The National Academies Press (NAP) describes this new book as follows:

“Science, engineering, and technology permeate nearly every facet of modern life and hold the key to solving many of humanity’s most pressing current and future challenges. The United States’ position in the global economy is declining, in part because U.S. workers lack fundamental knowledge in these fields. To address the critical issues of U.S. competitiveness and to better prepare the workforce, A Framework for K-12 Science Education proposes a new approach to K-12 science education that will capture students’ interest and provide them with the necessary foundational knowledge in the field.

A Framework for K-12 Science Education outlines a broad set of expectations for students in science and engineering in grades K-12. These expectations will inform the development of new standards for K-12 science education and, subsequently, revisions to curriculum, instruction, assessment, and professional development for educators. This book identifies three dimensions that convey the core ideas and practices around which science and engineering education in these grades should be built. These three dimensions are: crosscutting concepts that unify the study of science through their common application across science and engineering; scientific and engineering practices; and disciplinary core ideas in the physical sciences, life sciences, and earth and space sciences and for engineering, technology, and the applications of science. The overarching goal is for all high school graduates to have sufficient knowledge of science and engineering to engage in public discussions on science-related issues, be careful consumers of scientific and technical information, and enter the careers of their choice.

A Framework for K-12 Science Education is the first step in a process that can inform state-level decisions and achieve a research-grounded basis for improving science instruction and learning across the country. The book will guide standards developers, teachers, curriculum designers, assessment developers, state and district science administrators, and educators who teach science in informal environments.”

You can download a free pdf copy of this book for free at the following link:

http://www.nap.edu/catalog/13165/a-framework-for-k-12-science-education-practices-crosscutting-concepts

While you are on the NAP website, browse their other available publications and you will find two NAP publications addressing Next Generation Science Standards (NGSS).  These NGSS documents build on the K-12 science education framework described above.  See my 31 March 2015 post for more details on NGSS.

U.S. Reliance on Non-Fuel Mineral Imports

Peter Lobner

The U.S. Geologic Survey produces a series of mineral commodity annual reports and individual commodity data sheets. The web page for the index to these reports and data sheets is at the following link:

http://minerals.usgs.gov/minerals/pubs/mcs/

One particularly interesting document, with a very dull sounding title, is, Mineral Commodity Summaries 2015, which you can download for free at the following link:

http://minerals.usgs.gov/minerals/pubs/mcs/2015/mcs2015.pdf

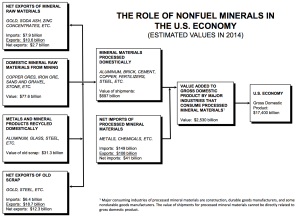
This USGS report starts by putting the non-fuel mineral business sector in context with the greater U.S. economy. In the USGS chart below, you can see that the non-fuel mineral business sector makes up 13.5% of the U.S. economy. By dollar volume, net imports of processed mineral materials make up only a small portion (about 1.6%) of the non-fuel mineral business.

USGS role of minerals in the economy

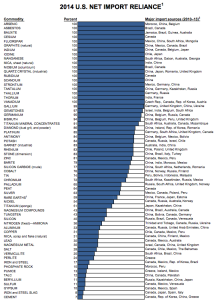
In the, Mineral Commodity Summaries 2015, USGS also identified the U.S. reliance on non-fuel minerals imports. Their chart for 2014 is reproduced below.

USGS Net Import Reliance

Many of the above non-fuel minerals have very important uses in high-value products created in other business sectors.  A good summary table on this matter appears in the National Academies Press report entitled, Emerging Workforce Trends in the U.S. Energy and Mining Industries: A Call to Action, published in August 2015. You can view or download this report for free at the following link:

http://www.nap.edu/new/

In this report, refer to Table 2.5, Common or Essential Products and Some of Their Mineral Components.

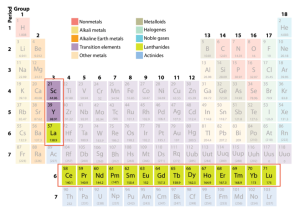
Among the minerals with very important roles in modern electrical and electronic components and advanced metals is the family of rare earths, which is comprised of the 17 elements highlighted in the periodic table, below:

  • the 15 members of the Lanthanide series from 57La (Lanthanum) to 71Lu (Lutetium), and
  • the two Transitional elements 21Sc (Scandium) and 39Y (Yttrium).

Periodic Table - Rare Earths

Source: www.rareelementresources.com/

In the above 2014 import reliance chart, USGS reported that the U.S. continued to be a net importer of rare earth minerals (overall, 59% reliant), and that for Scandium the U.S was 100% reliant on imports.

In the Mineral Commodity Summaries 2015, USGS reported the following usage of rare earth minerals in the U.S.:

  • General uses: catalysts, 60%; metallurgical applications and alloys, 10%; permanent magnets, 10%; glass polishing, 10%; and other, 10%.
  • Scandium principal uses: solid oxide fuel cells (SOFCs) and aluminum-scandium alloys. Other uses are in ceramics, electronics, lasers, lighting, and radioactive isotopes used as a tracing agent in oil refining

China became the world’s dominant producer of rare earths in the 1990s, replacing U.S. domestic producers, none of which could not compete economically with the lower prices offered by the Chinese producers.

On March 22, 2015, the CBS TV show 60 Minutes featured a segment on the importance of rare earth elements and underscored the need to ensure a domestic supply chain of these critical minerals. You can view this segment at the following link:

https://www.youtube.com/watch?v=N1HiX0HiAuo

In December 2011, the U.S. Department of Energy (DOE) issued a report entitled Critical Materials Strategy, which you can download for free at the following link:

http://energy.gov/sites/prod/files/DOE_CMS2011_FINAL_Full.pdf

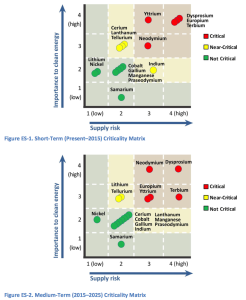
The summary results of the DOE “criticality assessment” are reproduced below

“Sixteen elements were assessed for criticality in wind turbines, EVs (electric vehicles), PV (photovoltaic) cells and fluorescent lighting. The methodology used was adapted from one developed by the National Academy of Sciences. The criticality assessment was framed in two dimensions: importance to clean energy and supply risk. Five rare earth elements (REEs)—dysprosium, terbium, europium, neodymium and yttrium—were found to be critical in the short term (present–2015). These five REEs are used in magnets for wind turbines and electric vehicles or phosphors in energy-efficient lighting. Other elements—cerium, indium, lanthanum and tellurium—were found to be near-critical. Between the short term and the medium term (2015– 2025), the importance to clean energy and supply risk shift for some materials (Figures ES-1 and ES-2).”

DOE Critical Materials Strategy

While the results of the DOE criticality assessment focused on importance to the energy sector, the identified mineral shortages will impact all business sectors that depend on these minerals, including consumer electronics and national defense.

Further insight on the importance of rare earths is provided by an annual report to the Senate Select Committee on Intelligence entitled, U.S. Intelligence Community Worldwide Threat Assessment Statement for the Record. The report delivered on March 12, 2013 highlighted the national security threat presented by China’s monopoly on rare earth elements. You can download that report at the following link:

https://www.hsdl.org/?view&did=732599

The 2013 threat assessment offered the following perspective on the strategic importance of rare earth minerals:

“Rare earth elements (REE) are essential to civilian and military technologies and to the 21st century global economy, including development of green technologies and advanced defense systems. China holds a commanding monopoly over world REE supplies, controlling about 95 percent of mined production and refining. China’s dominance and policies on pricing and exports are leading other countries to pursue mitigation strategies, but those strategies probably will have only limited impact within the next five years and will almost certainly not end Chinese REE dominance.”

 While the above focus has been on rare earths, the discussion serves to illustrate that the U.S. is dependent on importing many minerals that are very important to the national economy.

Building a Modern Wind Turbine Generator

Peter Lobner

MidAmerican Energy Company, Iowa’s largest energy company, began installing wind turbines in 2004. In May 2013, MidAmerican Energy announced their latest plan to invest up to $1.9 billion to expand its wind generation fleet and add up to 1,050 MWe of wind generation in Iowa by year-end 2015. Once this expansion is complete, approximately 3,335 MWe, or approximately 39%, of MidAmerican Energy’s total owned generation capacity will come from wind-powered generation from 1,715 wind turbines.

MidAmerica Energy wind turbines Source: MidAmerica Energy

You can visit the wind energy page on the MidAmerica Energy website at the following link:

http://www.midamericanenergy.com/wind_overview.aspx

Fact sheets on this site provide details on the two types of wind turbines currently being installed:

  • 1.5 MWe General Electric wind turbine (most common in the MidAmerica fleet)
  • 2.3 MWe Siemens wind turbine (largest in the MidAmerica fleet)

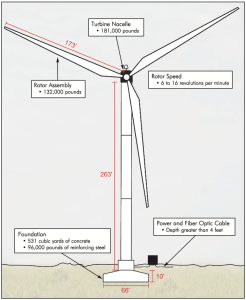
The impressive dimensions of the larger Siemens machine are shown in the following diagram:

MidAmerica Energy 2.3 MWe wind turbine Source: MidAmerica Energy

MidAmerican Energy Company has posted a 5+ minute time-lapse video on YouTube showing their three-week construction process for the Siemens wind turbine. This is worth watching to get a better understanding of the modest site preparation work required, the very large scale of the pedestal and rotor components, and the short time frame required to complete a wind turbine generator and have it ready to be put into revenue-generating service.  You can view the video at the following link:

https://www.youtube.com/embed/84BeVq2Jm88?feature=player_detailpage

Now complete this process several hundred times and you have a respectable sized wind farm.

The U.S. Energy Information Administration (EIA) defines “capacity factor” as follows:

“Capacity factors describe how intensively a fleet of generators is run. A capacity factor near 100% means a fleet is operating nearly all of the time. It is the ratio of a fleet’s actual generation to its maximum potential generation”.

EIA reports average monthly and annual capacity factors for utility generators. For utility generators not primarily using fossil fuels, the results are at the following link:

http://www.eia.gov/electricity/monthly/epm_table_grapher.cfm?t=epmt_6_07_b

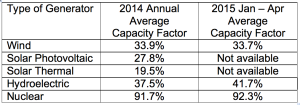
Here are average capacity factors reported by EIA:

EIA capacity factors 1

As a renewable power source, wind has a significantly higher capacity factor than solar. However, over the long term, a wind farm delivers only about one-third of it’s “nameplate rating.” This statistic, of course, does not capture the real-time variability in electrical output as wind conditions constantly change.

As a point of comparison, you can find the EIA capacity factor results for utility generators primarily using fossil fuels at the following link:

http://www.eia.gov/electricity/monthly/epm_table_grapher.cfm?t=epmt_6_07_a

Here are average capacity factors reported by EIA for selected fossil generators (I only included those that are likely to be base loaded):

EIA capacity factors 2

70th Anniversary of the First Detonation of a Nuclear Explosive Device at the Trinity Site Near Alamogordo, NM

Peter Lobner

On 16 July 1945, the Manhattan Project team successfully detonated the “The Gadget”, which was an implosion-type plutonium fission device similar in design to the Fat Man bomb detonated less than a month later over Nagasaki, Japan.

Various measurements were made to determine the yield of “The Gadget”. The best estimates are that the total yield of the test device was 21 kT, with 15 kT coming from plutonium fission and 6 kT coming from fast fissions in the natural uranium tamper. You can read more on the yield estimates at the following link:

http://blog.nuclearsecrecy.com/2014/11/10/fat-mans-uranium/

You also can read more details on the Trinity site and the test in a fact sheet prepared by the Defense Threat Reduction Agency, which you will find at the following link:

http://www.webcitation.org/6VDXaYUBL

Today, the Trinity Site is part of the White Sands Missile Range. This site was declared a National Historic Landmark in 1965 and is marked by the Trinity Site Obelisk National Historical Landmark. Currently the site is open to visitors only on two days of the year, the first Saturday in April and October. No reservations are required. Check the White Sands Missile Range website for the latest information:

http://www.wsmr.army.mil/PAO/Trinity/Pages/default.aspx

You can read an account of a 2006 visit to Trinity Site at the following link:

http://www.takemytrip.com/06newmex/06_15a.htm

Trinity_Site_Obelisk_National_Historic_Landmark  Source: en.wikipedia.org

Together, the nuclear bombings of Hiroshima, on 6 August 1945, and Nagasaki, on 9 August 1945, are credited with bringing an end to World War II. Japan announced its surrender on 15 August 1945 and formally signed the surrender documents on 2 September 1945.

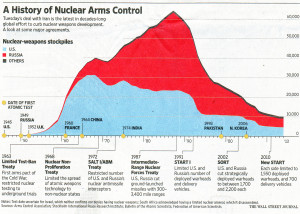
The Trinity test and the nuclear bombing of Japan also marked the start of a nuclear arms race, initially between the U.S. and the Soviet Union, but soon followed by other nations wishing to be nuclear powers: U.K, France, China, India, Pakistan and North Korea. The history of the worldwide nuclear weapons stockpiles and related arms control treaties is presented well in the following graphic from the Wall Street Journal. I’m hoping that Iran doesn’t show up as a new yellow dot on a future edition of that chart.

WSJ History of Nucelar Arms Control_e Source: Wall Street Journal