Category Archives: All Posts

Genome Sequencing Technology Advancing at an Astounding Rate

Peter Lobner

Background

On 14 April 2003 the National Human Genome Research Institute (NHGRI), the Department of Energy (DOE) and their partners in the International Human Genome Sequencing Consortium declared the successful completion of the Human Genome Project. Under this project, a “working draft” of the human genome had been developed and published in 2000 – 2001. At $2.7 billion in FY 1991 dollars, this project ended up costing less than expected and was completed more than two years ahead of its original schedule. However, “finishing” work continued through 2006 when sequencing of the last chromosome was reported.

A parallel project was conducted by the Celera Corporation, which was founded by Craig Venter in 1998 in Rockville, MD. The Celera project had access to the public data from the Human Genome Project and was funded by about $300 million from private sources. Competitive pressure from Celera, coupled with Celera’s plans to seek “intellectual property protection” on “fully-characterized important structures” of the genome likely accelerated the public release of the genome sequencing work performed by the Human Genome Project team.

In 2006, XPRIZE announced the Archon Genomics XPRIZE, offering $10 million to the first team that could rapidly and accurately sequence 100 whole human genomes to a standard never before achieved at a cost of $10,000 or less per genome.

DNA helix Genomic XPRIZESource: genomics.xprize.com

This contest was cancelled in August 2013 (first-ever XPRIZE competition to be cancelled), when it became obvious that, independent of this XPRIZE competition, the cost of commercial genome sequencing was plummeting while the sequencing speed was rapidly increasing. At the time the XPRIZE was cancelled in 2013, the cost of sequencing had dropped to about $5,000 per genome. You can read more about the cancellation of this XPRIZE at the following link:

http://genomics.xprize.org/news/outpaced-innovation-canceling-xprize

Remarkable progress at Illumina

About six months after the XPRIZE was cancelled, the San Diego gene sequencing firm Illumina announced on 14 January 2014 that it could sequence a human genome for $1,000 with their HiSeqX Ten sequencing system. A 15 January 2014 BBC report on this achievement is at the following link:

http://www.bbc.com/news/science-environment-25751958

At the time, the HiSeqX Ten was the top-of-the-line gene sequencing system in the world. It was reported to be capable of sequencing five human genomes per day. That’s about 4.8 hours per genome for a cost of $1,000 in January 2014. The HiSeqX Ten system actually is a set of 10 machines that sold originally for about $10 million. The smaller HiSeqX Five system, comprised of five machines, sold for about $6 million. One of the early customers for the HiSeqX Ten system was San-Diego-based Human Longevity Inc. (HLI), which Craig Venter co-founded.

Illumina Hiseq-x-tenIllumina’s HiSeqX Ten sequencing system. Source: Illumina

You’ll find details on the HiSeqX Ten system on the Illumina website at the following link:

http://www.illumina.com/systems/hiseq-x-sequencing-system/system.html

About six months later, on 16 July 2014, Dr. Allison Hahn, Sr. Applications Scientist from Illumina, Inc. was the Lyncean Group’s 87th speaker, with her presentation entitled, “How Genomics is Changing the Way We Think About Health and Disease.” The focus of this presentation was on how next-generation sequencing technology was paving the way toward using genomics in medicine. While this presentation was fascinating, one thing missing was a sense of just how short a “generation” was in the gene sequencing machine business.

On 10 January 2016, San Diego Union-Tribune reporter Bradley Fikes (another Lyncean Group speaker, April 2016) broke the news on Illumina’s new top-of-the-line genome sequencer, the NovaSeqTM sequencing system, which claims the capability to sequence a human genome in an average time of about one hour.

Illumina NovaSeq

 NovaSeqTM 6000. Source: Illumina

The U-T report provided the following additional details:

  • Illumina will sell the NovaSeqTM sequencing systems individually, with the first units expected to ship in March 2017
  • Two models, NovaSeqTM 5000 and 6000, are priced at $850,000 and $985,000, respectively.
  • “And ‘one day,’ Illumina chief executive Francis DeSouza said, the company’s NovaSeq line is expected to reduce the cost of sequencing to $100 per human genome.”

You can read Bradley Fike’s complete U-T article at the following link:

http://www.sandiegouniontribune.com/business/biotech/sd-me-illumina-novaseq-20170109-story.html

You’ll find product details on the NovaSeqTM series of sequencing systems on the Illumina website at the following link:

http://www.illumina.com/content/dam/illumina-marketing/documents/products/datasheets/novaseq-series-specification-sheet-770-2016-025.pdf

In less than two decades, human genome sequencing has gone from a massive research program to an extraordinarily efficient commercial process that now is on the brink of becoming a commodity for ever broadening applications.  The great speed and relatively low price of the new NovaSeqTM sequencing systems, and any other commercially competitive counterparts, are certain to transform the way genomic science is integrated into medical services.

What will Illumina do for an encore?

10th Anniversary of the iPhone

Peter Lobner

On 9 January 2007, Steve Jobs introduced the iPhone at Macworld in San Francisco, and the smart phone revolution moved into high gear.

Steve Jobs introduces iPhoneSteve Jobs introduces the iPhone in 2007.  Source: Apple

 Fortunately the first iPhone image he showed during this product introduction was a joke.

Not the iPhone

Not the 2007 original iPhone. Source: Apple

In the product introduction, Steve Jobs described the iPhone as:

  • Widescreen iPod with touch controls
  • Revolutionary mobile phone
  • Breakthrough internet communications device

You can watch a short (10 minute) video of the historic iPhone product introduction at the following link:

https://www.youtube.com/watch?v=MnrJzXM7a6o

A longer version (51 minutes) with technical details about the original iPhone is at the following link:

https://www.youtube.com/watch?v=vN4U5FqrOdQ

These videos are good reminders of the scope of the innovations in the original iPhone.

iPhone introduction2007 ad for the original iPhone. Source: web.archive.org

The original iPhone was a 2G device. The original applications included IMAP/POP e-mail, SMS messaging, iTunes, Google Maps, Photos, Calendar and Widgets (weather and stocks). The Apple App Store did not yet exist.

iTunes and the App Store are two factors that contributed to the great success of the iPhone. The iPhone App Store opened on 10 July 2008, via an update to iTunes. The App Store allowed Apple to completely control third-party apps for the first time. On 11 July 2008, the iPhone 3G was launched and came pre-loaded with iOS 2.0.1 with App Store support. Now users could personalize the capabilities of their iPhones in a way that was not available from other mobile phone suppliers.

You’ll find a good visual history of the 10-year evolution of the iPhone on The Verge website at the following link:

http://www.theverge.com/2017/1/9/14211558/iphone-10-year-anniversary-in-pictures

What mobile phone were you using 10 years ago? I had a Blackberry, which was fine for basic e-mail, terrible for internet access / browsing, and useless for applications. From today’s perspective, 10 years ago, the world was in the Dark Ages of mobile communications. With 5G mobile communications coming soon, it will be interesting to see how our perspective changes just a few years from now.

NuSTAR Provides a High-Resolution X-ray View of our Universe

Peter Lobner

In my 6 March 2016 post, “Remarkable Multispectral View of Our Milky Way Galaxy,” I briefly discussed several of the space-based observatories that are helping to develop a deeper understanding of our galaxy and the universe. One space-based observatory not mentioned in that post is the National Aeronautics and Space Administration (NASA) Nuclear Spectroscopic Telescope Array (NuSTAR) X-Ray observatory, which was launched on 13 June 2012 into a near equatorial, low Earth orbit. NASA describes the NuSTAR mission as follows:

“The NuSTAR mission has deployed the first orbiting telescopes to focus light in the high energy X-ray (6 – 79 keV) region of the electromagnetic spectrum. Our view of the universe in this spectral window has been limited because previous orbiting telescopes have not employed true focusing optics, but rather have used coded apertures that have intrinsically high backgrounds and limited sensitivity.

During a two-year primary mission phase, NuSTAR will map selected regions of the sky in order to:

1.  Take a census of collapsed stars and black holes of different sizes by surveying regions surrounding the center of own Milky Way Galaxy and performing deep observations of the extragalactic sky;

2.  Map recently-synthesized material in young supernova remnants to understand how stars explode and how elements are created; and

3.  Understand what powers relativistic jets of particles from the most extreme active galaxies hosting supermassive black holes.”

 The NuSTAR spacecraft is relatively small, with a payload mass of only 171 kg (377 lb). In it’s stowed configuration, this compact satellite was launched by an Orbital ATK Pegasus XL booster, which was carried aloft by the Stargazer L-1011 aircraft to approximately 40,000 feet over open ocean, where the booster was released and carried the small payload into orbit.

Orbital ATK L-1011 StargazerStargazer L-1011 dropping a Pegasus XL booster. Source: Orbital ATK

In orbit, the solar-powered NuSTAR extended to a total length of 10.9 meters (35.8 feet) in the orbital configuration shown below. The extended spacecraft gives the X-ray telescope a 10 meter (32.8 foot) focal length.

NuSTAR satelliteNuSTAR orbital configuration. Source: NASA / JPL – Caltech

NASA describes the NuSTAR X-Ray telescope as follows:

“The NuSTAR instrument consists of two co-aligned grazing incidence X-Ray telescopes (Wolter type I) with specially coated optics and newly developed detectors that extend sensitivity to higher energies as compared to previous missions such as NASA’a Chandra X-Ray Observatory launched in 1999 and the European Space Agency’s (ESA) XMM-Newton (aka High-throughput X-Ray Spectrometry Mission), also launched in 1999…….. The observatory will provide a combination of sensitivity, spatial, and spectral resolution factors of 10 to 100 improved over previous missions that have operated at these X-ray energies.”

The NASA NuSTAR mission website is at the following link:

https://www.nasa.gov/mission_pages/nustar/main/index.html

Some examples of NuSTAR findings posted on this website are summarized below.

X-ray emitting structures of galaxies identified

In the following composite image of Galaxy 1068, high-energy X-rays (shown in magenta) captured by NuSTAR are overlaid on visible-light images from both NASA’s Hubble Space Telescope and the Sloan Digital Sky Survey.

Galaxy 1068Galaxy 1068. Source: NASA/JPL-Caltech/Roma Tre Univ

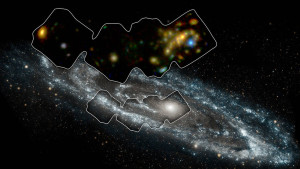
Below is a more detailed X-ray view of portion of the Andromeda galaxy (aka M31), which is the galaxy nearest to our Milky Way. On 5 January 2017, NASA reported:

“The space mission has observed 40 ‘X-ray binaries’ — intense sources of X-rays comprised of a black hole or neutron star that feeds off a stellar companion.

Andromeda is the only large spiral galaxy where we can see individual X-ray binaries and study them in detail in an environment like our own.”

In the following image, the portion of the Andromeda galaxy surveyed by NuSTAR is in the smaller outlined area. The larger outlined area toward the top of this image is the corresponding X-ray view of the surveyed area.

Andromeda galaxyAndromeda galaxy.  Source: NASA/JPL-Caltech/GSFC

NASA describes the following mechanism for X-ray binaries to generate the observed intense X-ray emissions:

“In X-ray binaries, one member is always a dead star or remnant formed from the explosion of what was once a star much more massive than the sun. Depending on the mass and other properties of the original giant star, the explosion may produce either a black hole or neutron star. Under the right circumstances, material from the companion star can “spill over” its outermost edges and then be caught by the gravity of the black hole or neutron star. As the material falls in, it is heated to blazingly high temperatures, releasing a huge amount of X-rays.”

You can read more on this NuStar discovery at the following link:

https://www.nasa.gov/feature/jpl/Andromeda-Galaxy-Scanned-with-High-Energy-X-ray-Vision

Composition of supernova remnants determined

Cassiopeia A is within our Milky Way, about 11,000 light-years from Earth. The following NASA three-panel chart shows Cassiopeia A originally as an iron-core star. After going supernova, Cassiopeia A scattered its outer layers, which have distributed into the diffuse structure we see today, known as the supernova remnant. The image in the right-hand panel is a composite X-ray image of the supernova remnant from both the Chandra X-ray Observatory and NuStar.

Cassiopeia ASource: NASA/CXC/SAO/JPL-Caltech

In the following three-panel chart, the composite image (above, right) is unfolded into its components. Red shows iron and green shows both silicon and magnesium, as seen by the Chandra X-ray Observatory. Blue shows radioactive titanium-44, as mapped by NuSTAR.

 Cassiopeia A componentsSource: NASA/JPL-Caltech/CXC/SAO

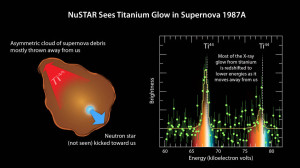
Supernova 1987A is about 168,000 light-years from Earth in the Large Magellanic Cloud. As shown below, NuSTAR also observed titanium in this supernova remnant.

SN 1987A titaniumSource: NASA/JPL-Caltech/UC Berkeley

These observations are providing new insights into how massive stars explode into supernovae.

Hey, EU!! Wood may be a Renewable Energy Source, but it isn’t a Clean Energy Source

Peter Lobner

EU policy background

The United Nations Framework Convention on Climate Change (The Paris Agreement) entered into force on 4 November 2016. To date, the Paris Agreement has been ratified by 122 of the 197 parties to the convention. This Agreement does not define renewable energy sources, and does not even use the words “renewable,” “biomass,” or “wood”. You can download this Agreement at the following link:

http://unfccc.int/paris_agreement/items/9485.php

The Renewable Energy Policy Network for the 21st Century (REN21), based in Paris, France, is described as, “a global renewable energy multi-stakeholder policy network that provides international leadership for the rapid transition to renewable energy.” Their recent report, “Renewables 2016 Global Status Report,” provides an up-to-date summary of the status of the renewable energy industry, including the biomass industry, which accounts for the use of wood as a renewable biomass fuel. The REN21 report notes:

“Ongoing debate about the sustainability of bioenergy, including indirect land-use change and carbon balance, also affected development of this sector. Given these challenges, national policy frameworks continue to have a large influence on deployment.”

You can download the 2016 REN21 report at the following link:

http://www.ren21.net/wp-content/uploads/2016/05/GSR_2016_Full_Report_lowres.pdf

For a revealing look at the European Union’s (EU) position on the use of biomass as an energy source, see the September 2015 European Parliament briefing, “Biomass for electricity and heating opportunities and challenges,” at the following link:

http://www.europarl.europa.eu/RegData/etudes/BRIE/2015/568329/EPRS_BRI(2015)568329_EN.pdf

Here you’ll see that burning biomass as an energy source in the EU is accorded similar carbon-neutral status to generating energy from wind, solar and hydro. The EU’s rationale is stated as follows:

“Under EU legislation, biomass is carbon neutral, based on the assumption that the carbon released when solid biomass is burned will be re-absorbed during tree growth. Current EU policies provide incentives to use biomass for power generation.”

This policy framework, which treats biomass as a carbon neutral energy source, is set by the EU’s 2009 Renewable Energy Directive (Directive 2009/28/EC), which requires that renewable energy sources account for 20% of the EU energy mix by 2020. You can download this directive at the following link:

http://eur-lex.europa.eu/legal-content/EN/TXT/?qid=1436259271952&uri=CELEX:02009L0028-20130701

The EU’s equation seems pretty simple: renewable = carbon neutral

EU policy assessment

In 2015, the organization Climate Central produced an assessment of this EU policy in a three-part document entitled, “Pulp Fiction – The European Accounting Error That’s Warming the Planet.” Their key points are summarized in the following quotes extracted from “Pulp Fiction”:

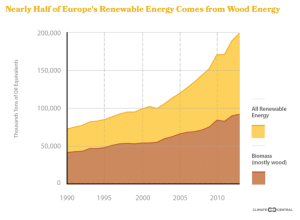
“Wood has quietly become the largest source of what counts as ‘renewable’ energy in the EU. Wood burning in Europe produced as much energy as burning 620 million barrels of oil last year (both in power plants and for home heating). That accounted for nearly half of all Europe’s renewable energy. That’s helping nations meet the requirements of EU climate laws on paper, if not in spirit.”

Pulp Fiction chart

“The wood pellet mills are paying for trees to be cut down — trees that could be used by other industries, or left to grow and absorb carbon dioxide. And the mills are being bankrolled by climate subsidies in Europe, where wood pellets are replacing coal at a growing number of power plants.”

”That loophole treats electricity generated by burning wood as a ‘carbon neutral’ or ‘zero emissions’ energy source — the same as solar panels or wind turbines. When power plants in major European countries burn wood, the only carbon dioxide pollution they report is from the burning of fossil fuels needed to manufacture and transport the woody fuel. European law assumes climate pollution released directly by burning fuel made from trees doesn’t matter, because it will be re-absorbed by trees that grow to replace them.”

“Burning wood pellets to produce a megawatt-hour of electricity produces 15 to 20 percent more climate-changing carbon dioxide pollution than burning coal, analysis of Drax (a UK power plant) data shows. And that’s just the CO2 pouring out of the smokestack. Add in pollution from the fuel needed to grind, heat and dry the wood, plus transportation of the pellets, and the climate impacts are even worse. According to Enviva (a fuel pellet manufacturer), that adds another 20 percent worth of climate pollution for that one megawatt-hour.”

“No other country or U.S. region produces more wood and pulp every year than the Southeast, where loggers are cutting down roughly twice as many trees as they were in the 1950s.”

“But as this five-month Climate Central investigation reveals, renewable energy doesn’t necessarily mean clean energy. Burning trees as fuel in power plants is heating the atmosphere more quickly than coal.”

You can access the first part of “Pulp Fiction” at the following link and then easily navigate to the other two parts.

http://reports.climatecentral.org/pulp-fiction/1/

In the U.S., the Natural Resources Defense Council (NRDC) has made a similar finding. Check out the NRDC’s May 2015 Issue Brief, “Think Wood Pellets are Green? Think Again,” at the following link:

https://www.nrdc.org/sites/default/files/bioenergy-modelling-IB.pdf

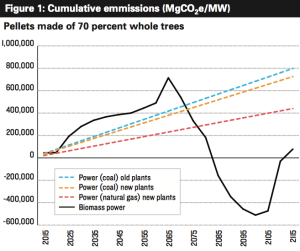
NRDC examined three cases of cumulative emissions from fuel pellets made from 70%, 40% and 20% whole trees. The NRDC chart for the 70% whole tree case is shown below.

NRDC cumulative emissions from wood pellets

You can see that the NRDC analysis indicates that cumulative emissions from burning wood pellets exceeds the cumulative emissions from coal and natural gas for many decades. After about 50 years, forest regrowth can recapture enough carbon to offset the cumulative emissions from wood pellets to below the levels for of fossil fuels. It takes about 15 – 20 more years to reach “carbon neutral” (zero net CO2 emissions) in the early 2080s.

The NRDC report concludes

“In sum, our modeling shows that wood pellets made of whole trees from bottomland hardwoods in the Atlantic plain of the U.S. Southeast—even in relatively small proportions— will emit carbon pollution comparable to or in excess of fossil fuels for approximately five decades. This 5-decade time period is significant: climate policy imperatives require dramatic short-term reductions in greenhouse gas emissions, and emissions from these pellets will persist in the atmosphere well past the time when significant reductions are needed.“

The situation in the U.S.

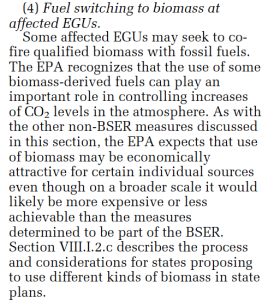
The U.S. Clean Power Plan, Section V.A, “The Best System of Emission Reduction,” (BSER) defines EPA’s determination of the BESR for reducing CO2 emissions from existing electric generating units. In Section V.A.6, EPA identifies areas of compliance flexibility not included in the BESR. Here’s what EPA offers regarding the use of biomass as a substitute for fossil fuels.

EPA CPP non-BESR

This sounds a lot like what is happening at the Drax power plant in the UK, where three of the six Drax units are co-firing wood pellets along with the other three units that still are operating with coal.

Fortunately, this co-firing option is a less attractive option under the Clean Power Plan than it is under the EU’s Renewable Energy Directive.

You can download the EPA’s Clean Power Plan at the following link:

https://www.epa.gov/cleanpowerplan/clean-power-plan-existing-power-plants#CPP-final

On 9 February 2016, the U.S. Supreme Court stayed implementation of the Clean Power Plan pending judicial review.

In conclusion

The character J. Wellington Wimpy in the Popeye cartoon by Hy Eisman is well known for his penchant for asking for a hamburger today in exchange for a commitment to pay for it in the future.

Wimpy

It seems to me that the EU’s Renewable Energy Directive is based on a similar philosophy. The “renewable” biomass carbon debt being accumulated now by the EU will not be repaid for 50 – 80 years.

The EU’s Renewable Energy Directive is little more than a time-shifted carbon trading scheme in which the cumulative CO2 emissions from burning a particular carbon-based fuel (wood pellets) are mitigated by future carbon sequestration in new-growth forests. This assumes that the new-growth forests are re-planted as aggressively as the old-growth forests are harvested for their biomass fuel content. By accepting this time-shifted carbon trading scheme, the EU has accepted a 50 – 80 year delay in tangible reductions in the cumulative emissions from burning carbon-based fuels (fossil or biomass).

So, if the EU’s Renewable Energy Directive is acceptable for biomass, why couldn’t a similar directive be developed for fossil fuels, which, pound-for-pound, have lower emissions than biomass? The same type of time-shifted carbon trading scheme could be achieved by aggressively planting new-growth forests all around the world to deliver the level of carbon sequestration needed to enable any fossil fuel to meet the same “carbon neutral” criteria that the EU Parliament, in all their wisdom, has applied to biomass.

If the EU Parliament truly accepts what they have done in their Renewable Energy Directive, then I challenge them to extend that “Wimpy” Directive to treat all carbon-based fuels on a common time-shifted carbon trading basis.

I think a better approach would be for the EU to eliminate the “carbon neutral” status of biomass and treat it the same as fossil fuels. Then the economic incentives for burning the more-polluting wood pellets would be eliminated, large-scale deforestation would be avoided, and utilities would refocus their portfolios of renewable energy sources on generators that really are “carbon neutral”.

Mechs are not Just for Science Fiction any More

Peter Lobner

Mechs (aka “mechanicals” and “mechas”) are piloted robots that are distinguished from other piloted vehicles by their humanoid / biomorphic appearance (i.e., they emulate the general shape of humans or other living organisms). Mechs can give the pilot super-human strength, mobility, and access to an array of tools or weapons while providing protection from hazardous environments and combat conditions. Many science fiction novels and movies have employed mechs in various roles. Now, technology has advanced to the point that the first practical mech is under development and entering the piloted test phase.

Examples of humanoid mechs in science fiction

If you saw the 2009 James Cameron’s movie Avatar, then you have seen the piloted Amplified Mobility Platform (AMP) suit shown below. In the movie, this multi-purpose mech protects the pilot against hazardous environmental conditions while performing a variety of tasks, including heavy lifting and armed combat. The AMP concept, as applied in Avatar, is described in detail at the following link:

http://james-camerons-avatar.wikia.com/wiki/Amplified_Mobility_Platform

 Avatar AMP suitAvatar AMP suit. Source: avatar.wikia.com

 The 2013 Guillermo del Toro’s movie Pacific Rim featured the much larger piloted Jaeger mechs designed to fight Godzilla-size creatures.

 Pacific Rim JaegersJaegers. Source: Warner Bros Pictures

 Actual fighting mechs

One of the first actual mechs was Kuratas; a rideable, user-operated mech developed in Japan in 2012 by Suidobashi Heavy Industry for fighting mech competitions. Kuratas’ humanoid torso is supported by four legs, each riding on a hydraulically driven wheel. This diesel-powered mech is 4.6 meters (15 feet) tall and weighs about five tons.

kuratas Kuratas. Source: howthingsworkdaily.com

Suidobashi Heavy Industry uses its own proprietary operating system, V-Sido OS. The system software integrates routines for balance and movement, with the goal of optimizing stability and preventing the mech from falling over on uneven surfaces or during combat. While Kuratas is designed for operation by a single pilot, it also can be operated remotely by an internet-enabled phone.

suidobashi-heavy-industrys-ceo-kogoro-kurataKuratas cockpit. Source IB Times UK

For more information on Kuratas’ design and operation watch the Suidobashi Heavy Industry video at the following link:

https://www.youtube.com/watch?v=29MD29ekoKI

Also visit the Suidobashi Heavy Industry website at the following link:

http://suidobashijuko.jp

It appears that you can buy your own Kuratas on Amazon Japan for  ¥ 120,000,000 (about $1.023 million) plus shipping charges. Here’s the link in case you are interested in buying a Kuratas.

https://www.amazon.co.jp/水道橋重工-SHI-KR-01-クラタス-スターターキット/dp/B00H6V3BWA/ref=sr_1_3/351-2349721-0400049?s=hobby&ie=UTF8&qid=1483572701&sr=1-3

You’ll find a new owner’s orientation video at the following link:

https://www.youtube.com/watch?v=2iZ0WuNvHr8

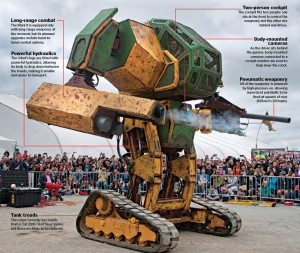
A competitor in the fighting mech arena is the 4.6 meter (15 feet) tall, 5.4 ton MegaBot Mark II built by the American company MegaBots, Inc. The Mark II’s torso is supported by an articulated framework driven by two tank treads that provide a stable base and propulsion.

Megabot Mark IIMegaBot Mark II. Source: howthingsworkdaily.com

Mark II’s controls are built on the widely-used Robot OS (ROS) operating system, which is described by the OS developers as:

“….a flexible framework for writing robot software. It is a collection of tools, libraries, and conventions that aim to simplify the task of creating complex and robust robot behavior across a wide variety of robotic platforms.”

For more information, visit the ROS website at the following link:

http://www.ros.org/about-ros/

An actual battle between Kuratas and MegaBot Mark II has been proposed (since 2014), but has been delayed many times. On October 2016, MegaBots, Inc. determined that the Mark II was unsafe for hand-to-hand mech fighting and announced it was abandoning this design. Its replacement will be a larger (10 ton) Mk III with a safer cockpit, more powerful engine, higher speed (10 mph) and faster-acting hydraulic valves. Development and operation of MegaBot Mark III is shown in a series of 2016 videos at the following link:

https://www.megabots.com/episodes

Here’s a look at a MegaBot Mark III torso (attached to a test base instead of the actual base) about to pick up a car during development testing.

Megabot Mark IIIMegaBot Mark III. Source: MegaBot

Worldwide  interest in the Kuratas – MegaBot fighting match has spawned interest in a future mech fighting league.

Actual potentially-useful mechs

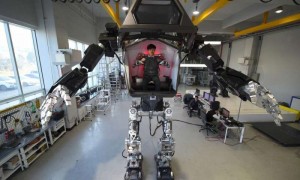
South Korean firm Hankook Mirae Technology has developed a four-meter-tall (13-foot), 1.5 ton, bipedal humanoid mech named Method v2 as a test-bed for various technologies that can be applied and scaled for future operational mechs. Method v2 does not have an internal power source, but instead receives electric power via a tether from an external power source.

The company chairman Yang Jin-Ho said:

“Our robot is the world’s first manned bipedal robot and is built to work in extreme hazardous areas where humans cannot go (unprotected).”

See details on the Hankook Mirae website at the following link:

http://hankookmirae.tech/main/main.html

As is evident in the photos below, Method v2 has more than a passing resemblance the AMP suit in Avatar.

Method v2Method v2. Source: Hankook Mirae Technology

A pilot sitting inside the robot’s torso makes limb movements that are mimicked by the Method v2 control system.

Method v2 torsoMethod v2 torso mimics pilot’s arm and hand motions. Source: Hankook Mirae Technology

Method v2 cockpitMethod v2 cockpit. Source: Hankook Mirae Technology

The first piloted operation of the Method v2 mech took place on 27 December 2016. Watch a short video of manned testing and an unmanned walking test at the following link:

https://www.youtube.com/watch?v=G9y34ghJNU0

You can read more about the test at the following link:

http://phys.org/news/2016-12-avatar-style-korean-robot-baby.html

Cow Farts Could be Subject to Regulation Under a New California Law

Peter Lobner

On 19 September 2016, California Governor Jerry Brown signed into law Senate Bill No. 1383 that requires the state to cut methane (CH4) emissions by 40% from 2013 levels by 2030. Now before I say anything about this bill and the associated technology for bovine methane control, you have an opportunity to read the full text of SB 1383 at the following link:

https://leginfo.legislature.ca.gov/faces/billNavClient.xhtml?bill_id=201520160SB1383

You’ll also find a May 2016 overview and analysis here:

https://www.ceres.org/files/water/sb-1383-slcp-summary/at_download/file

The problem statement from the cow’s perspective:

Cows are ruminants with a digestive system that includes a few digestive organs not found in the simpler monogastric digestive systems of humans and many other animals. Other ruminant species include sheep, goat, elk, deer, moose, buffalo, bison, giraffes and camels. Other monogastric species include apes, chimpanzees, horses, pigs, chickens and rhinos.

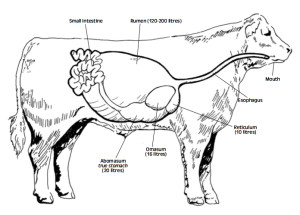
As explained by the BC Agriculture in the Classroom Foundation:

“Instead of one compartment to the stomach they (ruminants) have four. Of the four compartments the rumen is the largest section and the main digestive center. The rumen is filled with billions of tiny microorganisms that are able to break down (through a process called enteric fermentation) grass and other coarse vegetation that animals with one stomach (including humans, chickens and pigs) cannot digest.

 Ruminant animals do not completely chew the grass or vegetation they eat. The partially chewed grass goes into the large rumen where it is stored and broken down into balls of “cud”. When the animal has eaten its fill it will rest and “chew its cud”. The cud is then swallowed once again where it will pass into the next three compartments—the reticulum, the omasum and the true stomach, the abomasum.”

Cow digestive system

Source: BC Agriculture in the Classroom Foundation

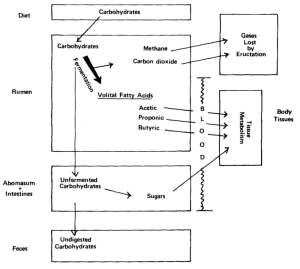
Generation of methane and carbon dioxide in ruminants results from their digestion of carbohydrates in the rumen (their largest digestive organ) as shown in the following process diagram. Cows don’t generate methane from metabolizing proteins or fats.

Cow digestion of carbs

Source: Texas Agricultural Extension Service

You’ll find the similar process diagrams for protein and fat digestion at the following link:

http://animalscience.tamu.edu/wp-content/uploads/sites/14/2012/04/nutrition-cows-digestive-system.pdf

Argentina’s National Institute for Agricultural Technology (INTA) has conducted research into methane emissions from cows and determined that a cow produces about 300 liters of gas per day. At standard temperature and pressure (STP) conditions, that exceeds the volume of a typical cow’s rumen (120 – 200 liters), so frequent bovine farting probably is necessary for the comfort and safety of the cow.

The problem statement from the greenhouse gas perspective:

The U.S. Environmental Protection Agency (EPA) reported U.S. greenhouse gas emissions for the period from 1990 to 2014 in document EPA 430-R-16-002, which you can download at the following link:

https://www3.epa.gov/climatechange/Downloads/ghgemissions/US-GHG-Inventory-2016-Main-Text.pdf

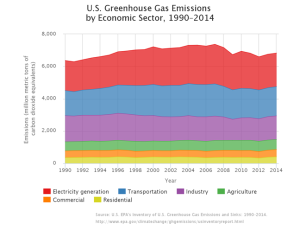
Greenhouse gas emissions by economic sector are shown in the following EPA chart.

us-greenhouse-gas-emissions-economic-1990-2014

For the period from 1990 to 2014, total emissions from the agricultural sector, in terms of CO2 equivalents, have been relatively constant.

Regarding methane contributions to greenhouse gas, the EPA stated:

“Methane is emitted during the production and transport of coal, natural gas, and oil. Methane emissions also result from livestock and other agricultural practices and by the decay of organic waste in municipal solid waste landfills.

Also, when animals’ manure is stored or managed in lagoons or holding tanks, CH4 is produced. Because humans raise these animals for food, the emissions are considered human-related. Globally, the Agriculture sector is the primary source of CH4 emissions.”

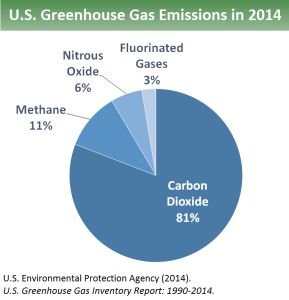
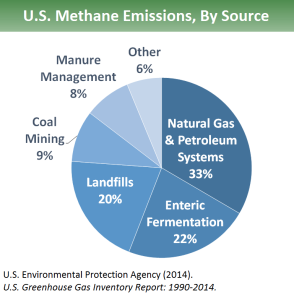
The components of U.S. 2014 greenhouse gas emissions and a breakdown of methane sources are shown in the following two EPA charts.

Sources of GHG

Sources of Methane

In 2014, methane made up 11% of total U.S. greenhouse gas emissions. Enteric fermentation is the process that generates methane in the rumen of cows and other ruminants, which collectively contribute 2.42% to total U.S. greenhouse gas emissions. Manure management from all sorts of farm animals collectively contributes another 0.88% to total U.S. greenhouse gas emissions.

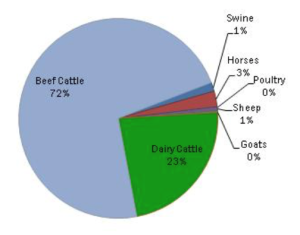
EPA data from 2007 shows the following distribution of sources of enteric fermentation among farting farm animals.

Animal sources of methane

Source: EPA, 2007

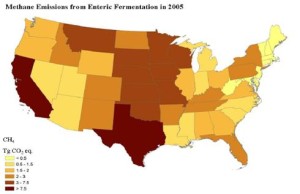
So it’s clear that cattle are the culprits. By state, the distribution of methane production from enteric fermentation is shown in the following map.

State sources of methane

Source: U.S. Department of Agriculture, 2005

On this map, California and Texas appear to be the largest generators of methane from ruminants. More recent data on the cattle population in each state as of 1 January 2015 is available at the following link:

http://www.cattlenetwork.com/advice-and-tips/cowcalf-producer/cattle-inventory-ranking-all-50-states

Here, the top five states based on cattle population are: (1) Texas @ 11.8 million, (2) Nebraska @ 6.3 million, (3) Kansas @ 6.0 million, (4) California @ 5.2 million, and (5) Oklahoma @ 4.6 million.  Total U.S. population of cattle and calves is about 89.5 million.

This brings us back to California’s new law.

The problem statement from the California legislative perspective:

The state has the power to do this, as summarized in the preamble in SB 1383:

“The California Global Warming Solutions Act of 2006 designates the State Air Resources Board as the state agency charged with monitoring and regulating sources of emissions of greenhouse gases. The state board is required to approve a statewide greenhouse gas emissions limit equivalent to the statewide greenhouse gas emissions level in 1990 to be achieved by 2020. The state board is also required to complete a comprehensive strategy to reduce emissions of short-lived climate pollutants, as defined, in the state.”

Particular requirements that apply to the state’s bovine population are the following:

“Work with stakeholders to identify and address technical, market, regulatory, and other challenges and barriers to the development of dairy methane emissions reduction projects.” [39730.7(b)(2)(A)]

“Conduct or consider livestock and dairy operation research on dairy methane emissions reduction projects, including, but not limited to, scrape manure management systems, solids separation systems, and enteric fermentation.” [39730.7(b)(2)(C)(i)]

“Enteric emissions reductions shall be achieved only through incentive-based mechanisms until the state board, in consultation with the department, determines that a cost-effective, considering the impact on animal productivity, and scientifically proven method of reducing enteric emissions is available and that adoption of the enteric emissions reduction method would not damage animal health, public health, or consumer acceptance. Voluntary enteric emissions reductions may be used toward satisfying the goals of this chapter.” [39730.7(f)]

By 1 July 2020, the State Air Resources Board is  required to assess the progress made by the dairy and livestock sector in achieving the goals for methane reduction. If this assessment shows that progress has not been made because of insufficient funding, technical or market barriers, then the state has the leeway to reduce the goals for methane reduction.

Possible technical solution

As shown in a chart above, several different industries contribute to methane production. One way to achieve most of California’s 40% reduction goal in the next 14 years would be to simply move all cattle and dairy cow businesses out of state and clean up the old manure management sites. While this actually may happen for economic reasons, let’s look at some technical alternatives.

  • Breed cows that generate less methane
  • Develop new feed for cows, which could help cows better digest their food and produce less methane.
  • Put a plug in it
  • Collect the methane from the cows

Any type of genetically modified organism (GMO) doesn’t go over well in California, so I think a GMO reduced methane producing cow is simply a non-starter.

A cow’s diet consists primarily of carbohydrates, usually from parts of plants that are not suitable as food for humans and many other animals. The first step in the ruminant digestion process is fermentation in the rumen, and this is the source of methane gas. The only option is to put cows on a low-carb diet. That would be impossible to implement for cows that are allowed to graze in the field.

Based on a cow’s methane production rate, putting a cork in it is a very short-term solution, at best, and you’ll probably irritate the cow.  However, some humorists find this to be an option worthy of further examination.

Source: Taint

That leaves us with the technical option of collecting the methane from the cows. Two basic options exist: collect the methane from the rumen, or from the other end of the cow. I was a bit surprised that several examples of methane collecting “backpacks” have been developed for cows. Unanimously, and much to the relief of the researchers, the international choice for methane collection has been from the rumen.

So, what does a fashionable, environmentally-friendly cow with a methane-collecting backpack look like?

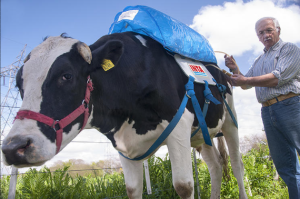
Argentina’s INTA took first place with the sleek blue model shown below.

Argentine cowSource: INTA

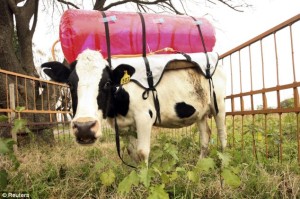
Another INTA example was larger and more colorful, but considerably less stylish. Even if this INTA experiment fails to yield a practical solution for collecting methane from cows, it clearly demonstrates that cows have absolutely no self-esteem.

Daily Mail cow methane collectorSource: INTA

In Australia, these cows are wearing smaller backpacks just to measure their emissions.

Australian cowSource: sciencenews.org

Time will tell if methane collection devices become de rigueur for cattle and dairy cows in California or anywhere else in the world. While this could spawn a whole new industry for tending those inflating collection devices and making productive use of the collected methane, I can’t imagine that the California economy could actually support the cost for managing such devices for all of the state’s 5.2 million cattle and dairy cows.

Of all the things we need in California, managing methane from cow farts (oops, I meant to say enteric fermentation) probably is at the very bottom of most people’s lists, unless they’re on the State Air Resources Board.

20 February 2019 Update:  “Negative Emissions Technology” (NET) may be an appropriate solution to methane production from ruminent animals

 In my 19 February 2019 post, “Converting Carbon Dioxide into Useful Products,” I discussed the use of NETs as a means to reduce atmospheric carbon dioxide by deploying carbon dioxide removal “factories” that can be sited independently from the sources of carbon dioxide generation.  An appropriately scaled and sited NET could mitigate the effects of methane released to the atmosphere from all ruminent animals in a selected region, with the added benefit of not interfering directly with the animals.  You can read my post here:

https://lynceans.org/all-posts/converting-carbon-dioxide-into-useful-products/

Severe Space Weather Events Will Challenge Critical Infrastructure Systems on Earth

Peter Lobner

What is space weather?

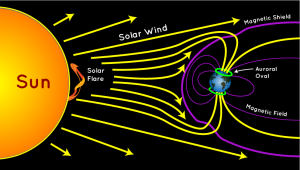
Space weather is determined largely by the variable effects of the Sun on the Earth’s magnetosphere. The basic geometry of this relationship is shown in the following diagram, with the solar wind always impinging on the Earth’s magnetic field and transferring energy into the magnetosphere.  Normally, the solar wind does not change rapidly, and Earth’s space weather is relatively benign. However, sudden disturbances on the Sun produce solar flares and coronal holes that can cause significant, rapid variations in Earth’s space weather.
auroradiagramSource: http://scijinks.jpl.nasa.gov/aurora/

A solar storm, or geomagnetic storm, typically is associated with a large-scale magnetic eruption on the Sun’s surface that initiates a solar flare and an associated coronal mass ejection (CME). A CME is a giant cloud of electrified gas (solar plasma.) that is cast outward from the Sun and may intersect Earth’s orbit. The solar flare also releases a burst of radiation in the form of solar X-rays and protons.

The solar X-rays travel at the speed of light, arriving at Earth’s orbit in 8 minutes and 20 seconds. Solar protons travel at up to 1/3 the speed of light and take about 30 minutes to reach Earth’s orbit. NOAA reports that CMEs typically travel at a speed of about 300 kilometers per second, but can be as slow as 100 kilometers per second. The CMEs typically take 3 to 5 days to reach the Earth and can take as long as 24 to 36 hours to pass over the Earth, once the leading edge has arrived.

If the Earth is in the path, the X-rays will impinge on the Sun side of the Earth, while charged particles will travel along magnetic field lines and enter Earth’s atmosphere near the north and south poles. The passing CME will transfer energy into the magnetosphere.

Solar storms also may be the result of high-speed solar wind streams (HSS) that emanate from solar coronal holes (an area of the Sun’s corona with a weak magnetic field) with speeds up to 3,000 kilometers per second. The HSS overtakes the slower solar wind, creating turbulent regions (co-rotating interaction regions, CIR) that can reach the Earth’s orbit in as short as 18 hours. A CIR can deposit as much energy into Earth’s magnetosphere as a CME, but over a longer period of time, up to several days.

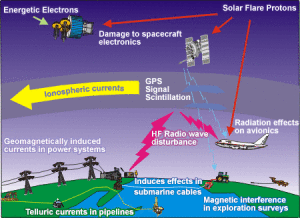
Solar storms can have significant effects on critical infrastructure systems on Earth, including airborne and space borne systems. The following diagram highlights some of these vulnerabilities.
Canada Geomagnetic-Storms-effects-space-weather-technologyEffects of Space Weather on Modern Technology. Source: SpaceWeather.gc.ca

Characterizing space weather

The U.S. National Oceanic and Atmospheric Administration (NOAA) Space Weather Prediction Center (SWPC) uses the following three scales to characterize space weather:

  • Geomagnetic storms (G): intensity measured by the “planetary geomagnetic disturbance index”, Kp, also known as the Geomagnetic Storm or G-Scale
  • Solar radiation storms (S): intensity measured by the flux level of ≥ 10 MeV solar protons at GEOS (Geostationary Operational Environmental Satellite) satellites, which are in synchronous orbit around the Earth.
  • Radio blackouts (R): intensity measured by flux level of solar X-rays at GEOS satellites.

Another metric of space weather is the Disturbance Storm Time (Dst) index, which is a measure of the strength of a ring current around Earth caused by solar protons and electrons. A negative Dst value means that Earth’s magnetic field is weakened, which is the case during solar storms.

A single solar disturbance (a CME or a CIR) will affect all of the NOAA scales and Dst to some degree.

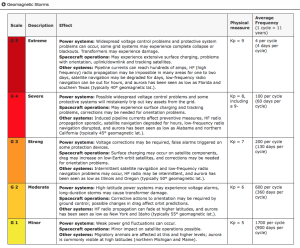
As shown in the following NOAA table (click on table to enlarge), the G-scale describes the infrastructure effects that can be experienced for five levels of geomagnetic storm severity. At the higher levels of the scale, significant infrastructure outages and damage are possible.
NOAA geomag storm scale

There are similar tables for Solar Radiation Storms and Radio Blackouts on the NOAA SWPC website at the following link:

http://www.swpc.noaa.gov/noaa-scales-explanation

Another source for space weather information is the spaceweather.com website, which contains some information not found on the NOAA SWPC website. For example, this website includes a report of radiation levels in the atmosphere at aviation altitudes and higher in the stratosphere. In the following chart, “dose rates are expressed as multiples of sea level. For instance, we see that boarding a plane that flies at 25,000 feet exposes passengers to dose rates ~10x higher than sea level. At 40,000 feet, the multiplier is closer to 50x.”
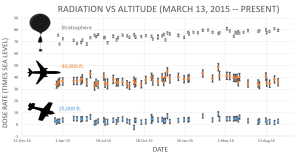
 spaceweather rad levelsSource: spaceweather.com

You’ll also find a report of recent and upcoming near-Earth asteroids on the spaceweather.com website. This definitely broadens the meaning of “space weather.” As you can seen the in the following table, no close encounters are predicted over the next two months.
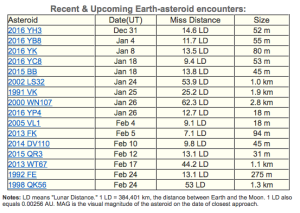
spaceweather NEOs

In summary, the effects of a solar storm may include:

  • Interference with or damage to spacecraft electronics: induced currents and/or energetic particles may have temporary or permanent effects on satellite systems
  • Navigation satellite (GPS, GLONASS and Galileo) UHF / SHF signal scintillation (interference)
  • Increased drag on low Earth orbiting satellites: During storms, currents and energetic particles in the ionosphere add energy in the form of heat that can increase the density of the upper atmosphere, causing extra drag on satellites in low-earth orbit
  • High-frequency (HF) radio communications and low-frequency (LF) radio navigation system interference or signal blackout
  • Geomagnetically induced currents (GICs) in long conductors can trip protective devices and may damage associated hardware and control equipment in electric power transmission and distribution systems, pipelines, and other cable systems on land or undersea.
  • Higher radiation levels experienced by crew & passengers flying at high latitudes in high-altitude aircraft or in spacecraft.

For additional information, you can download the document, “Space Weather – Effects on Technology,” from the Space Weather Canada website at the following link:

http://ftp.maps.canada.ca/pub/nrcan_rncan/publications/ess_sst/292/292124/gid_292124.pdf

Historical major solar storms

The largest recorded geomagnetic storm, known as the Carrington Event or the Solar Storm of 1859, occurred on 1 – 2 September 1859. Effects included:

  • Induced currents in long telegraph wires, interrupting service worldwide, with a few reports of shocks to operators and fires.
  • Aurorea seen as far south as Hawaii, Mexico, Caribbean and Italy.

This event is named after Richard Carrington, the solar astronomer who witnessed the event through his private observatory telescope and sketched the Sun’s sunspots during the event. In 1859, no electric power transmission and distribution system, pipeline, or cable system infrastructure existed, so it’s a bit difficult to appreciate the impact that a Carrington-class event would have on our modern technological infrastructure.

A large geomagnetic storm in March 1989 has been attributed as the cause of the rapid collapse of the Hydro-Quebec power grid as induced voltages caused protective relays to trip, resulting in a cascading failure of the power grid. This event left six million people without electricity for nine hours.

A large solar storm on 23 July 2012, believed to be similar in magnitude to the Carrington Event, was detected by the STEREO-A (Solar TErrestrial RElations Observatory) spacecraft, but the storm passed Earth’s orbit without striking the Earth. STEREO-A and its companion, STEREO-B, are in heliocentric orbits at approximately the same distance from the Sun as Earth, but displaced ahead and behind the Earth to provide a stereoscopic view of the Sun.

You’ll find a historical timeline of solar storms, from the 28 August 1859 Carrington Event to the 29 October 2003 Halloween Storm on the Space Weather website at the following link:

http://www.solarstorms.org/SRefStorms.html

Risk from future solar storms

A 2013 risk assessment by the insurance firm Lloyd’s and consultant engineering firm Atmospheric and Environmental Research (AER) examined the impact of solar storms on North America’s electric grid.

electrical-power-transmission-lines-united-states-useiaU.S. electric power transmission grid. Source: EIA

Here is a summary of the key findings of this risk assessment:

  • A Carrington-level extreme geomagnetic storm is almost inevitable in the future. Historical auroral records suggest a return period of 50 years for Quebec-level (1989) storms and 150 years for very extreme storms, such as the Carrington Event (1859).
  • The risk of intense geomagnetic storms is elevated near the peak of the each 11-year solar cycle, which peaked in 2015.
  • As North American electric infrastructure ages and we become more dependent on electricity, the risk of a catastrophic outage increases with each peak of the solar cycle.
  • Weighted by population, the highest risk of storm-induced power outages in the U.S. is along the Atlantic corridor between Washington D.C. and New York City.
  • The total U.S. population at risk of extended power outage from a Carrington-level storm is between 20-40 million, with durations from 16 days to 1-2 years.
  • Storms weaker than Carrington-level could result in a small number of damaged transformers, but the potential damage in densely populated regions along the Atlantic coast is significant.
  • A severe space weather event that causes major disruption of the electricity network in the U.S. could have major implications for the insurance industry.

The Lloyds report identifies the following relative risk factors for electric power transmission and distribution systems:

  • Magnetic latitude: Higher north and south “corrected” magnetic latitudes are more strongly affected (“corrected” because the magnetic North and South poles are not at the geographic poles). The effects of a major storm can extend to mid-latitudes.
  • Ground conductivity (down to a depth of several hundred meters): Geomagnetic storm effects on grounded infrastructure depend on local ground conductivity, which varies significantly around the U.S.
  • Coast effect: Grounded systems along the coast are affected by currents induced in highly-conductive seawater.
  • Line length and rating: Induced current increases with line length and the kV rating (size) of the line.
  • Transformer design: Lloyds noted that extra-high voltage (EHV) transformers (> 500 kV) used in electrical transmission systems are single-phase transformers. As a class, these are more vulnerable to internal heating than three-phase transformers for the same level of geomagnetically induced current.

Combining these risk factors on a county-by-county basis produced the following relative risk map for the northeast U.S., from New York City to Maine. The relative risk scale covers a range of 1000. The Lloyd’s report states, “This means that for some counties, the chance of an average transformer experiencing a damaging geomagnetically induced current is more than 1000 times that risk in the lowest risk county.”
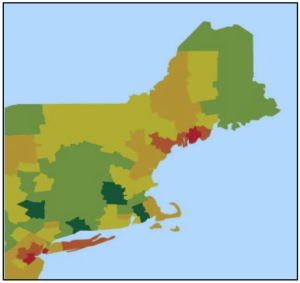
Lloyds relative risk Relative risk of power outage from geomagnetic storm. Source: Lloyd’s

You can download the complete Lloyd risk assessment at the following link:

https://www.lloyds.com/news-and-insight/risk-insight/library/natural-environment/solar-storm

In May 2013, the United States Federal Energy Regulatory Commission issued a directive to the North American Electric Reliability Corporation (NERC) to develop reliability standards to address the impact of geomagnetic disturbances on the U.S. electrical transmission system. One part of that effort is to accurately characterize geomagnetic induction hazards in the U.S. The most recent results were reported in the 19 September 2016, a paper by J. Love et al., “Geoelectric hazard maps for the continental United States.” In this report the authors characterize geography and surface impedance of many sites in the U.S. and explain how these characteristics contribute to regional differences in geoelectric risk. Key findings are:

“As a result of the combination of geographic differences in geomagnetic activity and Earth surface impedance, once-per-century geoelectric amplitudes span more than 2 orders of magnitude (factor of 100) and are an intricate function of location.”

“Within regions of the United States where a magnetotelluric survey was completed, Minnesota (MN) and Wisconsin (WI) have some of the highest geoelectric hazards, while Florida (FL) has some of the lowest.”

“Across the northern Midwest …..once-per-century geoelectric amplitudes exceed the 2 V/km that Boteler ……has inferred was responsible for bringing down the Hydro-Québec electric-power grid in Canada in March 1989.”

The following maps from this paper show maximum once-per-century geoelectric exceedances at EarthScope and U.S. Geological Survey magnetotelluric survey sites for geomagnetic induction (a) north-south and (b) east-west. In these maps, you can the areas of the upper Midwest that have the highest risk.
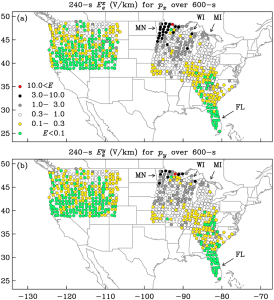
JLove Sep2016_grl54980-fig-0004

The complete paper is available online at the following link:

http://onlinelibrary.wiley.com/doi/10.1002/2016GL070469/full

Is the U.S. prepared for a severe solar storm?

The quick answer, “No.” The possibility of a long-duration, continental-scale electric power outage exists. Think about all of the systems and services that are dependent on electric power in your home and your community, including communications, water supply, fuel supply, transportation, navigation, food and commodity distribution, healthcare, schools, industry, and public safety / emergency response. Then extrapolate that statewide and nationwide.

In October 2015, the National Science and Technology Council issued the, “National Space Weather Action Plan,” with the following stated goals:

  • Establish benchmarks for space-weather events: induced geo-electric fields), ionizing radiation, ionospheric disturbances, solar radio bursts, and upper atmospheric expansion
  • Enhance response and recovery capabilities, including preparation of an “All-Hazards Power Outage Response and Recovery Plan.
  • Improve protection and mitigation efforts
  • Improve assessment, modeling, and prediction of impacts on critical infrastructure
  • Improve space weather services through advancing understanding and forecasting
  • Increase international cooperation, including policy-level acknowledgement that space weather is a global challenge

The Action Plan concludes:

“The activities outlined in this Action Plan represent a merging of national and homeland security concerns with scientific interests. This effort is only the first step. The Federal Government alone cannot effectively prepare the Nation for space weather; significant effort must go into engaging the broader community. Space weather poses a significant and complex risk to critical technology and infrastructure, and has the potential to cause substantial economic harm. This Action Plan provides a road map for a collaborative and Federally-coordinated approach to developing effective policies, practices, and procedures for decreasing the Nation’s vulnerabilities.”

You can download the Action Plan at the following link:

https://www.whitehouse.gov/sites/default/files/microsites/ostp/final_nationalspaceweatheractionplan_20151028.pdf

To supplement this Action Plan, on 13 October 2016, the President issued an Executive Order entitled, “Coordinating Efforts to Prepare the Nation for Space Weather Events,” which you can read at the following link:

https://www.whitehouse.gov/the-press-office/2016/10/13/executive-order-coordinating-efforts-prepare-nation-space-weather-events

Implementation of this Executive Order includes the following provision (Section 5):

Within 120 days of the date of this order, the Secretary of Energy, in consultation with the Secretary of Homeland Security, shall develop a plan to test and evaluate available devices that mitigate the effects of geomagnetic disturbances on the electrical power grid through the development of a pilot program that deploys such devices, in situ, in the electrical power grid. After the development of the plan, the Secretary shall implement the plan in collaboration with industry.”

So, steps are being taken to better understand the potential scope of the space weather problems and to initiate long-term efforts to mitigate their effects. Developing a robust national mitigation capability for severe space weather events will take several decades. In the meantime, the nation and the whole world remain very vulnerable to sever space weather.

Today’s space weather forecast

Based on the Electric Power Community Dashboard from NOAA’s Space Weather Prediction Center, it looks like we have mild space weather on 31 December 2016. All three key indices are green: R (radio blackouts), S (solar radiation storms), and G (geomagnetic storms). That’s be a good way to start the New Year.
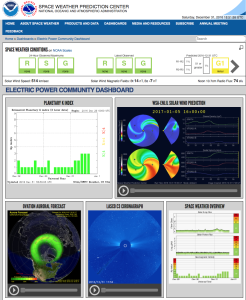
NOAA space weather 31Dec2016

See your NOAA space weather forecast at:

http://www.swpc.noaa.gov/communities/electric-power-community-dashboard

Natural Resources Canada also forecasts mild space weather for the far north.
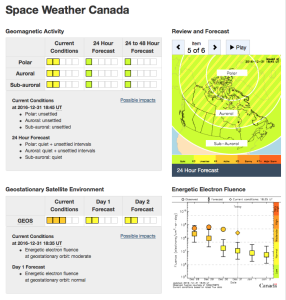
Canada space weather 31Dec2016You can see the Canadian space weather forecast at the following link:

http://www.spaceweather.gc.ca/index-en.php

4 January 2017 Update: G1 Geomagnetic Storm Approaching Earth

On 2 January, 2017, NOAA’s Space Weather Prediction Center reported that NASA’s STEREO-A spacecraft encountered a 700 kilometer per second HSS that will be pointed at Earth in a couple of days.

“A G1 (Minor) geomagnetic storm watch is in effect for 4 and 5 January, 2017. A recurrent, polar connected, negative polarity coronal hole high-speed stream (CH HSS) is anticipated to rotate into an Earth-influential position by 4 January. Elevated solar wind speeds and a disturbed interplanetary magnetic field (IMF) are forecast due to the CH HSS. These conditions are likely to produce isolated periods of G1 storming beginning late on 4 January and continuing into 5 January. Continue to check our SWPC website for updated information and forecasts.”

The coronal hole is visible as the darker regions in the following image from NASA’s Solar Dynamics Observatory (SDO) satellite, which is in a geosynchronous orbit around Earth.

NOAA SWPC 4Jan2017Source: NOAA SWPC

SDO has been observing the Sun since 2010 with a set of three instruments:

  • Helioseismic and Magnetic Imager (HMI)
  • Extreme Ultraviolet Variability Experiment (EVE)
  • Atmospheric Imaging Assembly (AIA)

The above image of the coronal hole was made by SDO’s AIA. Another view, from the spaceweather.com website, provides a clearer depiction of the size and shape of the coronal hole creating the current G1 storm.
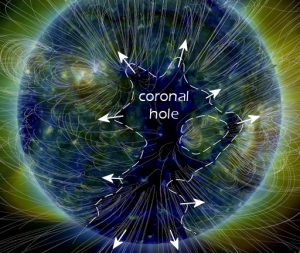
spaceweather coronal holeSource: spaceweather.com

You’ll find more information on the SDO satellite and mission on the NASA website at the following link:

https://sdo.gsfc.nasa.gov/mission/spacecraft.php

New Safe Confinement Structure Moved into Place at Chernobyl Unit 4

Peter Lobner

Following the Chernobyl accident on 26 April 1986, a concrete and steel “sarcophagus” was built around the severely damaged Unit 4 as an emergency measure to halt the release of radioactive material into the atmosphere from that unit. For details on the design and construction of the sarcophagus, including many photos of the damage at Unit 4, visit the chernobylgallery.com website at the following link:

http://chernobylgallery.com/chernobyl-disaster/sarcophagus/

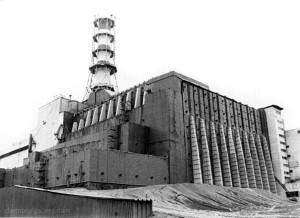
The completed sarcophagus is shown below, at left end of the 4-unit Chernobyl nuclear plant. In 1988, Soviet scientists announced that the sarcophagus would only last 20–30 years before requiring restorative maintenance work. They were a bit optimistic.

Sarcophagus overview photoThe completed sarcophagus at left end of the 4-unit Chernobyl nuclear plant. Source: chernobylgallery.com

Sarcophagus closeup photoClose-up of the sarcophagus. Source: chernobylgallery.com

Inside-sarcophagusCross-section of the sarcophagus. Source: chernobylgallery.com

The sarcophagus rapidly deteriorated. In 2006, the “Designed Stabilization Steel Structure” was extended to better support a damaged roof that posed a significant risk if it collapsed. In 2010, it was found that water leaking through the sarcophagus roof was becoming radioactively contaminated as it seeped through the rubble of the damaged reactor plant and into the soil.

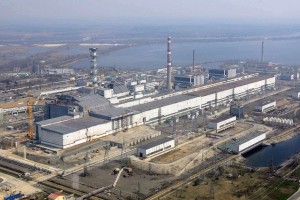
To provide a longer-term remedy for Chernobyl Unit 4, the  European Bank of Reconstruction and Development (EBRD) funded the design and construction of the New Safe Confinement (NSC, or New Shelter) at a cost of about €1.5 billion ($1.61 billion) for the shelter itself. Total project cost is expected to be about €2.1 billion ($2.25 billion).

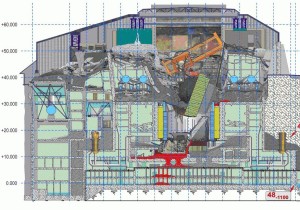
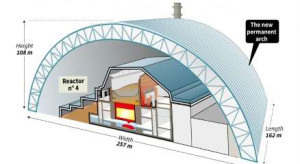
Construction by Novarka (a French construction consortium of VINCI Construction and Bouygues Construction) started in 2012. The arched NSC structure was built in two halves and joined together in 2015. The completed NSC is the largest moveable land-based structure ever built, with a span of 257 m (843 feet), a length of 162 m (531 feet), a height of 108 m (354 feet), and a total weight of 36,000 tonnes.

NSC exterior viewNSC exterior view. Source: EBRD

NSC cross section

NSC cross-section. Adapted from phys.org/news

Novarka started moving the NSC arch structure into place on 14 November 2016 and completed the task more than a week later. The arched structure was moved into place using a system of 224 hydraulic jacks that pushed the arch 60 centimeters (2 feet) each stroke. On 29 November 2016, a ceremony at the site was attended by Ukrainian president, Petro Poroshenko, diplomats and site workers, to celebrate the successful final positioning of the NSC over Chernobyl Unit 4.

EBRD reported on this milestone:

“Thirty years after the nuclear disaster in Chernobyl, the radioactive remains of the power plant’s destroyed reactor 4 have been safely enclosed following one of the world’s most ambitious engineering projects.

Chernobyl’s giant New Safe Confinement (NSC) was moved over a distance of 327 meters (1,072 feet) from its assembly point to its final resting place, completely enclosing a previous makeshift shelter that was hastily assembled immediately after the 1986 accident.

The equipment in the New Safe Confinement will now be connected to the new technological building, which will serve as a control room for future operations inside the arch. The New Safe Confinement will be sealed off from the environment hermetically. Finally, after intensive testing of all equipment and commissioning, handover of the New Safe Confinement to the Chernobyl Nuclear Power Plant administration is expected in November 2017.”

You can see EBRD’s short video of this milestone, “Unique engineering feat concluded as Chernobyl arch reaches resting place,” at the following link

https://www.youtube.com/watch?v=dH1bv9fAxiY

The NSC has an expected lifespan of at least 100 years.

The NSC is fitted with an overhead crane to allow for the future dismantling of the existing sarcophagus and the remains of Chernobyl Unit 4.

Redefining the Kilogram

Peter Lobner

Since my early science classes, I’ve been content knowing that a mass of 1.0 kilogram weighed about 2.205 pounds. In fact, the mass of a kilogram is defined to a much higher level of precision.

The U.S. National Institute of Standards and Technology (NIST) describes the current international standard for the kilogram as follows:

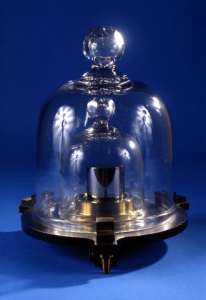
“For more than a century, the kilogram (kg) – the fundamental unit of mass in the International System of Units (SI) – has been defined as exactly equal to the mass of a small polished cylinder, cast in 1879 of platinum and iridium, which is kept in a triple-locked vault on the outskirts of Paris.

That object is called the International Prototype of the Kilogram (IPK), and the accuracy of every measurement of mass or weight worldwide, whether in pounds and ounces or milligrams and metric tons, depends on how closely the reference masses used in those measurements can be linked to the mass of the IPK.”

Key issues with the current kilogram standard

The kilogram is the only SI unit still defined in terms of a manufactured object. Continued use of this standard definition of the kilogram creates the following problems: lack of portability, drift, and scalability.

Lack of portability

The IPK is used to calibrate several copies held at the International Bureau of Weights and Measures (BIPM) in Sevres, France. The IPK also is used to calibrate national “primary” standard kilograms, which in turn are used to calibrate national “working” standard kilograms, all with traceability back to the IPK. The “working” standards are used to calibrate various lower-level standards used in science and industry. In the U.S., NIST is responsible for managing our mass standards, including the primary prototype national standard known as K20, which is shown in the photo below.

NIST K20  K20. Source: NIST

Drift

There is a laborious process for making periodic comparisons among the various standard kilogram artifacts. Surprisingly, it has been found that the measured mass of each individual standard changes, or “drifts,” over time. NIST reports on this phenomena:

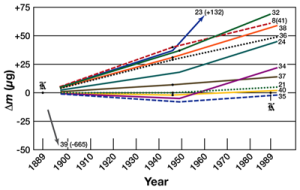
“Theoretically, of course, the IPK mass cannot actually change. Because it defines the kilogram, its mass is always exactly 1 kg. So change is expressed as variation with reference to the IPK on the rare occasions in which the IPK is brought out of storage and compared with its official “sister” copies as well as national prototypes from various countries. These “periodic verifications” occurred in 1899-1911, 1939-53, and 1988-92. In addition, a special calibration, involving only BIPM’s own mass standards, was conducted in 2014.

The trend over the past century has been for most of BIPM’s official copies to gain mass relative to the IPK, although by somewhat different amounts, averaging around 50 micrograms (millionths of a gram, abbreviated µg) over 100 years. Alternatively, of course, the IPK could be losing mass relative to its copies.”

The NIST chart below shows the change in BIPM prototype mass artifacts (identified by numbers) over time compared to the mass of the IPK.

IPK prototype_mass_drift

Scalability

The IPK defines the standard kilogram. However, there is no manufactured artifact that defines an international “standard milligram,” a “standard metric ton,” or any other fraction or multiple of the IPK.  NIST observed:

“…..the present system is not easily scalable. The smaller the scale, the larger the uncertainty in measurement because a very long sequence of comparisons is necessary to get from a 1 kg standard down to tiny metal mass standards in the milligram (mg) range, and each comparison entails an added uncertainty. As a result, although a 1 kg artifact can be measured against a 1 kg standard to an uncertainty of a few parts in a billion, a milligram measured against the same 1 kg has relative uncertainties of a few parts in ten thousand.”

Moving toward a new definition of the standard kilogram

On 21 October 2011, the General Conference on Weights and Measures agreed on a plan to redefine the kilogram in terms of an invariant of nature. There are competing proposals on how to do this. The leading candidates are described below.

The Watt Balance

The Watt Balance is the likely method to be approved for redefining the kilogram. It uses electromagnetic forces to precisely balance the force of gravity on a test mass. The mass is defined in terms of the strength of the magnetic field and the current flowing through a magnet coil. The latest NIST Watt Balance is known as NIST-4, which became operational in early 2015. NIST-4 is able to establish the unit of mass with an uncertainty of 3 parts in 108.

You can read more about the operation of the NIST-4 Watt Balance and watch a short video on its operating at the following link:

https://www.nist.gov/pml/redefining-kilogram-watt-balance

Using a Watt Balance to redefine the kilogram introduces its own complications, as described by NIST:

“In the method believed most likely to be adopted by the ……BIPM to redefine the kilogram, an exact determination of the Planck constant is essential. And to measure the Planck constant on a watt balance, the local acceleration of gravity, g, must be known to high precision. Hence the importance of a head-to-head comparison of the gravimeters used by each watt-balance team.”

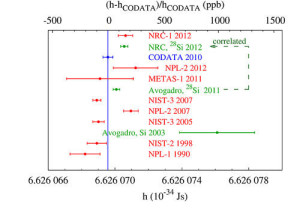
The 2012 North American Watt Balance Absolute Gravity Comparison produced the following estimates of the Planck Constant.

Planck Constant determinations

In this chart:

  • Blue: current standard value of the Planck Constant from the international Committee on Data for Science and Technology
  • Red: Values obtained from watt balances
  • Green: Values obtained from other methods

The researchers noted that there is a substantial difference among instruments. This matter needs to be resolved in order for the Watt Balance to become the tool for defining the international standard kilogram.

International Avogadro Project

An alternate approach for redefining the kilogram has been suggested by the International Avogadro Project, which proposes a definition based on the Avogadro constant (NA). An approximate value of NA is 6.022 x 10²³. To compete in accuracy and reliability with the current kilogram standard, NA must be defined with greater precision, to an uncertainty of just 20 parts per billion, or 2.0 x 10-8.

The proposed new standard starts with a uniform crystal of silicon-28 that is carefully machined into a sphere with a mass of 1 kg based on the current definition. NIST describes the process:

“With precise geometrical information — the mass and dimensions of the sphere, as well as the spatial parameters of the silicon’s crystal lattice — they can use the well-known mass of each individual silicon atom to calculate the total number of atoms in the sphere. And this information, in turn, lets them determine NA.

……Once the number of atoms has been resolved with enough precision by the collaboration, the newly refined Avogadro constant could become the basis of a new recipe for realizing the kilogram.”

 Intnl Avogadro ProjectKilogram silicon sphere. Source: NIST

You’ll find more information on the International Avogadro Project on the BIPM website at the following link:

http://www.bipm.org/en/bipm/mass/avogadro/

Here the BIPM reports: Improvements of the experiments during the continued collaboration resulted in the publication of the most recent determination of the Avogadro constant in 2015:

NA = 6.022 140 76(12) × 1023 mol−1

with a relative uncertainty of 2.0 × 10⁻⁸

The last two digits of NA, in parentheses, are an expression of absolute uncertainty in NA and can be read as:  plus or minus 0.000 000 12 × 1023 mol-1.

We’ll have to wait until 2018 to find out how the General Conference on Weights and Measures decides to redefine the kilogram.

There’s Increased Worldwide Interest in Asteroid and Moon Mining Missions

Peter Lobner

In my 31 December 2015 post, “Legal Basis Established for U.S. Commercial Space Launch Industry Self-regulation and Commercial Asteroid Mining,” I commented on the likely impact of the “U.S. Commercial Space Launch Competitiveness Act,” (2015 Space Act) which was signed into law on 25 November 2016. A lot has happened since then.

Planetary Resources building technology base for commercial asteroid prospecting

The firm Planetary Resources (Redmond, Washington) has a roadmap for developing a working space-based prospecting system built on the following technologies:

  • Space-based observation systems: miniaturization of hyperspectral sensors and mid-wavelength infrared sensors.
  • Low-cost avionics software: tiered and modular spacecraft avionics with a distributed set of commercially-available, low-level hardened elements each handling local control of a specific spacecraft function.
  • Attitude determination and control systems: distributed system, as above
  • Space communications: laser communications
  • High delta V small satellite propulsion systems: “Oberth maneuver” (powered flyby) provides most efficient use of fuel to escape Earth’s gravity well

Check out their short video, “Why Asteroids Fuel Human Expansion,” at the following link:

http://www.planetaryresources.com/asteroids/#asteroids-intro

 Planetary Resources videoSource: Planetary Resources

For more information, visit the Planetary Resources home page at the following link:

http://www.planetaryresources.com/#home-intro

Luxembourg SpaceResources.lu Initiative and collaboration with Planetary Resources

On 3 November 2016, Planetary Resources announced funding and a target date for their first asteroid mining mission:

“Planetary Resources, Inc. …. announced today that it has finalized a 25 million euro agreement that includes direct capital investment of 12 million euros and grants of 13 million euros from the Government of the Grand Duchy of Luxembourg and the banking institution Société Nationale de Crédit et d’Investissement (SNCI). The funding will accelerate the company’s technical advancements with the aim of launching the first commercial asteroid prospecting mission by 2020. This milestone fulfilled the intent of the Memorandum of Understanding with the Grand Duchy and its SpaceResources.lu initiative that was agreed upon this past June.”

The homepage for Luxembourg’s SpaceResources.lu Initiative is at the following link:

http://www.spaceresources.public.lu/en/index.html

Here the Grand-Duchy announced its intent to position Luxembourg as a European hub in the exploration and use of space resources.

“Luxembourg is the first European country to set out a formal legal framework which ensures that private operators working in space can be confident about their rights to the resources they extract, i.e. valuable resources from asteroids. Such a legal framework will be worked out in full consideration of international law. The Grand-Duchy aims to participate with other nations in all relevant fora in order to agree on a mutually beneficial international framework.”

Remember the book, “The Mouse that Roared?” Well, here’s Luxembourg leading the European Union (EU) into the business of asteroid mining.

European Space Agency (ESA) cancels Asteroid Impact Mission (AIM)

ESA’s Asteroid Impact Mission (AIM) was planning to send a small spacecraft to a pair of co-orbital asteroids, Didymoon and Didymos, in 2022. Among other goals, this ESA mission was intended to observe the NASA’s Double Asteroid Redirection Test when it impacts Didymoon at high speed. ESA mission profile for AIM is described at the following link:

http://www.esa.int/Our_Activities/Space_Engineering_Technology/Asteroid_Impact_Mission/Mission_profile

On 2 Dec 2016, ESA announced that AIM did not win enough support from member governments and will be cancelled. Perhaps the plans for an earlier commercial asteroid mission marginalized the value of the ESA investment in AIM.

Japanese Aerospace Exploration Agency (JAXA) announces collaboration for lunar resource prospecting, production and delivery

On 16 December 2016, JAXA announced that it will collaborate with the private lunar exploration firm, ispace, Inc. to prospect for lunar resources and then eventually build production and resource delivery facilities on the Moon.

ispace is a member of Japan’s Team Hakuto, which is competing for the Google Lunar XPrize. Team Hakuto describes their mission as follows:

“In addition to the Grand Prize, Hakuto will be attempting to win the Range Bonus. Furthermore, Hakuto’s ultimate target is to explore holes that are thought to be caves or “skylights” into underlying lava tubes, for the first time in human history.  These lava tubes could prove to be very important scientifically, as they could help explain the moon’s volcanic past. They could also become candidate sites for long-term habitats, able to shield humans from the moon’s hostile environment.”

Hakuto is facing the challenges of the Google Lunar XPRIZE and skylight exploration with its unique ‘Dual Rover’ system, consisting of two-wheeled ‘Tetris’ and four-wheeled ‘Moonraker.’ The two rovers are linked by a tether, so that Tetris can be lowered into a suspected skylight.”

Hakuto rover-with-tail

Team Hakuto dual rover. Source: ispace, Inc.

So far, the team has won one Milestone Prize worth $500,000 and must complete its lunar mission by the end of 2017 in order to be eligible for the final prizes. You can read more about Team Hakuto and their rover on the Google Lunar XPrize website at the following link:

http://lunar.xprize.org/teams/hakuto

Building on this experience, and apparently using the XPrize rover, ispace has proposed the following roadmap to the moon (click on the graphic to enlarge).

ispace lunar roadmapSource: ispace, Inc.

This ambitious roadmap offers an initial lunar resource utilization capability by 2030. Ice will be the primary resource sought on the Moon. Ispace reports:

“According to recent studies, the Moon houses an abundance of precious minerals on its surface, and an estimated 6 billion tons of water ice at its poles. In particular, water can be broken down into oxygen and hydrogen to produce efficient rocket fuel. With a fuel station established in space, the world will witness a revolution in the space transportation system.”

The ispace website is at the following link:

http://ispace-inc.com