All posts by Drummer

Post-World War II Prefabricated Aluminum and Steel Houses and Their Relevance Today

This 3 August 2016 post was replaced on 15 June 2020 with my updated and expanded post with the same title, “Post-World War II Prefabricated Aluminum and Steel Houses and Their Relevance Today,” which is available at the following link:

https://lynceans.org/all-posts/post-world-war-ii-prefabricated-aluminum-and-steel-houses-and-their-relevance-today-2/

The updated and expanded resource document provides a brief overview of the post-WW II housing crisis in the US, UK and France, and the efforts in these nations to help resolve the housing crisis with mass-produced, prefabricated aluminum and steel houses.  It also provides links to 13 individual, downloadable articles I prepared on specific types of post-WW II prefabricated aluminum and steel houses manufactured in the US, UK and France.

I hope you’ll find the new post to be informative, useful and different from any other single source on the subject.

Best regards,

Peter Lobner

15 June 2020

DARPA Cyber Grand Challenge (CGC)

Peter Lobner

DARPA launched the Cyber Grand Challenge (CGC) in 2014. This is a competition in which each competitor team attempts to create an automatic IT network defense system that can analyze its own performance during attacks by an intelligent adversaries, identify security flaws, formulate patches, and deploy the patches in real-time on the network being protected. This DARPA competition will “give these groundbreaking prototypes a league of their own, allowing them to compete head-to-head to defend a network of bespoke software.”

The longer-term DARPA goal is to promote technology that leads to operational, automatic, scalable, adaptive, network defense systems operating at machine speed to protect IT networks against intelligent adversaries.

The CGC Challenge Competitor Portal is at the following link:

https://cgc.darpa.mil

The Master Schedule for CGC is shown in the following chart:

CGC Master ScheduleSource: DARPA

A slide presentation reporting the lessons learned from the first year of the CGC is available at the following link:

https://www.usenix.org/sites/default/files/conference/protected-files/sec15_slides_walker.pdf

This is a complex slide presentation that benefits greatly from seeing it along with a video of the actual presentation made by Mike Walker at the 12 – 14 August 2015 24th USENIX Security Symposium. You will find this rather long (1 hour 17 min) video at the following link:

https://www.usenix.org/node/190798

In the 2015 Challenge Qualification Event, seven finalists were qualified. The finals will be held from 54 August 2016 at the Paris Hotel & Convention Center in Las Vegas, Nevada. The Award Ceremony will be held at the beginning of DEF CON 24 on Friday, 5 August 2016.

CGCEventFirstAutomatedNetDefense  Source: DARPA

This is exciting stuff! The results are certain to be very interesting.

8 August 2016 Update: Carnegie Mellon’s Mayhem computer system won DARPA’s CGC

Seven invited teams competed for $4 million in prizes at the DARPA CGC. The $2 million grand prize winner was the Mayhem computer system designed by Carnegie Mellon’s team ForAllSecure. The $1 million second place prize was awarded to the Xandra computer system designed by team TECHx of Ithaca, NY, and Charlottesville, VV. Third place and a $750K prize was awarded to the Mechanical Phish computer system developed by the Shellphish team of Santa Barbara, CA.

You can read details on the DARPA website at the following link:

http://www.darpa.mil/news-events/2016-08-05a

Also see the following article on the TechCrunch website for more details on the CGC Finals competition.

https://techcrunch.com/2016/08/05/carnegie-mellons-mayhem-ai-takes-home-2-million-from-darpas-cyber-grand-challenge/

Where Earth-orbiting Satellites go to Die

Updated 30 April 2020

Peter Lobner

For satellites large enough to generate reentry debris that can reach the surface of the Earth, there are four choices: Manitowoc, WI, the Spacecraft Cemetery, a Graveyard Orbit, or the Space Garbage Truck. Let’s look at these alternatives.

Korabi-Sputnik 1 (aka Sputnik 4) was launched by the Soviet Union on 15 May 1960 and was reported to be a test of an orbital spacecraft with a recoverable, pressurized capsule capable of carrying a cosmonaut. At the time of its launch, Sputnik 4 was the largest satellite placed in orbit, with a weight of at least 5 tons.

Koralb_sputnikSource: pics-about-space.com

Sputnik 4 appears to have been a prototype of the Soviet Vostok spacecraft that carried the first human, Yuri Gagarin, into orbit on 12 April 1961.

Vostok_diagram Source: Space.com, graphics by Karl Tate

Due to a failure in the control or reentry system, the Sputnik 4 capsule did not return to Earth as planned, but instead, remained in orbit until 5 September 1962. On that day, Sputnik 4 reentered the Earth’s atmosphere and broke up, with fragments landing in Lake Michigan and in downtown Manitowoc, WI. The following diagram from the 3 December 1962 issue of Aviation Week magazine shows the paths for Sputnik 4 fragments that landed on the main street of Manitowoc, Wisconsin.

Sputnik 4 reentry over Manitowoc_5

On a recent trip, I visited the site in Manitowoc where a large, hot fragment landed and embedded itself into the asphalt pavement of a main street. That site is commemorated by a brass ring in the street and a granite plaque on the sidewalk.

Sputnik 4 landed hereSource: Author’s photos 

The Sputnik 4 debris was analyzed by the U.S. and then returned to the Soviet Union. The following photos from the 3 December 1962 issue of Aviation Week magazine show details of the largest fragment.

Sputnik 4 fragment photo 1

Sputnik 4 fragment photo 2

The Smithsonian Institution made two reproductions of this large fragment. Today, both reproductions normally are in Manitowoc; one at the Rahr-West Art Museum (on loan to a Green Bay museum on the day of my visit) and the other at the Manitowoc Visitor’s Center. Here’s a photo of the reproduction at the Visitor’s Center.

Sputnik 4 fragment DSC03294Source: Author’s photo

You can read more about Sputnik 4 in the article, “Sputnik Crashed Here,” at the following link:

http://www.roadsideamerica.com/story/12959

Many small satellites have reentered the Earth’s atmosphere at end-of-life and burned up completely, without debris reaching the Earth’s surface. No special end-of-life procedures are needed to manage the retirement of such small satellites.

Today, there is a systematic process for de-orbiting larger satellites in low Earth orbit that can produce reentry debris capable of reaching the Earth’s surface. NASA reports:

“There is a solution—spacecraft operators can plan for the final destination of their old satellites to make sure that any debris falls into a remote area. This place even has a nickname—the Spacecraft Cemetery! It’s in the Pacific Ocean and is pretty much the farthest place from any human civilization you can find.”

Spacecraft-cemeterySource: NASA

NASA has developed plans for de-orbiting the >500 ton International Space Station (ISS) at the end of its operational life, which is expected to last until at least 2028. There also is a plan to de-orbit the ISS if it must be evacuated in an emergency and cannot be recovered. You’ll find more information on NASA’s plans at the following link:

https://www.nasaspaceflight.com/2013/08/bringing-down-iss-plans-stations-demise-updated/

When the time comes, ISS reentry will be targeted for the Spacecraft Cemetery.

Spacecraft in higher orbits, including geosynchronous orbit, commonly are maneuvered into “graveyard orbits” where they are retired, outside the orbits of other active satellites. Here they will remain for a very long time without significant risk of interfering with active satellites or de-orbiting in an uncontrolled reentry.  

An example is the Lincoln Experimental Satellite 5 (LES-5), which was developed by the MIT Lincoln Laboratory and launched into synchronous orbit in 1967 to test satellite-based ultra-high frequency (UHF) secure communications for US military users.  The solar-powered LES-5 remained active until May 1971 after which it was decommissioned and moved to a higher graveyard orbit in 1972.  On 24 March 2020, Scott Tilley, an amateur radio operator living in British Columbia, announced that he had located a signal from the LES-5 satellite at 237 MHz, transmitting at about 100 bits/sec from its graveyard orbit.  You’ll find more details on the “re-discovery” of LES-5 here:

https://www.popularmechanics.com/space/satellites/a32293223/les-5-satellite/

A new option is under development by the European Space Agency (ESA), which launched the Clean Space Initiative in 2013 to address the great amount of debris and dead satellites in Earth orbit.  ESA reported:

“Scientists estimate the total number of space debris objects in orbit to be around 29 000 for sizes larger than 10 cm, 670 000 larger than 1 cm, and more than 170 million larger than 1 mm.

Any of these objects can cause harm to an operational satellite. For example, a collision with a 10 cm object would entail a catastrophic fragmentation of a typical satellite, a 1 cm object will most likely disable a spacecraft and penetrate the International Space Station shields, and a 1 mm object could destroy subsystems. Scientists generally agree that, for typical satellites, a collision with an energy-to-mass ratio exceeding 40 J/g would be catastrophic.”

The ESA’s warning signs posted in orbit proved to be ineffective.

No littering in orbit  Source:  How-to Geek Newsletter

Therefore, ESA is planning a more ambitious mission called e.DeOrbit for removing space debris.  For its demonstration mission, the ESA e.DeOrbit spacecraft is being designed to capture debris in polar orbit between 800 – 1,000 km (497 – 621 miles) altitude. Various concepts are being considered to capture the intended orbital target, including nets, arms, and tentacles. Once captured, the e.DeOrbit spacecraft will maneuver the combined satellite (target + e.DeOrbit) into a controlled reentry. The first launch of an e.DeOrbit garbage truck is expected to be in the 2023 time frame.

ESA eDeOrbit nete.DeOrbit capture using a net. Source: ESA

ESA eDeOrbit armse.DeOrbit capture using arms. Source: ESA

You can read more on the ESA Clean Space Initiative and the e.DeOrbit mission at the following links:

http://www.esa.int/Our_Activities/Space_Engineering_Technology/Clean_Space/How_to_catch_a_satellite

and

http://iaassconference2013.space-safety.org/wp-content/uploads/sites/28/2013/06/1200_Biesbroek_Innocenti.pdf

2015 International Technology Roadmap for Semiconductors (ITRS) and Moore’s Law

Peter Lobner

On 8 July 2016, the Semiconductor Industry Association (SIA) and its international partners announced the release of the 2015 International Technology Roadmap for Semiconductors (ITRS), which it describes as follows:

ITRS is “a collaborative report that surveys the technological challenges and opportunities for the semiconductor industry through 2030. The ITRS seeks to identify future technical obstacles and shortfalls, so the industry and research community can collaborate effectively to overcome them and build the next generation of semiconductors – the enabling technology of modern electronics.”

ITRS report coverYou can download the 2015 ITRS Executive Report and the seven technical sections at the following link:

http://www.semiconductors.org/main/2015_international_technology_roadmap_for_semiconductors_itrs/

Key points from the Executive Report are the following:

  • Economic gains from adopting manufacturing processes and packaging for smaller transistors are decreasing.
    • The magnitude of the investment needed for developing the processes and devices for manufacturing the highest performance chips has reduced the number of top-tier manufacturers (IC foundries) to just four.
  • Advanced manufacturing technologies exist for increasing transistor density, including smaller 2D features and 3D (stacked) features.
    • As features approach 10 nm (nanometers), the IC manufacturers are running out of horizontal space.
    • Flash memory is leading the way in 3D manufacturing to enable higher packing densities.
  • As packing densities continue to increase, new techniques will be needed by about 2024 to ensure adequate heat removal from the highest density chips.
    • At some point, liquid cooling may be required.
  • Companies without fabrication facilities (i.e., Apple) are producing the IC design, which is manufactured by a foundry company (i.e., Samsung manufactures the Apple A6X IC).
  • A new “ecosystem” has evolved in the past decade that is changing the semiconductor industry and blurring the way that performance scaling is measured.
    • Manufacturing advances enable further miniaturization of IC features and the integration of digital system functions (i.e., logic, memory, graphics, and other functionality) in a single die (system-on-a-chip, SOC). This is known as “More Moore” (MM).
    • System integration and packaging advances enable multiple related devices (i.e., power & power management, interfaces with the outside world) to be integrated in a single package along with the IC (system-in-package, SIP). This is known as “More-than-Moore” (MtM).
    • You can see the distinction between MM and MtM in the following diagram from the IRTS white paper, “More-then-Moore,” by Wolfgang Arden, et al., http://www.itrs2.net/uploads/4/9/7/7/49775221/irc-itrs-mtm-v2_3.pdf

More than Moore fig 1

The transition to computationally intensive cloud computing enables effective use of “big data”. In contrast, there has been a proliferation of smart, low-power, functionally diverse devices that generate or use instant data, and can be linked to the cloud as part of the Internet of Things (IoT). These different ends of the spectrum (cloud & IoT) create very different demands on the semiconductor industry. They also complicate measurement of industry performance. It’s not just Moore’s Law anymore.

Big data & instant data

The 2015 IRTS offers an expanded set of metrics to assess the combined performance of SoC and SIP in delivering higher value systems. This measurement scheme is shown conceptually below (from the same IRTS “More-then-Moore” white paper cited above).

More than Moore fig 2

For another perspective on the 2015 ITRS report, you can read a short article by Sebastian Anthony on the arsTECHNICA website at the following link:

http://arstechnica.com/gadgets/2016/07/itrs-roadmap-2021-moores-law/?mbid=synd_digg&utm_source=howtogeek&utm_medium=email&utm_campaign=newsletter

The Nuclear Renaissance is Over in the U.S.

Peter Lobner

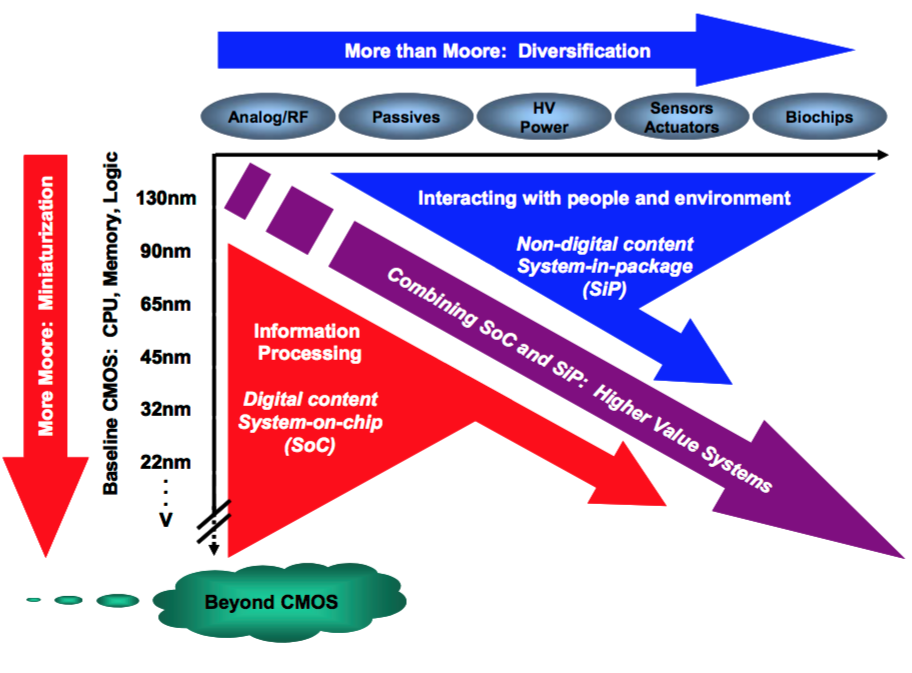
The nuclear renaissance seemed to offer a path forward to deploy new generations of safer, more efficient power reactors to replace existing fleets of large power reactors. In the U.S., that transition is captured in the following diagram.

Nuc renaissance roadmap
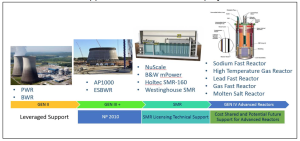
Source: Department of Energy

The current issues plaguing the U.S. nuclear power industry are largely financial, driven primarily by the low price of natural gas and the correspondingly low price of electricity generated by fossil power plants fueled by natural gas.

The recently implemented EPA Clean Power Plan (CPP) also is having an impact by failing to give appropriate credit to nuclear power plants as a means for minimizing greenhouse gas (GHG) emissions. This leaves renewable power generators (primarily hydro, wind and solar) to meet GHG emission targets in state and utility electric power portfolios.  See my 27 November 2015, 8 July 2015 and 2 July 2015 posts for more information on the CPP.

Together, these issues have derailed the U.S. nuclear renaissance, which seemed to be gaining momentum more than a decade ago. Frankly, I think the nuclear renaissance in the U.S. is over because of the following factors:

  • Successfully operating nuclear power plants are being retired early for financial reasons.
  • Fewer large, new Generation III (Gen III) advanced light water reactor plants are being built than expected.
  • The prospects for small, modular reactors (SMRs) and advanced Generation IV (Gen IV) reactors will not be realized for a long time.
  • Important infrastructure facilities in the U.S. commercial reactor fuel cycle have been cancelled.

These issues are discussed in the following text.

1.  Early retirement of successfully operating nuclear power plants for financial reasons

In a merchant energy market, nuclear power plants, even those operating at very high capacity factors, are undercut by natural gas generators, which can deliver electricity to market at lower prices. During the period from 2013 to 2015, the U.S. fleet of 99 power reactors (all considered to be “Generation II”) operated at an average net capacity factor of 90.41% (net capacity factor = actual power delivered / design electrical rating). This fleet of reactors has a combined generating capacity of about 100 GW, which represents about 20% of the total U.S. generating capacity.

Nuclear power plants do not currently receive subsidies commonly given to solar and wind power generators. For many U.S. utility executives, nuclear power plants are becoming financial liabilities in their generating portfolios. While some states are discussing ways to deliver financial relief for nuclear power plants operating within their borders, other states appear willing to let the plants close in spite of their real contributions to GHG reduction, grid stability, and the state and local economy.

Following are several examples of nuclear plant early retirements.

1.1. Exelon announced planned closure dates for Clinton and Quad Cities

The current operating license for the Clinton nuclear plant expires 29 September 2026 and the licenses for Quad Cities 1 & 2 expire on 14 December 2032. For the period 2013 – 2015, these nuclear power plants operated at very high capacity factors:

  • Quad Cities 1:     964 MWe @ 101.27%
  • Quad Cities 2:     957 MWe @ 92.68%
  • Clinton:              1,062 MWe @ 91.39%

On 2 June 2016, Exelon announced plans to retire the Clinton and Quad Cities nuclear plants on 1 June 2017 and 1 June 2018, respectively. This action was taken after the state failed to pass comprehensive energy legislation that would have offered financial relief to the utility. Also, Quad Cities was not selected in a reserve capacity auction that would have provided some needed future revenue. If the plants are closed as currently scheduled, Exelon will walk away from about 33 GW-years of carbon-free electric power generation.

You can read the Exelon press release at the following link:

http://www.exeloncorp.com/newsroom/clinton-and-quad-cities-retirement

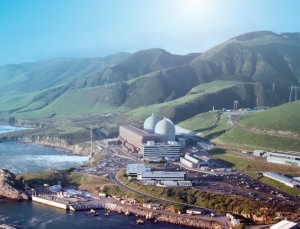
1.2. PGE announced Diablo Canyon 1 & 2 closure

The two-unit Diablo Canyon nuclear power plant is the last operating nuclear power station in California. In the three-year period from 2013 – 2015, unit performance was as follows:

  • Diablo Canyon 1:     1,138 MWe @ 90.29%
  • Diablo Canyon 2:     1,151 MWe @ 88.19%

Diablo-Canyon-aerial-c-PGESource: PGE

On 21 June 2016, PGE issued a press release announcing that they will withdraw their application to the NRC for a 20-year license extension for the Diablo Canyon 1 & 2 nuclear power plants and will close these plants by 2025 when their current operating licenses expire.  PGE will walk away from about 41 GW-years of carbon-free electric power generation.

You can read the PGE press release at the following link:

https://www.pge.com/en/about/newsroom/newsdetails/index.page?title=20160621_in_step_with_californias_evolving_energy_policy_pge_labor_and_environmental_groups_announce_proposal_to_increase_energy_efficiency_renewables_and_storage_while_phasing_out_nuclear_power_over_the_next_decade

1.3. Omaha Public Power District (OPPD) decided to close Fort Calhoun

With a net output of about 476 MWe, Fort Calhoun is the smallest power reactor operating in the U.S. In 2006, the Fort Calhoun operating license was extended to 2033. This plant operates as part of a power cooperative and is not subject to the same market forces as merchant plants. Nonetheless, the price of electricity delivered to customers is still an important factor.

On 16 June 2016, the OPPD Board announced their decision to close Fort Calhoun by the end of 2016 and stated that the closure was based simply on economic factors: it was much cheaper to buy electricity on the wholesale market than to continue operating Fort Calhoun. It cost OPPD about $71 per megawatt-hour in 2015 to generate power at Fort Calhoun. This is double the national industry average of $35.50 and much more than the open market price of about $20 per megawatt-hour.

You can read more about the Fort Calhoun closure in the OPPD press release at the following link:

http://www.oppd.com/news-resources/news-releases/2016/june/oppd-board-votes-to-decommission-fort-calhoun-station/

1.4. Entergy announced plans to close the James A. FitzPatrick nuclear power plant

The license extension process for the 838 MWe James A. FitzPatrick nuclear power plant in upstate New York was completed in 2008 and the current operating license expires in October 2032. On 2 November 2015, Entergy announced plans to close the plant in late 2016 or early 2017 for economic reasons, primarily:

  • Sustained low current and long-term wholesale energy prices, driven by record low natural gas prices due to the plant’s proximity to the Marcellus shale formation, have reduced the plant’s revenues.
  • Flawed market design fails to recognize or adequately compensate nuclear generators for their benefits (i.e., large-scale 24/7 generation, contribution to grid reliability, carbon-free generation)
  • The plant carries a high cost structure because it is a single unit.
  • The region has excess power supply and low demand.

You can read the Entergy press release at the following link:

http://www.entergynewsroom.com/latest-news/entergy-close-jamesfitzpatrick-nuclear-power-plant-central-new-york/

1.5. New Your state is considering operating subsidies for nuclear power plants

Finally, here’s some good news. In July 2016, the New York Public Services Commission (PSC) announced that it was considering subsidies for nuclear power plants operating in the state:

“The Public Service Commission is considering a proposed component of the Clean Energy Standard (CES) to encourage the preservation of the environmental values or attributes of zero-emission nuclear-powered electric generating facilities for the benefit of the electric system, its customers and the environment.”

This proposal offers to award zero-emissions credits (ZEC) in six 2-year tranches, beginning 1 April 2017. The price to be paid for ZECs would be determined by a formula that includes published estimates of the social cost of carbon (SCC). Under the PSC staff’s approach, “the zero-emission attribute payments will never exceed the calculated value they produce.”

Details of the PSC staff’s proposed methodology for determining subsidies for nuclear power plants are in a document entitled “Staff’s Responsive Proposal for Preserving Zero-Emissions Attributes,” which you can download at the following link:

https://www.google.com/?gws_rd=ssl#q=“Staff’s+Responsive+Proposal+for+Preserving+Zero-Emissions+Attributes%2C

A short article on the proposed subsidies was published on 12 July 2016 on the Power magazine website at the following link:

http://www.powermag.com/subsidies-proposed-for-new-yorks-upstate-nuclear-power-plants/

No doubt this approach to establishing zero-emissions credits for nuclear power plants will be closely watched by other states that are faced with this same issue of nuclear power plant early retirement for economic reasons. Hopefully, Entergy will reconsider its planned closure of the James A. FitzPatrick nuclear power plant.

2.  Fewer large, new Generation III advanced light water reactor plants are being built than expected

Since the start of the nuclear renaissance, 27 combined license (COL) applications were submitted to the NRC for construction and operation of new Gen III advanced light water reactor plants. You can see the current status of COLs for new reactors in the U.S. on the NRC’s website at the following link:

http://www.nrc.gov/reactors/new-reactors/col.html

A summary of the current COL status is as follows:

  • 7 withdrawn
  • 6 NRC review suspended
  • 7 under review
  • 7 issued (Fermi 3, South Texas Project 3 & 4, V. C. Summer 2 & 3, and Vogtle 3 & 4)

Recent actions are highlighted below.

2.1 Entergy withdrew its NRC license application for the River Bend unit 3 nuclear power plant

The NRC confirmed that, effective 21 June 2016, Entergy had withdrawn its application for a COL for a single unit of the General Electric Economic Simplified Boiling Water Reactor (ESBWR) at the River Bend site in Louisiana. This is the end of a series of delays initiated by Entergy. On 9 June 2009, Entergy requested that the NRC temporarily suspend the COL application review, including any supporting reviews by external agencies, until further notice.   The NRC granted this suspension. On 4 December 2015, Entergy Operations, Inc., filed to have their COL application withdrawn.

2.2 Three of the seven approved Gen III plants may never be built: Fermi-3 and STP 3 & 4.

  • Fermi 3: On 7 May 2015, NRC announced that the Fermi-3 COL had been issued. After the COL was issued, DTE Energy is reported to have said it has no immediate plans to build Fermi 3, and sought the approval as a long-term planning option. If built, Fermi 3 will be a GE-Hitachi ESBWR.
  • South Texas Project (STP) 3 & 4: In April 2015, NRG shelved plans to finance STP 3 & 4. NRG spokesman David Knox said, “The economics of new nuclear just don’t permit the construction of those units today.” Nonetheless, NRG continued the NRC review process and NRC issued the COLs for STP Units 3 and 4 on 12 February 2016. If built, STP 3 & 4 will be Toshiba Advanced Boiling Water Reactors (ABWRs).

2.3 Only four of the seven approved Gen III plants are actually under construction: V. C. Summer 2 & 3, and Vogtle 3 & 4.

So far, the net results of the nuclear renaissance in the U.S. are these four new Gen III plants, plus the resurrected Watts Bar 2 Gen II nuclear plant (construction stopped in 1980; not completed and operational until 2015).

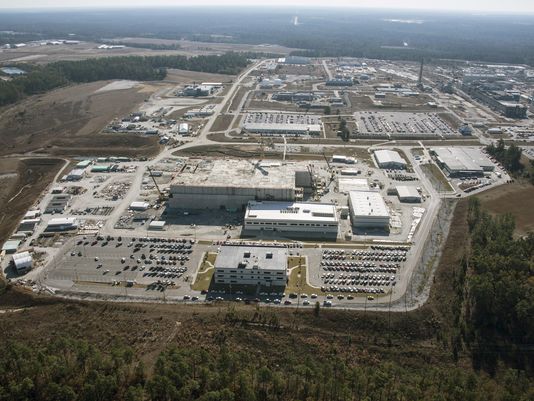
  • C. Summer 2 & 3: Both units are under construction. These are Westinghouse AP-1000 PWR plants. In February 2016, South Carolina Electric and Gas Co. (SCE&G) reported that 85% of the major equipment necessary to build Units 2 and 3 was onsite. Most of the remaining equipment has been manufactured and was awaiting transport to the site.
  • Vogtle 3 & 4: Both units are both under construction. These are Westinghouse AP-1000 PWR plants. Southern Company provides an overview of their construction status at the following link:

http://www.southerncompany.com/what-doing/energy-innovation/nuclear-energy/photos.cshtml

 Vogtle construction
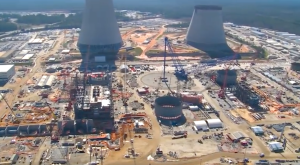
Vogtle 3 & 4 under construction. Source: Southern Company

2.4. Good news: Blue Castle Holdings is planning a 2-unit AP-1000 plant in Utah

Blue Castle Holdings conducted a project overview “webinar” on July 21, 2016 to kickoff its contractor selection process for this new plant. The preliminary schedule calls for the start of work in 2020, “as permitted by the NRC.” This will be an important project to watch, since it may become the first new nuclear power plant project since the first round of applications at the start of the nuclear renaissance. You can read more about the Blue Castle plant at the following link:

http://www.bluecastleproject.com

3.  The prospects for small, modular reactors (SMRs) and advanced Generation IV reactors will not be realized for a long time

Currently there are no SMRs or Gen IV reactors in any stage of a licensing process that could lead to a generic design certification or a combined license (COL) for a specific plant.

On 7 – 8 June 2016, the DOE and NRC co-hosted a second workshop on advanced non-light water reactors, which was a follow-on to a similar workshop held in September 2015. You can read the summary report and access all of the presentation material from the June 2016 workshop at the following link:

http://www.nrc.gov/public-involve/conference-symposia/adv-rx-non-lwr-ws/2016-06.html

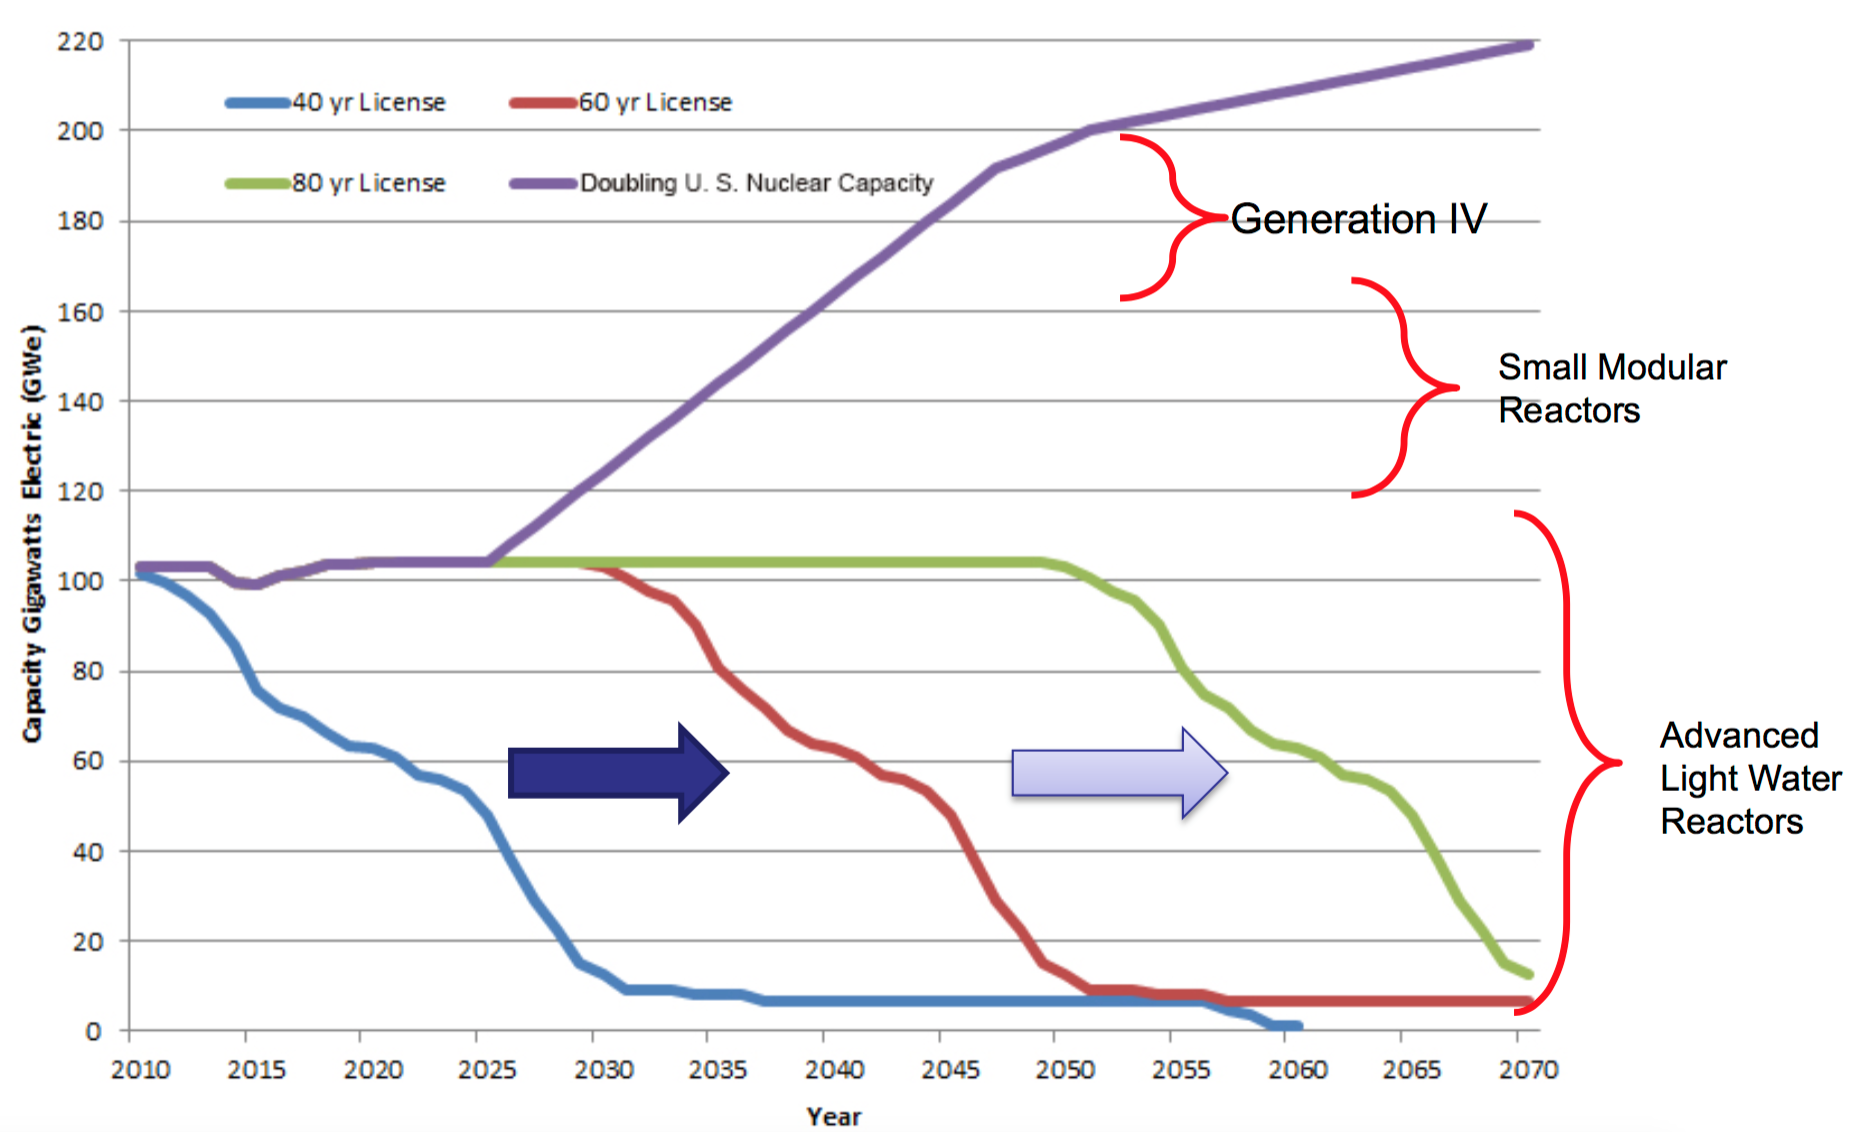
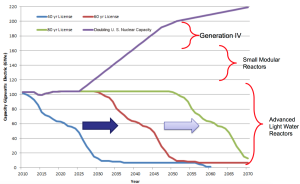
The DOE presentation by John E. Kelly entitled, “Vision and Strategy for the Development and Deployment of Advanced Reactors,” includes the following timeline that shows projected U.S. nuclear generating capacity for four scenarios.

  • The declining blue, brown and green curves show the generating capacity available from the existing fleet of power reactors depending on the length of their operating licenses (40, 60, or 80 years), and of course, assuming that there are few early plant closures for economic reasons.
  • The upper purple line represents total nuclear generating capacity needed to maintain nuclear at about 20% of the total U.S. generating capacity. Significant growth in demand is expected due to electrification of transportation and other factors, creating a demand for 200 GW of nuclear generated electricity by about 2050. This is double the current U.S. nuclear generating capacity!!

DOE addvanced reactor timelineSource: DOE

Among all the presentations in the 2016 workshop, there is no mention of where the capital comes from to build all of the new nuclear power plants needed to meet the expectation of 200 GW of nuclear generating capacity by 2050. If the expected economic advantages of SMRs and Gen IV plants fail to materialize, then construction cost per gigawatt of electrical generating capacity could be similar to current Gen III construction costs, which are on the order of $5 to 6 billion per gigawatt. This puts a price tag of $1.0 to 1.2 trillion on the deployment of 200 GW of new nuclear generating capacity. The actual amount isn’t particularly important. Just be aware that it’s a very big number. This leads me to believe that the above timeline is quite optimistic.

3.1. mPower SMR program has faltered

There was considerable optimism when the mPower program was launched more than a decade ago. This program probably is further along in its design and development processes than other U.S. SMR candidates. Unfortunately, mPower has been in decline for the past two years, during which time the mPower team head count fell from about 600 to less than 200 people. That reduction in force and slowdown in development occurred after the B&W board of directors (parent of BWXT) decided to reduce spending on mPower from about $100 million per year to a maximum of $15 million per year. The official explanation was that the company had failed in its effort to find additional major investors to participate in the project.

On 4 March 2016, there was good news to report when Bechtel and BWXT issued a press release announcing that they had reached an agreement to accelerate the development of the mPower SMR. No timeline was given for submitting an application for design certification to the NRC. You can read this press release at the following link:

http://www.prnewswire.com/news-releases/bechtel-bwxt-to-pursue-acceleration-of-small-modular-nuclear-reactor-project-300231048.html

On 13 May 2016, Tennessee Valley Authority (TVA) applied to the NRC for an early site permit for SMRs at the Clinch River site in Tennessee. In its application, TVA did not specify the reactor type, but previously had considered mPower for that site. The NRC is expected to decide in July 2016 if the application contains sufficient information to start the early site permit review process.

3.2. Other U.S. SMR candidates have not gotten beyond pre-application meetings with the NRC

The other U.S. SMR candidates are:

  • NuScale (NuScale Power, LLC)
  • SMR-160 (SMR Inventec, a Holtec International Company)
  • Integrated PWR (Westinghouse)

None have submitted an application for design certification to the NRC.

3.3. The DOE Generation IV (Gen IV) reactor program continues to slip

Gen IV reactors are intended to be the next generation of commercial power reactors, incorporating a variety of advanced technologies to deliver improved safety, reliability and economics.

The Generation IV International Forum (GIF) was created in January 2000 by 9 countries, and today has 13 members, all of which are signatories of the founding document, the GIF Charter. For basic information, you can download DOE’s Gen IV fact sheet at the following Argonne National Laboratory link:

http://www.ne.anl.gov/research/genIV/

On this fact sheet, you will find the following claim:

“Generation IV nuclear energy systems target significant advances over current-generation and evolutionary systems in the areas of sustainability, safety and reliability, and economics. These systems are to be deployable by 2030 in both industrialized and developing countries.”

You can view a more detailed 2014 presentation by the GIF at the following link:

https://www.gen-4.org/gif/upload/docs/application/pdf/2014-03/gif-tru2014.pdf

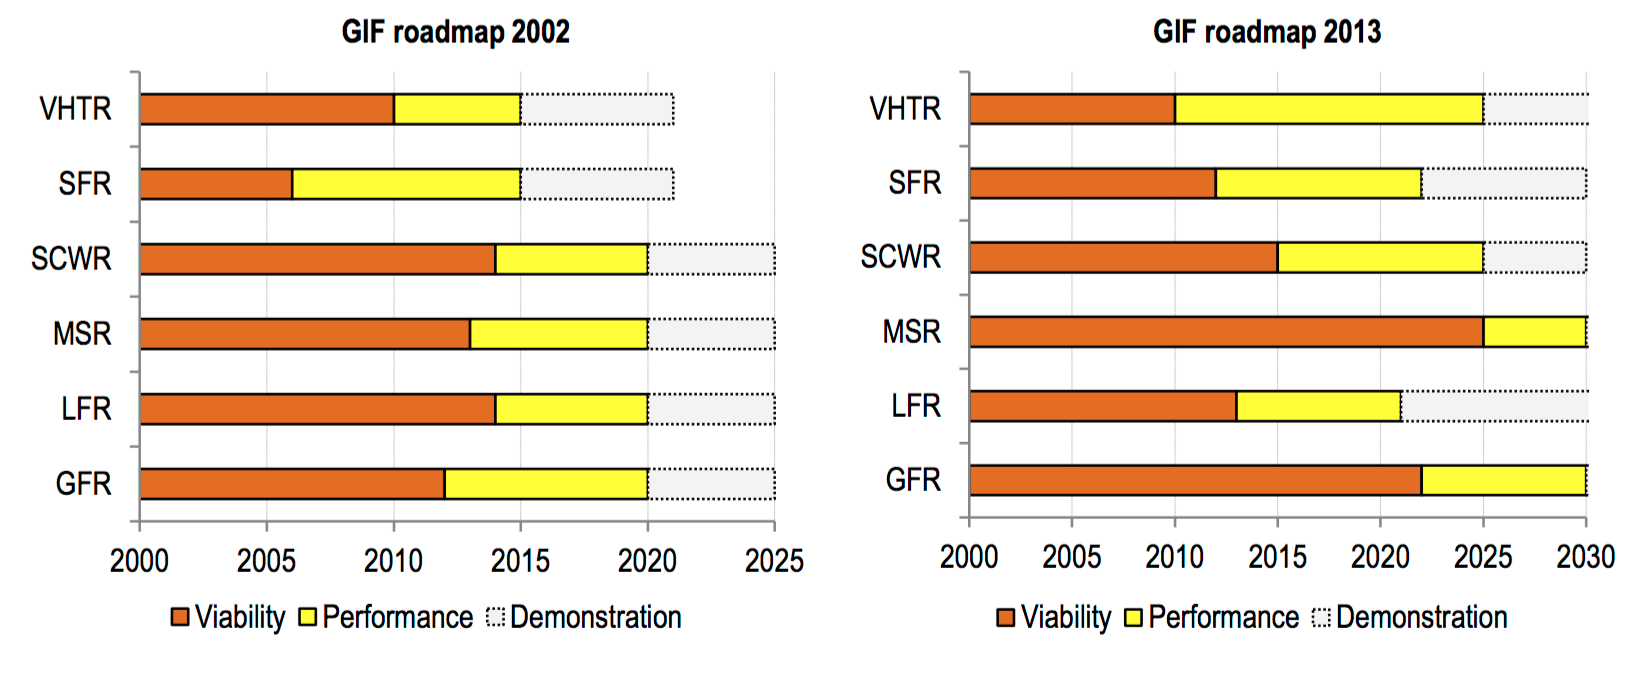
In this GIF presentation, you can see the significant schedule slip that has occurred between their 2002 and the 2013 roadmaps.

GIF Gen IV roadmap

Source: Gen IV International Forum

At the slow rate that DOE and its international GIF partners are actually making progress, I suspect that there will not even be a working Gen IV demonstration plant of any type before 2030, and certainly none in the U.S.

4. Important infrastructure facilities in the U.S. commercial reactor fuel cycle have been cancelled

Nuclear power plants are part of a fuel cycle, which for the U.S. has been a once-through (“throw-away”) fuel cycle since President Carter’s 7 April 1977 decision to discontinue work on a closed fuel cycle with nuclear fuel reprocessing. “Head-end” fuel cycle facilities include mining, milling, conversion, enrichment, and fuel manufacturing. These are the facilities that take uranium and/or plutonium from various sources and produce the desired nuclear fuel that is incorporated into the fuel elements that ultimately are installed in a reactor. “Back-end” fuel cycle facilities deal with the spent fuel elements and nuclear waste generated from reactor operation and other fuel cycle activities. In the once-through fuel cycle, the spent fuel is stored at the nuclear reactor where it was used until it can be transported to a nuclear waste repository for final disposition.

Two important nuclear fuel cycle facilities have been cancelled by the Obama administration: the Yucca Mountain Nuclear Waste Repository and the Savannah River Mixed-oxide Fuel Fabrication Facility. These cancellations have the effect of adding cost and uncertainty for the utilities operating commercial power reactors.

4.1. DOE has not developed plans for a replacement for the Yucca Mountain Nuclear Waster Repository

As is well known by now, the DOE abrogated its responsibility to develop a deep geologic site as the national commercial nuclear waste repository. Congress established this DOE role in the Nuclear Waste Policy Act of 1982. Yucca Mountain in Nevada was designated as the national repository site in the Nuclear Waste Policy Act amendments of 1987. Congress approved the Yucca Mountain project in 2002, and the project was docketed for licensing by the NRC in 2008, as Docket 63-001.

Yucca Mountain effectively was terminated in 2011 when the Obama administration removed funding for the project from the DOE budget. The NRC licensing process was suspended at the same time.

In August 2013, the U.S. Court of Appeals (Wash DC) ruled that the NRC was obligated to continue their Yucca Mountain licensing process and either “approve or reject the Energy Department’s application for [the] never-completed waste storage site at Nevada’s Yucca Mountain.” Finally, in January 2015, the NRC staff completed the Safety Evaluation Report (SER) for Yucca Mountain, which is available at the following link:

http://www.nrc.gov/reading-rm/doc-collections/nuregs/staff/sr1949/

Here are the basis conclusions presented in the SER:

  • NRC staff finds that DOE’s application meets most, but not all, of the applicable NRC regulatory requirements.
    • Requirements not met are related to certain conditions of land ownership and water rights.
  • NRC staff therefore does not recommend issuance of a construction authorization at this time.

The current status of Yucca Mountain licensing is summarized in a January 2016 NRC presentation, “NRC Review Activities for the Proposed High-level Radioactive Waste Repository at Yucca Mountain, Nevada,” which is available at the following link:

https://www.inmm.org/Content/NavigationMenu/Events/PastEvents/31stSpentFuelSeminar/W2-Rubenstone_INMM_DC_Jan2016.pdf

In this presentation, the author, James Rubenstone, identifies licensing actions still to be completed for the Yucca Mountain site and notes that, “Further progress of the review and licensing activities requires further appropriations.”   In March 2015, the NRC reported that completing its Yucca Mountain licensing process would cost an additional $330 million.

On 5 May 2016, the NRC issued the final Environmental Impact Statement (EIS) supplement for Yucca Mountain. This is not the end of the EIS process. There still remain about 300 contentions against the project that must be adjudicated. However, the adjudicatory process remains suspended.

In his January 2016 presentation, James Rubenstone also noted that, “New approaches for waste management and disposal have been proposed, but require dedicated funding and (in some cases) changes to existing law.”

So the bottom line is simply that this nation is very far, probably several decades, from having a national repository for commercial nuclear waste and spent nuclear fuel.

The burden for managing spent nuclear fuel remains with the U.S. nuclear utilities, which had been paying DOE for decades to develop the national nuclear waste repository. The current utility approach involves on-site management of spent fuel, initially in the spent fuel storage pool, and later in dry storage in canisters or casks that provide radiation shielding and protect the spent fuel from external hazards. These dry storage facilities typically are called Independent Spent Fuel Storage Installations (ISFSI). Nuclear utilities have added ISFSIs specifically to cope with the failure of DOE to complete the national nuclear waste repository as required by Nuclear Waste Policy Act of 1982.

You can find a good overview of ISFSI design and deployment at commercial power reactor sites on the NRC website at the following link:

http://www.nrc.gov/waste/spent-fuel-storage/dry-cask-storage.html

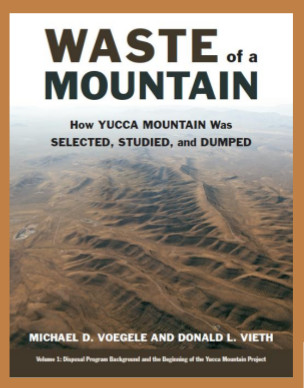
For those of you wanting more information on the Yucca Mountain project, I refer you to the recently published a two-volume, 920-page book entitled, “Waste of a Mountain,” by Michael Voegele and Donald Vieth. The book is on sale at the Pahrump Valley Museum with the proceeds going to the museum.  You’ll find the book at the following link:

http://pahrumpvalleymuseum.org/index.html

Waste of a Mountain
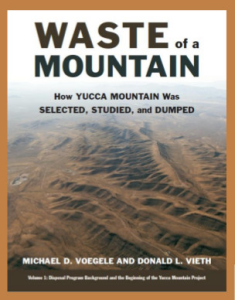
Source: Pahrump Valley Museum

4.2. DOE plans to halt construction of the Savannah River mixed-oxide (MOX) fuel fabrication facility (MFFF)
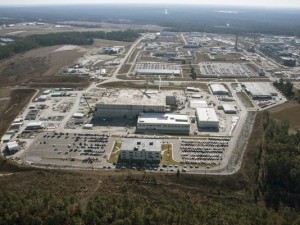
MFFFSource: DOE

The commitment to build the MOX facility is part of a 2000 agreement between the U.S. and Russia known as the amended U.S.-Russia Plutonium Management and Disposition Agreement (PMDA). The goal of PDMA is to neutralize 34 metric tons of weapons-grade plutonium by using it in MOX fuel for commercial power reactors. In its FY-2017 budget proposal, DOE makes clear that MFFF will be terminated:

“Aerospace Corporation completed two reports documenting its assessment of the April 2014 analysis. Additionally, in June 2015 the Secretary of Energy assembled a Red Team to assess options for the disposition of surplus weapon-grade plutonium. These analyses confirm that the MOX fuel approach will be significantly more expensive than anticipated and will require approximately $800 million to $1 billion annually for decades. As a result, the FY 2017 budget proposes that the MOX project be terminated.”

Final termination is scheduled to be complete in fiscal year 2019.

Instead of MFFF, DOE will develop a “dilute and dispose” (D&D) process that involves storage of diluted plutonium in metal containers placed in the Waste Isolation Pilot Plant (WIPP) in Carlsbad, NM. This process will derive no economic value from the energy content of the weapons-grade plutonium.   You will find the complete DOE budget proposal at the following link:

http://energy.gov/cfo/downloads/fy-2017-budget-justification

Senator Tim Scott (R-S.C.) said, “The reality of it is that without the MOX facility we cannot honor our agreement with the Russians.’’

4. In conclusion

The nuclear renaissance is over in the U.S. The expected long-term availability of low-price natural gas makes it difficult or impossible for nuclear power plants to generate electricity at a competitive price.

A future nuclear renaissance could be enabled if many states in this nation take the bold steps proposed by the New York Public Services Commission (PSC) to recognize the importance of nuclear power in the state’s generation portfolio and provide adequate financial incentives to nuclear utilities so they can operate profitably, extend the lives of existing nuclear plants, and build new nuclear plants.


Bio-fuel at Less Than Half the Price

Peter Lobner

1.  New process for manufacturing bio-fuel

The Joint BioEnergy Institute (JBEI) is a Department of Energy (DOE) bioenergy research center dedicated to developing advanced bio-fuels, which are liquid fuels derived from the solar energy stored in plant biomass. Such fuels currently are replacing gasoline, diesel and jet fuels in selected applications.

On 1 July 2016, a team of Lawrence Berkeley National Laboratory (LBNL) and Sandia National Laboratories (SNL) scientists working at JBEI published a paper entitled, “CO2 enabled process integration for the production of cellulosic ethanol using bionic liquids.” The new process reported in this paper greatly simplifies the industrial manufacturing of bio-fuel and significantly reduces waste stream volume and toxicity as well as manufacturing cost.

The abstract provides further information:

“There is a clear and unmet need for a robust and affordable biomass conversion technology that can process a wide range of biomass feedstocks and produce high yields of fermentable sugars and bio-fuels with minimal intervention between unit operations. The lower microbial toxicity of recently developed renewable ionic liquids (ILs), or bionic liquids (BILs), helps overcome the challenges associated with the integration of pretreatment with enzymatic saccharification and microbial fermentation. However, the most effective BILs known to date for biomass pretreatment form extremely basic pH solutions in the presence of water, and therefore require neutralization before the pH range is acceptable for the enzymes and microbes used to complete the biomass conversion process. Neutralization using acids creates unwanted secondary effects that are problematic for efficient and cost-effective biorefinery operations using either continuous or batch modes.

We demonstrate a novel approach that addresses these challenges through the use of gaseous carbon dioxide to reversibly control the pH mismatch. This approach enables the realization of an integrated biomass conversion process (i.e., “single pot”) that eliminates the need for intermediate washing and/or separation steps. A preliminary technoeconomic analysis indicates that this integrated approach could reduce production costs by 50–65% compared to previous IL biomass conversion methods studied.”

 Regarding the above abstract, here are a couple of useful definitions:

  • Ionic liquids: powerful solvents composed entirely of paired ions that can be used to dissolve cellulosic biomass into sugars for fermentation.
  • Enzymatic saccharification: breaking complex carbohydrates such as starch or cellulose into their monosaccharide (carbohydrate) components, which are the simplest carbohydrates, also known as single sugars.

The paper was published on-line in the journal, Energy and Environmental Sciences, which you can access via the following link:

http://pubs.rsc.org/en/content/articlelanding/2016/ee/c6ee00913a#!divAbstract

Let’s hope they’re right about the significant cost reduction for bio-fuel production.

2.  Operational use of bio-fuel

One factor limiting the wide-scale use of bio-fuel is its higher price relative to the conventional fossil fuels it is intended to replace. The prospect for significantly lower bio-fuel prices comes at a time when operational use of bio-fuel is expanding, particularly in commercial airlines and in the U.S. Department of Defense (DoD). These bio-fuel users want advanced bio-fuels that are “drop-in” replacements to traditional gasoline, diesel, or jet fuel. This means that the advanced bio-fuels need to be compatible with the existing fuel distribution and storage infrastructure and run satisfactorily in the intended facilities and vehicles without introducing significant operational or maintenance / repair / overhaul (MRO) constraints.

You will find a fact sheet on the DoD bio-fuel program at the following link:

http://www.americansecurityproject.org/dods-biofuels-program/

The “drop in” concept can be difficult to achieve because a bio-fuel may have different energy content and properties than the petroleum fuel it is intended to replace. You can find a Department of Energy (DOE) fuel properties comparison chart at the following link:

http://www.afdc.energy.gov/fuels/fuel_comparison_chart.pdf

Another increasingly important factor affecting the deployment of bio-fuels is that the “water footprint” involved in growing the biomass needed for bio-fuel production and then producing the bio-fuel is considerably greater than the water footprint for conventional hydrocarbon fuel extraction and production.

 A.  Commercial airline use of bio-fuel:

Commercial airlines became increasingly interested in alternative fuels after worldwide oil prices peaked near $140 in 2008 and remained high until 2014.

A 2009 Rand Corporation technical report, “Near-term Feasibility of Alternative Jet Fuels,” provides a good overview of issues and timescales associated with employment of bio-fuels in the commercial aviation industry. Important findings included:

  • Drop-in” fuels have considerable advantages over other alternatives as practical replacements for petroleum-based aviation fuel.
  • Alcohols do not offer direct benefits to aviation, primarily because high vapor pressure poses problems for high-altitude flight and safe fuel handling. In addition, the reduced energy density of alcohols relative to petroleum-based aviation fuel would substantially reduced aircraft operating capabilities and would be less energy efficient.
  • Biodiesel and biokerosene, collectively known as FAMEs, are not appropriate for use in aviation, primarily because they leave deposits at the high temperatures found in aircraft engines, freeze at higher temperatures than petroleum-based fuel, and break down during storage

You can download this Rand report at the following link

http://www.rand.org/content/dam/rand/pubs/technical_reports/2009/RAND_TR554.pdf

After almost two years of collaboration with member airlines and strategic partners, the International Air Transport Association (IATA) published the report, “IATA Guidance Material for Biojet Fuel Management,” in November 2012. A key finding in this document is the following:

“To be acceptable to Civil Aviation Authorities, aviation turbine fuel must meet strict chemical and physical criteria. There exist several specifications that authorities refer to when describing acceptable conventional jet fuel such as ASTM D1655 and Def Stan 91-91. At the time of issue, blends of up to 50% biojet fuel produced through either the Fischer-Tropsch (FT) process or the hydroprocessing of oils and fats (HEFA – hydroprocessed esters and fatty acids) are acceptable for use under these specifications, but must first be certified under ASTM D7566. Once the blend has demonstrated compliance with the relevant product specifications, it may be regarded as equivalent to conventional jet fuel in most applications.“

You can download this IATA document at the following link:

https://www.iata.org/publications/Documents/guidance-biojet-management.pdf

In 2011, KLM flew the world’s first commercial bio-fuel flight, carrying passengers from Amsterdam to Paris. Also in 2011, Aeromexico flew the world’s first bio-fuel trans-Atlantic revenue passenger flight, from Mexico City to Madrid.

In March 2015, United Airlines (UA) inaugurated use of bio-fuel on flights between Los Angeles (LAX) and San Francisco (SFO). Eventually, UA plans to expand the use of bio-fuel to all flights operating from LAX. UA is the first U.S. airline to use renewable fuel for regular commercial operation.

Many other airlines worldwide are in various stages of bio-fuel testing and operational use.

B.  U.S. Navy use of bio-fuel:

The Navy is deploying bio-fuel in shore facilities, aircraft, and surface ships. Navy Secretary Ray Mabus has established a goal to replace half of the Navy’s conventional fuel supply with renewables by 2020.

In 2012, the Navy experimented with a 50:50 blend of traditional petroleum-based fuel and biofuel made from waste cooking oil and algae oil.   This blend was used successfully on about 40 U.S. surface ships that participated in the Rim of the Pacific (RIMPAC) exercise with ships of other nations. The cost of pure bio-fuel fuel for this demonstration was about $26.00 per gallon, compared to about $3.50 per gallon for conventional fuel at that time.

In 2016, the Navy established the “Great Green Fleet” (GGF) as a year-long initiative to demonstrate the Navy’s ability to transform its energy use.

Great Green Fleet logo          Source: U.S. Navy

The Navy described this initiative as follows:

“The centerpiece of the Great Green Fleet is a Carrier Strike Group (CSG) that deploys on alternative fuels, including nuclear power for the carrier and a blend of advanced bio-fuel made from beef fat and traditional petroleum for its escort ships. These bio-fuels have been procured by DON (Department of Navy) at prices that are on par with conventional fuels, as required by law, and are certified as “drop-in” replacements that require no engine modifications or changes to operational procedures.”

Deployment of the Great Green Fleet started in January 2016 with the deployment of Strike Group 3 and its flagship, the nuclear-powered aircraft carrier USS John C. Stennis. The conventionally-powered ships in the Strike Group are using a blend of 10% bio-fuel and 90% petroleum. The Navy originally aimed for a 50:50 ratio, but the cost was too high. The Navy purchased about 78 million gallons of blended bio-fuel for the Great Green Fleet at a price of $2.05 per gallon.

C.  U.S. Air Force use of bio-fuel:

The USAF has a goal of meeting half its domestic fuel needs with alternative sources by 2016, including aviation fuel.

The Air Force has been testing different blends of jet fuel and biofuels known generically as Hydrotreated Renewable Jet (HRJ). This class of fuel uses triglycerides and free fatty acids from plant oils and animal fats as the feedstock that is processed to create a hydrocarbon aviation fuel.

To meet its energy plan, the USAF plans to use a blend that combines military-grade fuel known as JP-8 with up to 50 percent HRJ. The Air Force also has certified a 50:50 blend of Fisher-Tropsch synthetic kerosene and conventional JP-8 jet fuel across its fleet.

The Air Force Civil Engineer Support Agency (AFCESA), headquartered at Tyndall Air Force Base, Florida is responsible for certifying the USAF aviation fuel infrastructure to ensure its readiness to deploy blended JP-8/bio-fuel.

Solar Impulse 2 Completes the First Around-the-World Flight on Solar Power

Peter Lobner

Solar Impulse 2 completed its around-the-world mission when pilot Bertrand Piccard landed on 26 July 2016 at 00:05 PM UTC (Coordinated Universal Time) in Abu Dhabi, UAE after completing leg 17, which was a 48 hour 7 minute, 2694 km (1674 mile) flight from Cairo, Egypt. This historic mission began on 9 March 2015 from Abu Dhabi and covered more than 42,000 km (26,097 miles) before Solar Impulse 2 returned to its starting point.

Si2 landing at Abu Dhabi 1Source: Solar ImpulseSi2 landing at Abu Dhabi 2Source: Solar ImpulseSi2 landing at Abu Dhabi 3Source: Solar ImpulseSi2 landing at Abu Dhabi 4André Borschberg (l) and pilot Bertrand Piccard (r). Source: Solar Impulse

The Solar Impulse 2 team posted the following message on their website:

 “Taking turns at the controls of Solar Impulse 2 (Si2) – their zero-emission electric and solar airplane, capable of flying day and night without fuel – Bertrand Piccard and André Borschberg succeeded in their crazy dream of achieving the first ever Round-The-World Solar Flight. By landing back in Abu Dhabi after a total of 21 days of flight travelled in a 17-leg journey, Si2 has proven that clean technologies can achieve the impossible.”

Congratulations to pilots Bertrand Piccard and André Borschberg and the entire Solar Impulse 2 team for accomplishing this incredible milestone in aviation history.

Si2 landing at Abu Dhabi 5Source: Solar Impulse

For more information on the historic around-the world mission of Solar Impulse 2, visit the team’s website at the following link:

http://www.solarimpulse.com

Also see my following posts:

  • 23 May 2016:   Solar Impulse 2 is Making its way Across the USA
  • 27 February 2016: Solar Impulse 2 Preparing for the Next Leg of its Around-the-World Journey
  • 3 July 2015: Solar Impulse 2 Completes Record Solo, Non-Stop, Solar-Powered Flight from Nagoya, Japan to Oahu, Hawaii
  • 10 March 2015: Solar Impulse 2 Designed for Around-the-World Flight on Solar Power

ANOMALY– a Truly Impressive Augmented Reality (AR) Graphic Novel – Demonstrates how AR is Revolutionizing Printed Documents With Digital, Virtual Pop-ups

Peter Lobner

Pop-up books and cards have existed for a very long time, becoming popular in Europe in the late 1800s and in the U.S. in the early 1900s.

Old pop-up book         Source: The Harold M. Goralnick Pop-up Book Collection

You can get a good overview on the history and applications of physical pop-ups at the following Bowdoin College link:

http://www.bowdoin.edu/news/archives/1bowdoincampus/008200.shtml

At the above website, you’ll find a link to a short Vimeo video on the 2011 Bowdoin College exhibition: Pop-ups! They’re not JUST for Kids, which you also can access directly at the following link:

https://vimeo.com/19580829

At Comic-Con 2016 in San Diego, I was introduced to a remarkable digital, virtual pop-up technology in the form of the large-scale, hard cover graphic novel ANOMALY.

Anomaly-graphic-novel  Source: Anomaly Productions Inc.

The creators of ANOMALY explain:

“ANOMALY is the longest full-color original graphic novel ever created, but that’s not all. It’s also enhanced with state-of-the-art AUGMENTED REALITY technology. Simply point your smartphone or tablet at pages in the book and watch characters come to life with 3D ANIMATION and interactivity!”

A stand-alone free app is needed on your mobile device to bring the selected pages of ANOMALY to life. Hidden AR cues on the printed pages are used to activate the corresponding AR feature in the app. When first published in 2012, there were 50 AR pages in the 370 pages of ANOMALY; now there are 60 AR pages. The capability exists to add AR features via software updates after the physical book has been published.

You can get a sense for what AR brings to a printed document in the following short ANOMALY commercial trailer:

https://www.youtube.com/watch?v=jU0TzccuAGE

Below are three screenshots from that video to illustrate basic capabilities:

The virtual pop-up feature enables the reader to visualize a 3D interactive model that is animated and can include audio.

Anomaly trailer screenshot 1

Touch features on the virtual page can be used to bring up more detailed written information and animations related to the selected object. This is a drill-down capability that links to information not included on the printed page.

Anomaly trailer screenshot 2

Anomaly trailer screenshot 3

I think you’ll also enjoy the following video demonstration by the co-founder of ANOMALY, Brian Haberlin:

https://www.youtube.com/watch?v=jU0TzccuAGE

In the above video, you’ll see that this AR technology also can be implemented on small printed items like a postcard.

Below are a few screenshots I took using my copy of the book and the book app. With an iPhone, it was easy to view the complete 3-D model of the spaceship shown below, which was flying through an animated star field. The 3D model has a relatively high level of detail, so you can move in with your mobile device to see small features on the spaceship. Mirror your mobile device to a large screen TV for a really impressive view of the virtual pop-ups.

Anomaly spaceship1Anomaly spaceship2Some objects shown in less detail in the book can be viewed as much more detailed, animated 3-D virtual objects, as shown below:Anomaly example 3-D objectPeople and creatures come to life as animated 3-D models standing on the page. The creature below growled and reacted when touched, but it didn’t bite.Anomaly example 3-D animal

ANOMALY, which was published in 2012, isn’t the first application of VR technology to a printed document. However, it is the first to demonstrate this technology on such a grand scale. James Hoare, writing for the SciFiNow website, noted:

“Marvel Comics have been similarly using (AR) to great effect across their Marvel Wow! titles – a whole world of 3D animation and 2D pop-ups, background details and more open up to you – ranging from the gimmicky, to the genuinely enriching, as critters scuttle across the page, and dossiers on planets and people make themselves available.”

Now imagine the potential applications of this AR technology in science, technology, engineering and math (STEM) courses. Given the challenge of attracting young people to these disciplines, modern AR interactive texts and postcard-size flash cards should be able to deliver an engaging environment for both the teacher and the student. Mirroring the teacher’s mobile device to a large flat panel display is a simple means to engage even a large classroom full of students.

If you were teaching a STEM class, what do you think would be a good application of this AR technology for that class (Hint: The answer does not involve sitting in the back of the classroom reading ANOMALY with your own mobile device).

NASA’s Valkyrie (R5) Humanoid Robot is Being Groomed to Support Future Space Exploration Missions

Peter Lobner

The design of National Aeronautics and Space Administration’s (NASA’s) humanoid robot R5, commonly known as Valkyrie, started in October 2012 and it was unveiled in December 2013.

NASA Valkyrie robot  Source: NASA

Valkyrie was developed by a team from NASA’s Johnson Space Center (JSC) in Houston, in partnership with the University of Texas and Texas A&M and with funding from the state of Texas to compete in the Defense Advanced Projects Research Agency’s (DARPA) Robotics Challenge (DRC).  You’ll find a technical description of Valkyrie on the IEEE Spectrum website at the following link:

http://spectrum.ieee.org/automaton/robotics/military-robots/nasa-jsc-unveils-valkyrie-drc-robot

In the 2013 DRC Trials Valkyrie was a Track A entry, but it failed to score any points, largely due to unforeseen data communications problems.  An assessment of the developmental and operational problems encountered during the 2013 DRC Trials and another assessment of Valkyrie by the Florida Institute for Human & Machine Cognition (IHMC) is reported on the IEEE Spectrum website at the following link:

http://spectrum.ieee.org/automaton/robotics/humanoids/update-nasa-valkyrie-robot

Valkyrie did not compete in the 5 – 6 June 2015 DRC Finals. Instead, NASA brought two Valkyrie robots to the DRC Finals for display and demonstration and to help promote NASA’s Space Robotics Challenge (SRC), which was announced in March 2015.

NASA describes the SRC as follows:

“The Space Robotics Challenge is currently contemplated as a dual level, two-track challenge. The Level I challenge would involve a virtual challenge competition in software simulation and the Level II demonstration challenge would involve use of software to control a robot to perform sequences of tasks. Both Levels of the challenge would have a Track A and Track B option. A competitor would pick only one track in which to compete. Track A would utilize the Robonaut 2 platform and focus on simulated in-space tasks such as spacecraft maintenance and operations in transit to Mars, while Track B would utilize the R5 platform robot to perform simulated tasks on planetary surfaces, such as precursor habitat deployment on Mars, or disaster relief in an industrial setting on Earth.”

The highest scoring teams from the Level I (simulation) challenge will be given access to NASA-provided robots to prepare for the Level II (physical) challenge.

You can download a NASA Fact Sheet on SRC at the following link:

https://www.nasa.gov/sites/default/files/atoms/files/fs_space_robotics_150908.pdf

As part of SRC, NASA awarded Valkyrie robots to two university groups that competed in the DRC Finals. The winners announced in November 2015 were:

  • A team at MIT under the leadership of Russ Tedrake. Team MIT placed 6th in the 2015 DRC Finals with an Atlas robot built by Boston Dynamics
  • A team at Northeastern University under the leadership of Taskin Padir, who formerly was Co-PI of the Worcester Polytechnic Institute (WPI) – Carnegie Mellon University (CMU) team that placed 7th in the DRC Finals with an upgraded Atlas robot known as Warner.

Each team has possession of a Valkyrie robot for two years; receives up to $250,000; and has access to onsite and virtual technical support from NASA. NASA stated that, “The robots will have walking, balancing and manipulating capabilities so that future research may focus on the development of complex behaviors that would advance autonomy for bipedal humanoid robots.” These two teams will not compete in the SRC Level I challenge, but will be eligible to compete in the Level II challenge.

An assessment of Valkyrie’s potential roles in future missions to Mars was published in 23 June 2015 on the IEEE Spectrum website. You can read this article at the following link:

http://spectrum.ieee.org/automaton/robotics/humanoids/nasa-wants-help-training-valkyrie-robot-to-go-to-mars

The types of activities a humanoid robot might perform on a Mars mission are expected to become tasks to be demonstrated by each team choosing Track B in the SRC.

In the time between the DRC Finals and the SRC Level II competitions, I’m sure we’ll see substantial improvements in humanoid robot performance.

A Newcomer at the Top of the June 2016 TOP500 Ranking of the World’s Supercomputers

Peter Lobner

The latest TOP500 ranking of the world’s 500 most powerful supercomputers was released on 20 June 2016. Since June 2013, China’s Tianhe-2 supercomputer topped this ranking at 33 petaflops [PFLOPS; 1015  floating-point operations per second (FLOPS)]. Now there is a new leader, and once again it is a Chinese supercomputer the Sunway TaihuLight.

sunway-taihulightSource: Jack Dongarra, Report on the Sunway TaihuLight System, June 2016

Details are available at the TOP500 website:

https://www.top500.org

On this website, Michael Feldman commented on the new leader in the TOP500 ranking:

“A new Chinese supercomputer, the Sunway TaihuLight, captured the number one spot on the latest TOP500 list of supercomputers released on Monday morning at the ISC High Performance conference (ISC) being held in Frankfurt, Germany.  With a Linpack mark of 93 petaflops, the system outperforms the former TOP500 champ, Tianhe-2, by a factor of three. The machine is powered by a new ShenWei processor and custom interconnect, both of which were developed locally, ending any remaining speculation that China would have to rely on Western technology to compete effectively in the upper echelons of supercomputing.”

Remarkably, the Sunway TaihuLight’s significant performance increase is delivered with lower power consumption than Tihane-2: 15,371 kW for TihauLight vs. 17,808 kW for Tihane-2.

You can read Michael Feldman’s complete article at the following link:

https://www.top500.org/news/china-tops-supercomputer-rankings-with-new-93-petaflop-machine/

You also can read the press release for the new TOP500 listing at the following link:

https://www.top500.org/news/new-chinese-supercomputer-named-worlds-fastest-system-on-latest-top500-list/

You’ll find the list of the top 10 supercomputers at the following link:

https://www.top500.org/lists/2016/06/

From here, you can navigate to the complete listing of all 500 supercomputers by going to the grey box titled RELEASE and selecting The List.

U.S supercomputers Titan and Sequoia are ranked 3rd and 4th, respectively, each with about 17% of the RMAX rating of the Sunway TaihuLight and half the power consumption. In comparison, the Sunway TaihuLight is significantly more power efficient than Titan and Sequoia.

15 July 2016 Update: National Science Foundation (NSF) examines the future directions for NSF advanced computing infrastructure

The NSF recently published the new report entitled, “Future Directions for NSF Advanced Computing Infrastructure to Support U.S. Science and Engineering in 2017-2020.”

NSF adv computing infrastructure report cover   Source: NAP

As described by the authors, this report “offers recommendations aimed at achieving four broad goals: (1) position the U.S. for continued leadership in science and engineering, (2) ensure that resources meet community needs, (3) aid the scientific community in keeping up with the revolution in computing, and (4) sustain the infrastructure for advanced computing.”

The report addresses the TOP500 listing, pointing to several known limitations, and concludes that:

“Nevertheless, the list is an excellent source of historical data, and taken in the aggregate gives insights into investments in advanced computing internationally.”

The NSF report further notes the decline in U.S. ranking in the TOP500 list (see pp. 59 – 60):

“The United States continues to dominate the list, with 45 percent of the aggregate performance across all machines on the July 2015 list, but it has dropped substantially from a peak of over 65 percent in 2008. NSF has had systems either high on the list (e.g., Kraken, Stampede) or comparable to the top systems (i.e., Blue Waters), reflecting the importance of computing at this level to NSF-supported science. Although there are fluctuations across other countries, the loss in performance share across this period is mostly explained by the growth in Asia, with China’s share growing from 1 percent to nearly 14 percent today and Japan growing from 3 to 9 percent.”

The report puts TOP500 rankings in perspective as it addresses future national scale advanced computing needs and operational models for delivering advanced computing services.

If you have a MyNAP account, you can download this report for free from National Academies Press (NAP) at the following link:

http://www.nap.edu/catalog/21886/future-directions-for-nsf-advanced-computing-infrastructure-to-support-us-science-and-engineering-in-2017-2020