Peter Lobner
In this post, I will describe two large autonomous vessels that are likely to revolutionize the way the U.S. Navy operates. The first is the Sea Hunter, originally sponsored by Defense Advanced Projects Agency (DARPA), and the second is Echo Voyager developed by Boeing.
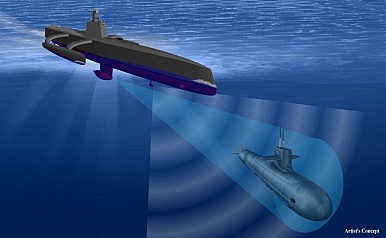
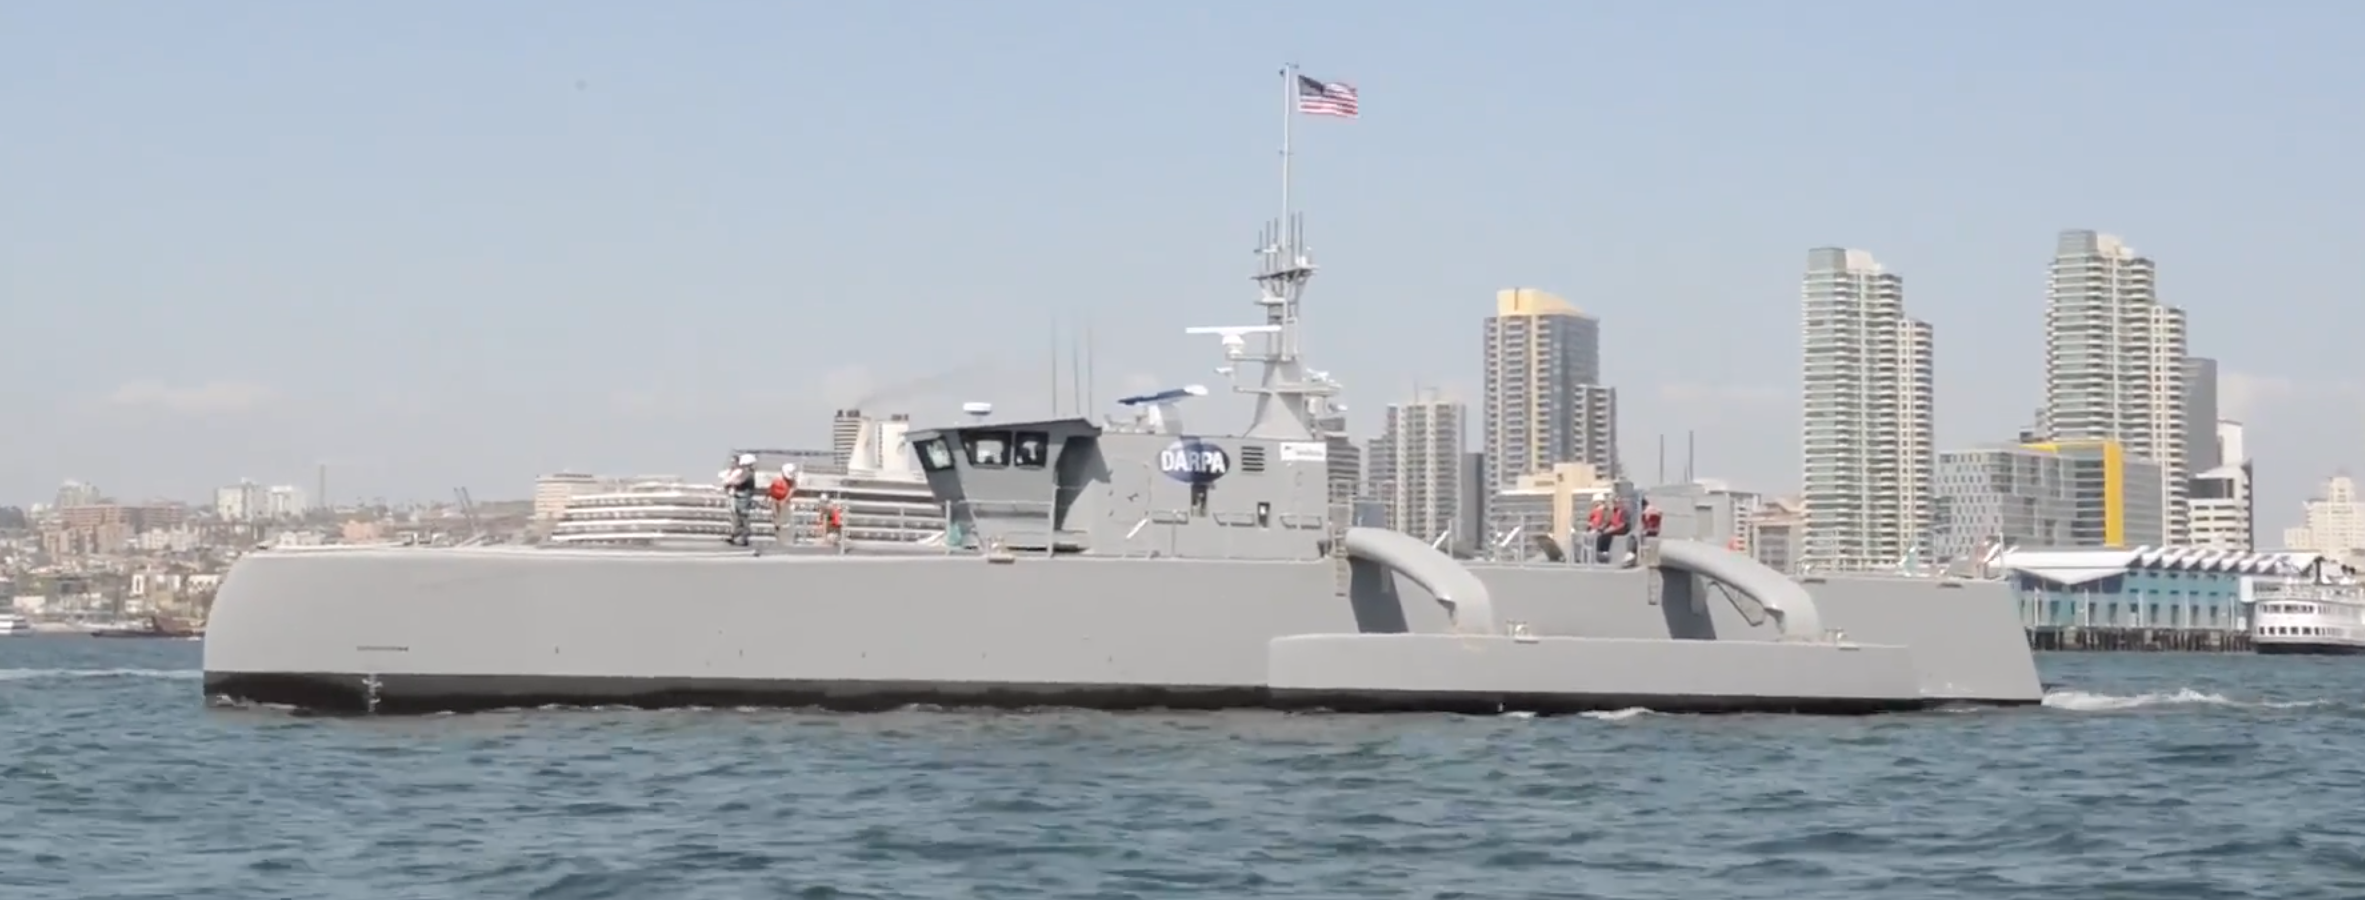
DARPA Anti-submarine warfare (ASW) Continuous Trail Unmanned Vessel (ACTUV)
 Source: DARPA
DARPA explains that the program is structured around three primary goals:
- Demonstrate the performance potential of a surface platform conceived originally as an unmanned vessel.
- This new design paradigm reduces constraints on conventional naval architecture elements such as layout, accessibility, crew support systems, and reserve buoyancy.
- The objective is to produce a vessel design that exceeds state-of-the art manned vessel performance for the specified mission at a fraction of the vessel size and cost.
- Advance the technology for unmanned maritime system autonomous operation.
- Enable independently deploying vessels to conduct missions spanning thousands of kilometers of range and months of duration under a sparse remote supervisory control model.
- This includes autonomous compliance with maritime laws and conventions for safe navigation, autonomous system management for operational reliability, and autonomous interactions with an intelligent adversary.
- Demonstrate the capability of an ACTUV vessel to use its unique sensor suite to achieve robust, continuous track of the quietest submarine targets over their entire operating envelope.
While DARPA states that ACTUV vessel is intended to detect and trail quiet diesel electric submarines, including air-independent submarines, that are rapidly proliferating among the world’s navies, that detect and track capability also should be effective against quiet nuclear submarines. The ACTUV vessel also will have capabilities to conduct counter-mine missions.
The ACTUV program is consistent with the Department of Defense (DoD) “Third Offset Strategy,” which is intended to maintain U.S. military technical supremacy over the next 20 years in the face of increasing challenges from Russia and China. An “offset strategy” identifies particular technical breakthroughs that can give the U.S. an edge over potential adversaries. In the “Third Offset Strategy”, the priority technologies include:
- Robotics and autonomous systems: capable of assessing situations and making decisions on their own, without constant human monitoring
- Miniaturization: enabled by taking the human being out of the weapons system
- Big data: data fusion, with advanced, automated filtering / processing before human involvement is required.
- Advanced manufacturing: including composite materials and additive manufacturing (3-D printing) to enable faster design / build processes and to reduce traditionally long supply chains.
You can read more about the “Third Offset Strategy” at the following link:
http://breakingdefense.com/2014/11/hagel-launches-offset-strategy-lists-key-technologies/
You also may wish to read my 19 March 2016 post on Arthur C. Clarke’s short story “Superiority.” You can decide for yourself if it relates to the “Third Offset Strategy.”
Leidos (formerly SAIC) is the prime contractor for the ACTUV technology demonstrator vessel, Sea Hunter. In August 2012, Leidos was awarded a contract valued at about $58 million to design, build, and operationally test the vessel.
In 2014, Leidos used a 32-foot (9.8 meter) surrogate vessel to demonstrate the prototype maritime autonomy system designed to control all maneuvering and mission functions of an ACTUV vessel. The first voyage of 35 nautical miles (65.8 km) was conducted in February 2014. A total of 42 days of at-sea demonstrations were conducted to validate the autonomy system.
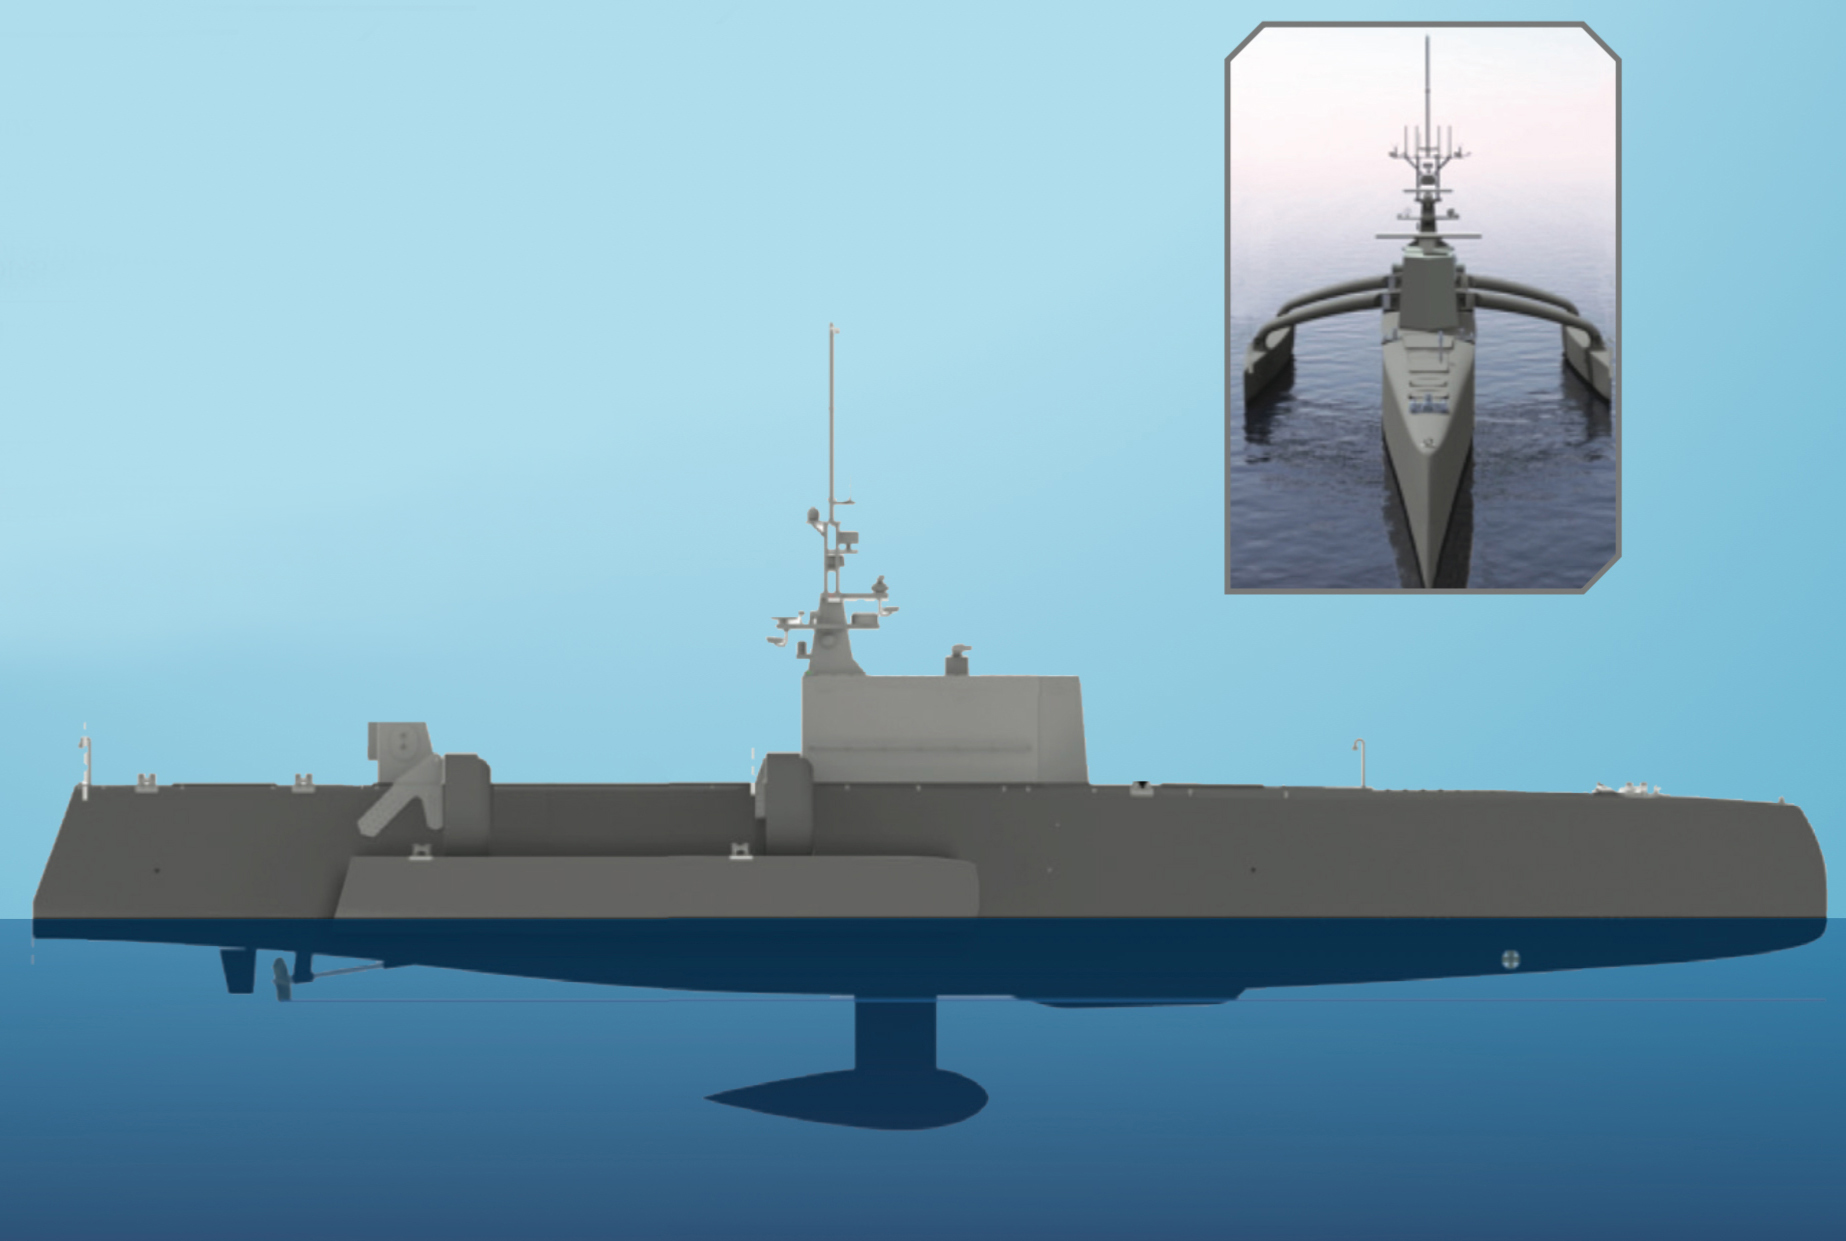
Sea Hunter is an unarmed 145-ton full load displacement, diesel-powered, twin-screw, 132 foot (40 meters) long, trimaran that is designed to a wide range of sea conditions. It is designed to be operational up to Sea State 5 [moderate waves to 6.6 feet (2 meters) height, winds 17 – 21 knots] and to be survivable in Sea State 7 [rough weather with heavy waves up to 20 feet (6 meters) height]. The vessel is expected to have a range of about 3,850 miles (6,200 km) without maintenance or refueling and be able to deploy on missions lasting 60 – 90 days.
 Source: DARPA
Raytheon’s Modular Scalable Sonar System (MS3) was selected as the primary search and detection sonar for Sea Hunter. MS3 is a medium frequency sonar that is capable of active and passive search, torpedo detection and alert, and small object avoidance. In the case of Sea Hunter, the sonar array is mounted in a bulbous housing at the end of a fin that extends from the bottom of the hull; looking a bit like a modern, high-performance sailboat’s keel.
Sea Hunter will include sensor technologies to facilitate the correct identification of surface ships and other objects on the sea surface. See my 8 March 2015 post on the use of inverse synthetic aperture radar (ISAR) in such maritime surveillance applications.
During a mission, an ACTUV vessel will not be limited by its own sensor suit. The ACTUV vessel will be linked via satellite to the Navy’s worldwide data network, enabling it to be in constant contact with other resources (i.e., other ships, aircraft, and land bases) and to share data.
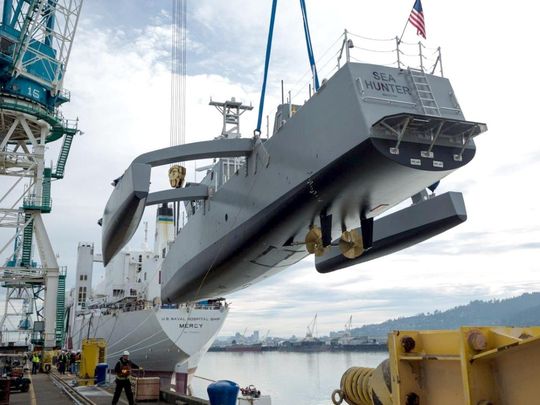
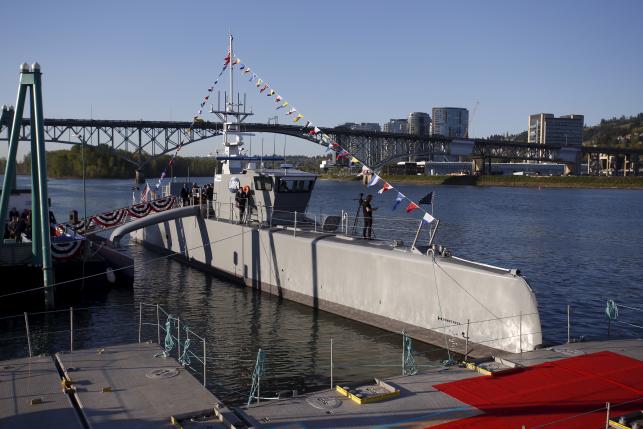
Sea Hunter was built at the Vigor Shipyard in Portland, Oregon. Construction price of the Sea Hunter is expected to be in the range from $22 to $23 million. The target price for subsequent vessels is $20 million.
You can view a DARPA time-lapse video of the construction and launch of Sea Hunter at the following link:
http://www.darpa.mil/attachments/ACTUVTimelapseandWalkthrough.mp4
 Source: DARPA
 Source: DARPA
In the above photo, you can see on the bottom of the composite hull, just forward of the propeller shafts, what appears to be a hatch. I’m just speculating, but this may be the location of a retractable sonar housing, which is shown in the first and second pictures, above.
You can get another perspective of the launch and the subsequent preliminary underway trials in the Puget Sound in the DARPA video at the following link:
http://www.darpa.mil/attachments/ACTUVTimelapseandWalkthrough.mp4
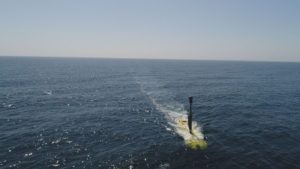
During the speed run, Sea Hunter reached a top speed of 27 knots. Following the preliminary trials, Sea Hunter was christened on 7 April 2016. Now the vessel starts an operational test phase to be conducted jointly by DARPA and the Office of Naval Research (ONR). This phase is expected to run through September 2018.
DARPA reported that it expects an ACTUV vessel to cost about $15,000 – $20,000 per day to operate. In contrast, a manned destroyer costs about $700,000 per day to operate.
 Source: DARPA
You can find more information on the ACTUV program on the DARPA website at the following link:
http://www.darpa.mil/news-events/2016-04-07
If ACTUV is successful in demonstrating the expected search and track capabilities against quiet submarines, it will become the bane of submarine commanders anywhere in the world. Imagine the frustration of a submarine commander who is unable to break the trail of an ACTUV vessel during peacetime. During a period of conflict, an ACTUV vessel may quickly become a target for the submarine being trailed. The Navy’s future conduct of operations may depend on having lots of ACTUV vessels.
28 July 2016 update: Sea Hunter ACTUV performance testing
On 1 May 2016, Sea Hunter arrived by barge in San Diego and then started initial performance trial in local waters.
 Source: U.S. Navy
You can see a video of Sea Hunter in San Diego Bay at the following link:
https://news.usni.org/2016/05/04/video-navys-unmanned-sea-hunter-arrives-in-san-diego
On 26 July 2016, Leidos reported that it had completed initial performance trials in San Diego and that the ship met or surpassed all performance objectives for speed, maneuverability, stability, seakeeping, acceleration, deceleration and fuel consumption. These tests were the first milestone in the two-year test schedule.
Leidos indicated that upcoming tests will exercise the ship’s sensors and autonomy suite with the goals of demonstrating maritime collision regulations compliance capability and proof-of-concept for different Navy missions.
4 October 2018 update: DARPA ACTUV program completed. Sea Hunter testing and development is being continued by the Office of Naval Research
Echo Voyager Unmanned Underwater Vehicle (UUV)
 Source: Boeing
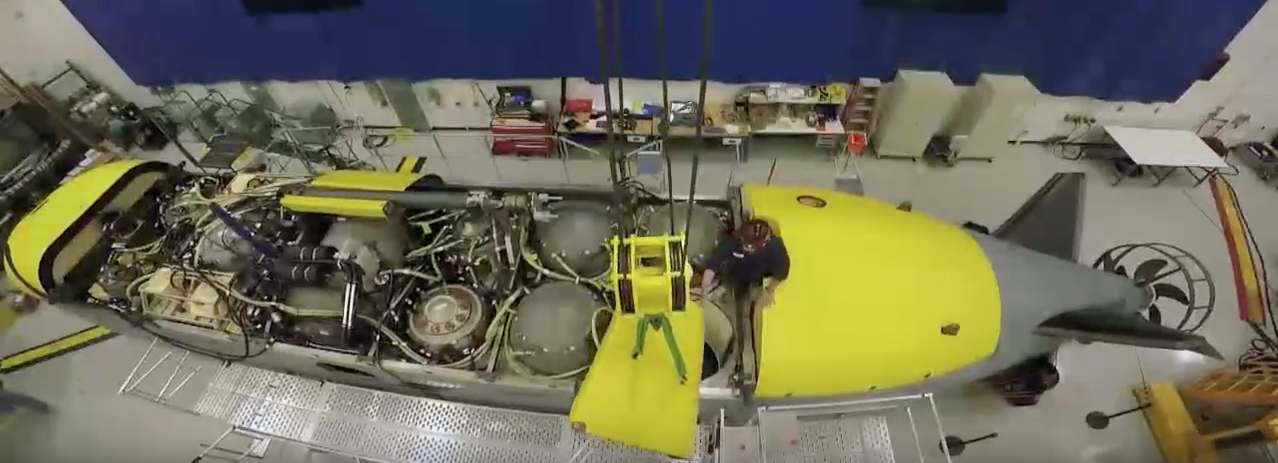 Source: Boeing
Echo Voyager is the third in a family of UUVs developed by Boeing’s Phantom Works. The first two are:
- Echo Ranger (circa 2002): 18 feet (5.5 meters) long, 5 tons displacement; maximum depth 10,000 feet; maximum mission duration about 28 hours
- Echo Seeker (circa 2015): 32 feet (9.8 meter) long; maximum depth 20,000 feet; maximum mission duration about 3 days
Both Echo Ranger and Echo Seeker are battery powered and require a supporting surface vessel for launch and recovery at sea and for recharging the batteries. They successfully have demonstrated the ability to conduct a variety of autonomous underwater operations and to navigate safely around obstacles.
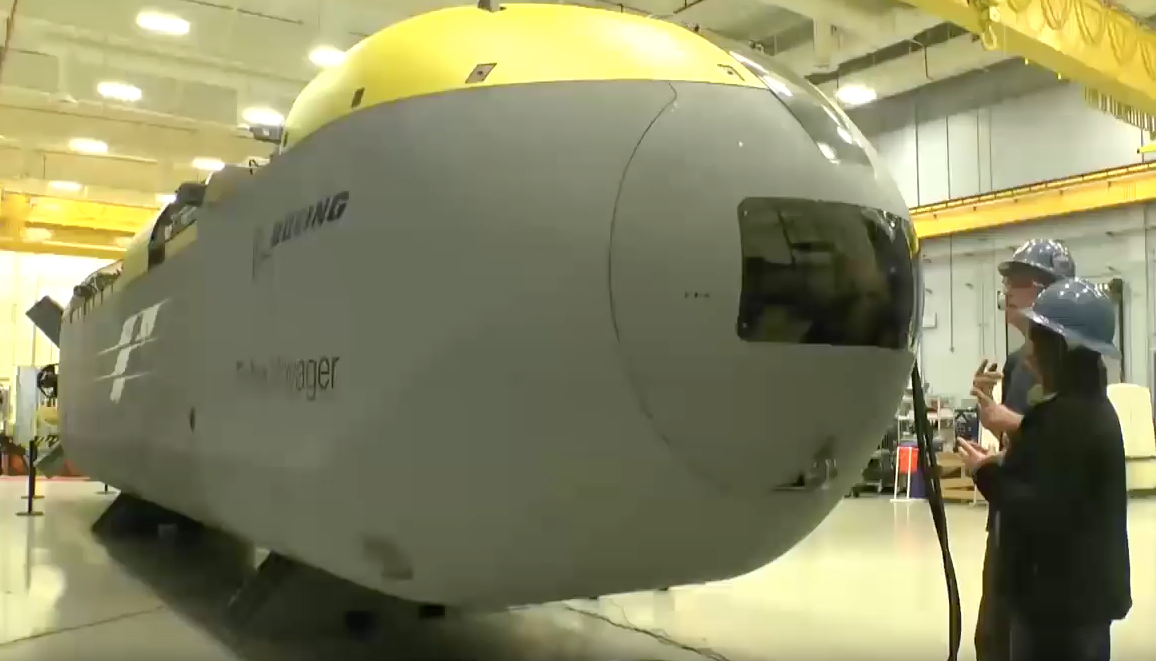
Echo Voyager, unveiled by Boeing in Huntington Beach, CA on 10 March 2016, is a much different UUV. It is designed to deploy from a pier, autonomously conduct long-duration, long-distance missions and return by itself to its departure point or some other designated destination. Development of Echo Voyager was self-funded by Boeing.
Echo Voyager is a 50-ton displacement, 51 foot (15.5 meters) long UUV that is capable of diving to a depth of 11,000 feet (3,352 meters). It has a range of about 6,500 nautical miles (12,038 km), and is expected to be capable of autonomous operations for three months or more. The vessel is designed to accommodate various “payload sections” that can extend the length of the vessel up to a maximum of 81 feet (24.7 meters).
You can view a Boeing video on the Echo Voyager at the following link:
https://www.youtube.com/watch?v=L9vPxC-qucw
The propulsion system is a hybrid diesel-electric rechargeable system. Batteries power the main electric motor, enabling a maximum speed is about 8 knots. Electrically powered auxiliary thrusters can be used to precisely position the vessel at slow speed. When the batteries require recharging,
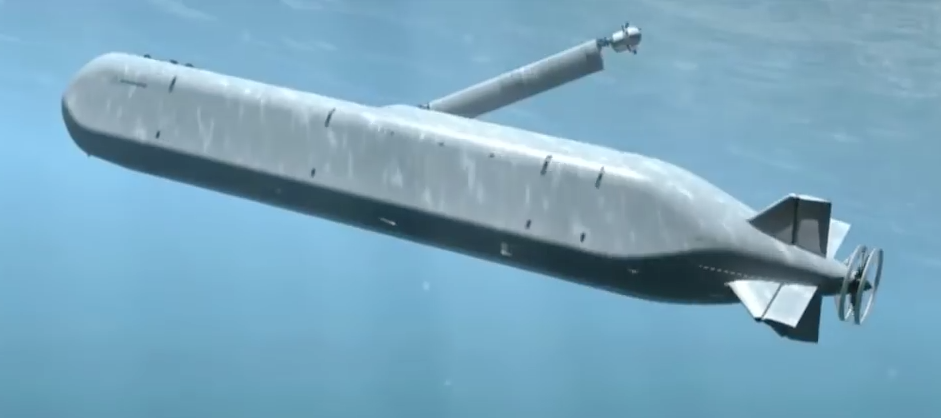
The propulsion system is a hybrid diesel-electric rechargeable system. Batteries power the main electric motor, enabling a maximum speed is about 8 knots. Electrically powered auxiliary thrusters can be used to precisely position the vessel at slow speed. When the batteries require recharging, Echo Voyager will rise toward the surface, extend a folding mast as shown in the following pictures, and operate the diesel engine with the mast serving as a snorkel. The mast also contains sensors and antennae for communications and satellite navigation.
 Source: screenshot from Boeing video at link above
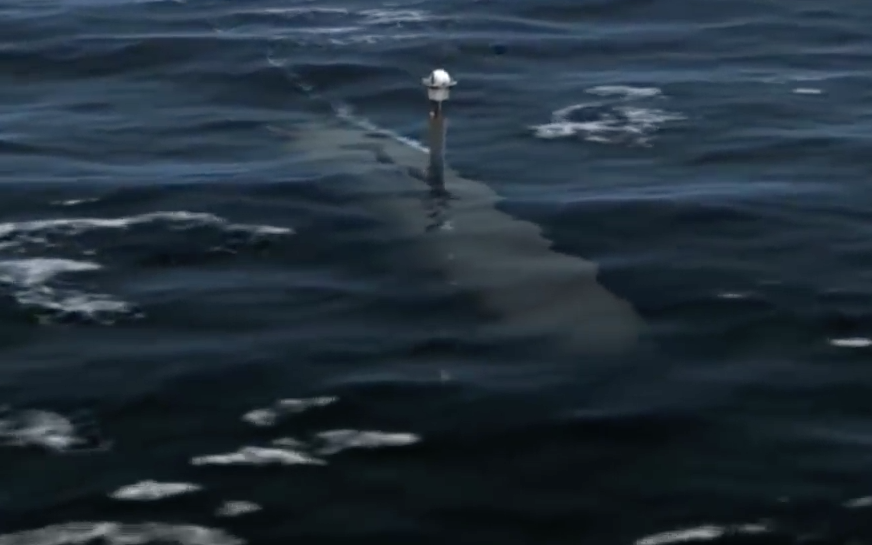 Source: screenshot from Boeing video at link above
The following image, also from the Boeing video, shows deployment of a payload onto the seabed.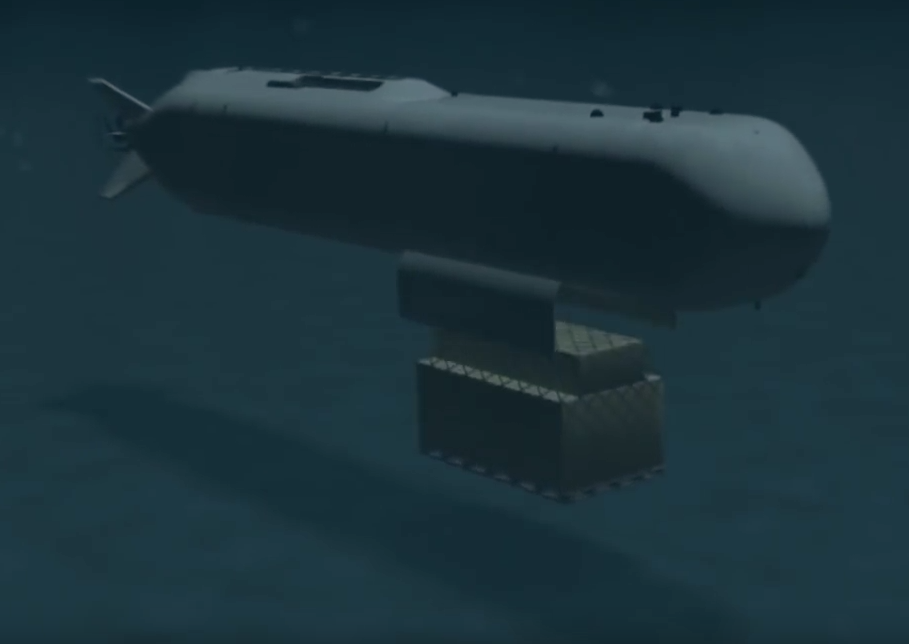 Source: screenshot from Boeing video at link above
Initial sea trials off the California coast were conducted in mid-2016.
Boeing currently does not have a military customer for Echo Voyager, but foresees the following missions as being well-suited for this type of UUV:
- Surface and subsurface intelligence, surveillance, and reconnaissance (ISR)
- ASW search and barrier patrol
- Submarine decoy
- Critical infrastructure protection
- Mine countermeasures
- Weapons platform
Boeing also expects civilian applications for Echo Voyager in offshore oil and gas, marine engineering, hydrography and other scientific research.
4 October 2018 update: Progress in Echo Voyager development
Echo Voyager is based at a Boeing facility in Huntington Beach, CA. In June 2018, Boeing reported that Echo Voyager had returned to sea for a second round of testing. You can read more on Echo Voyager current status and the Navy’s plans for future large UUVs here:
http://www.latimes.com/business/la-fi-boeing-echo-voyager-20180623-story.html
 Echo Voyager operating near the surface with mast extended. Source. Boeing


