Peter Lobner
On 1 Sep 2015, while visiting Alaska, President Obama announced that he would speed up the acquisition of icebreakers to help the U.S. Coast Guard (USCG) operate in the Arctic. A Congressional Research Service report entitled, Coast Guard Polar Icebreaker Modernization: Background and Issues for Congress, was issued on 2 Sep 2015. You can download this report at the following link:
https://www.fas.org/sgp/crs/weapons/RL34391.pdf
This report asserts that a new heavy polar icebreaker will cost in the range from $900 million to $1.1 billion. The report also provides an interesting history of prior USCG assessments of their icebreaker needs and budget actions taken over the past few years that significantly reduced the budget available to pursue new icebreaker acquisition.
Role of the National Science Foundation
In 2006, the G.W. Bush administration moved budget and management authority for the U.S. polar icebreaker fleet from the USCG to the National Science Foundation (NSF). The USCG retained custody of the polar icebreakers, which continue to be operated by USCG crews. This arrangement is recorded in the following 2006 document: Memorandum of Agreement Between United States Coast Guard and National Science Foundation Regarding Polar Icebreaking Support and Reimbursement. You can read the details of this convoluted agreement at the following link:
https://www.nsf.gov/geo/plr/opp_advisory/briefings/oct2005/2005_uscgnsf_moa.pdf
The current U.S. polar icebreaker fleet
Currently the entire U.S. national capability for Arctic and Antarctic icebreaking operations is found in a very small icebreaking fleet consisting of:
- One heavy polar icebreaker, Coast Guard Cutter Polar Star
- Commissioned in 1976
- Displacement: 13,194 tons
- Horsepower: 75,000 hp (gas turbines) + 18,000 hp (diesels)
- One medium polar icebreaker, Coast Guard Cutter Healy
- Commissioned in 1999
- Displacement: 16,000 tons
- Horsepower: 30,000 (diesels)
- Some ice-capable tugs and tenders
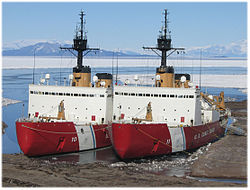
In addition to this active “fleet”, the U.S. also has an inactive heavy polar icebreaker; the Polar Sea (sister ship of Polar Star), which was commissioned in 1978 and placed in inactive commission in Seattle, WA in 2010 after a major propulsion plant equipment casualty. A 2013 USCG analysis, required by Congress to forestall the planned scrapping of the Polar Sea, showed that Polar Sea could be rehabilitated and reactivated for a fraction of the cost of building a new icebreaker. Polar Sea remains in inactive commission.
 Source: Wikipedia
Polar Star & Polar Sea together in happier days.
In 2006, NSF put Polar Star in caretaker status due to equipment aging / wear-out issues. The ship originally was designed for a 30 year operating life. After a modest refurbishment, the ship returned to Antarctic service in late 2013. Polar Star is expected to continue operating until about 2020.
After Polar Sea suffered its major propulsion system casualty in 2010, and until the Polar Star returned to service in late 2013, the medium icebreaker Healy was the only active U.S. polar icebreaker.
In February 2015, the USCG reported that it needed three heavy and three medium icebreakers to cover the U.S. “anticipated needs” in the Arctic and Antarctic. Six different U.S. agencies have missions in Polar regions.
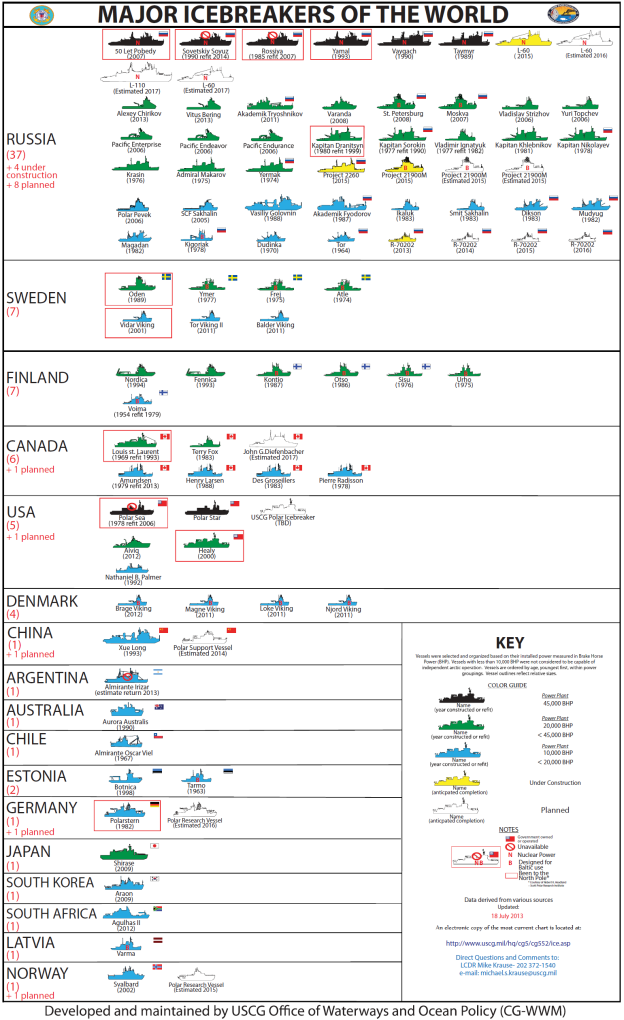
U.S. Coast Guard’s 2013 Review of Major Icebreakers of the World is a chart that provides a good visual representation of the world’s icebreaker fleets. This chart is reproduced below, but you may need to go to the following link to see a more readable and downloadable pdf version of this chart:
https://www.uscg.mil/hq/cg5/cg552/docs/20130718%20Major%20Icebreaker%20Chart.pdf
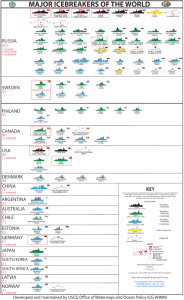
The icons in this chart for the U.S. icebreaker fleet include the Polar Star, Polar Sea (inactive) and Healy, as expected. The other two vessels are:
- Nathaniel B. Palmer, a privately owned, ice capable research ship leased by NSF to support Antarctic science missions.
- Aiviq, a privately owned icebreaking, anchor-handling tug supply vessel chartered by Royal Dutch Shell to support their oil exploration activities in the Chukchi Sea off Alaska.
So, really, the U.S. currently only has two polar icebreakers. One typically serves the Antarctic and one serves the Arctic. In 2013, the USCG got approval too explore developing a new heavy-duty icebreaker. In mid-2015, the USCG website reports:
“The Coast Guard is in the preliminary phase of a new, heavy polar icebreaker acquisition program. This stage in the process includes developing a formal mission need statement, a concept of operations, and an operational requirements document – all necessary before developing and implementing a detailed acquisition plan.”
Russia’s polar icebreaker fleet
In comparison, the USCG’s 2013 chart shows that Russia fields almost 40 icebreakers with up to a dozen more planned or under construction. Russia has national plans to exploit its Arctic resources along the Northern Sea Route, which passes through the Arctic Ocean along the north coast of Russia. Nuclear-powered icebreakers play important roles in those plans.
The first of the new LK-60 nuclear-powered heavy polar icebreakers, Arktika, is under construction in St. Petersburg’s Baltic Shipyard and is expected to enter service in 2017. Its icebreaking bow was installed in August 2015.
 Source: http://bellona.org/
Contracts for two additional LK-60-class icebreakers were placed in May 2014. They are scheduled for delivery in 2019 and 2020.
U.S. Navy Arctic Roadmap 2014 – 2030
The recently published U.S. Navy Arctic Roadmap 2014 – 2030 includes the following observations:
- U.S. Navy expects the Arctic “to remain a low threat security environment where nations resolve differences peacefully.”
- It sees its role as mostly a supporter of U.S. Coast Guard (USCG) operations and responder to search-and-rescue and disaster situations.
- However, the presence of vast resource endowments and territorial disagreements “contributes to a possibility of localized episodes of friction in the Arctic Region, despite the peaceful intentions of the Arctic nations.”
- “Navy functions in the Arctic Region are not different from those in other maritime regions; however, the Arctic Region environment makes the execution of many of these functions much more challenging.”
Regarding the first and third points, above, Russian activities in the Arctic during the past year suggest that the U.S. Navy has underestimated, at least publically, the likelihood of non-peaceful actions in the Arctic and the potential need for a military response in the region. Recent Russian activities in the Arctic highlight this risk.
Given the poor state of the U.S. polar icebreaker fleet, I would say that the last point, above, is a gross understatement. The USCG and the Navy are not well-positioned for surface operations in the Arctic Ocean. Surface naval operations in ice-covered Arctic regions will be almost impossible to execute without a capable U.S. icebreaker fleet.
You can download a copy of the Navy’s Arctic Roadmap at the following link:
http://www.navy.mil/docs/USN_arctic_roadmap.pdf
Examples of worrisome recent Russian activities in the Arctic are:
- Since early 2014, Russia has been conducting bomber and fighter missions close to the airspace of its Arctic neighbors. This kind of military behavior has not been seen since the Cold War ended in the early 1990s.
- 1 December 2014: Russia’s new Arctic Joint Strategic Command became operational. This provides central management of all Russian military resources in the Arctic, and there are a lot of them. The new command, based on the Northern Fleet and headquartered at Severomorsk, will acquire military, naval surface and strategic nuclear subsurface, air force and aerospace defense units, assets, and bases transferred from other Russian Military Districts
- 15 – 20 March 2015: Russia conducted a massive, five-day military exercise in the Arctic involving about 80,000 troops, 220 aircraft, 41 ships, and 15 submarines. This exercise was conducted on the one-year anniversary of the Russian annexation of Crimea.
- 4 August 2015: Russia’s Foreign Ministry confirmed that Russia had re-submitted to the United Nations it’s Arctic extended continental shelf claim. Russia is seeking recognition for its formal economic control of 1.2 million square kilometers (463,320 square miles) of Artic sea shelf extending more than 350 nautical miles from the shore.
The new U.S. Arctic Executive Steering Committee
In contrast to Russia’s new Arctic Joint Strategic Command, President Obama issued an Executive Order in 15 January 2015 setting up the Arctic Executive Steering Committee, which will be responsible for enhancing coordination of national efforts in the Arctic. How this new Steering Committee will affect progress on revitalizing the U.S. polar icebreaker fleet remains to be seen. You can read the full text of this Executive Order at the following link:
https://www.whitehouse.gov/the-press-office/2015/01/21/executive-order-enhancing-coordination-national-efforts-arctic
The bottom line
The U.S. is well behind the power curve for conducting operations in the Arctic that require icebreaker support. Even with a well-funded new U.S. icebreaker construction program, it will take a decade before the first new ship is ready for service, and by that time, the new ship will be entering the fleet just as the Polar Star is retiring or entering a comprehensive life-extension refurbishment program.
If you find yourself icebound in the Arctic anytime in the next decade, I think your best bet is to call the Canadians or the Russians for help.
5 February 2016 update:
In mid-January 2016, former Coast Guard Commandant Adm. Bob Papp made the following points at the annual Surface Navy Association meeting near Washington D.C.:
- The U.S. will need eight icebreakers if it decides to have one patrolling in each polar region at all times. The Coast Guard has never been able to support that high an operational tempo.
- U.S. Arctic policy is a matter of national security; not just a matter of defense. The State Department’s vision focuses as well on sovereign rights and responsibilities of Arctic nations, maritime safety, energy, economic interests, environmental stewardship, scientific research and support to indigenous peoples.
- More icebreakers are essential, because the U.S. can’t support its policies without being physically able to move about in the polar regions.
Read more details at the following link:
http://www.navytimes.com/story/military/2016/01/15/coast-guard-needs-8-icebreakers-cover-polar-regions-retired-4-star/78749864/
The current Coast Guard Commandant, Adm. Paul Zukunft, has stated that the schedule for the new icebreaker procurement program calls for a contract award for one icebreaker by fall 2019, with production beginning in 2020. Initial operational capability for this first new icebreaker would not be until the mid-2020s. A Federal Business Opportunity (FBO) notice for the USCG Polar Icebreaker Replacement Program was posted online on 13 January 2016. You can read the FBO notice and download the industry data package at the following link:
https://www.fbo.gov/index?s=opportunity&mode=form&id=68bf40747603b6acecc73e5ccc2974b6&tab=core&_cview=1
Well, this is a start. When the new icebreaker enters the Coast Guard fleet and Polar Star retires after about 50 years of operation, the U.S. still will have only two polar icebreakers.
 Source: adapted from http://southafricamap.facts.co/
 Source: The Bloodhound Project
 Source: The Bloodhound Project