All posts by Drummer

New DARPA Grand Challenge: Spectrum Collaboration Challenge (SC2)

Peter Lobner

On 23 March 2016, the Defense Advanced Projects Research Agency (DARPA) announced the SC2 Grand Challenge in Las Vegas at the International Wireless Communications Expo (IWCE). DARPA described this new Grand Challenge as follows:

“The primary goal of SC2 is to imbue radios with advanced machine-learning capabilities so they can collectively develop strategies that optimize use of the wireless spectrum in ways not possible with today’s intrinsically inefficient approach of pre-allocating exclusive access to designated frequencies. The challenge is expected to both take advantage of recent significant progress in the fields of artificial intelligence and machine learning and also spur new developments in those research domains, with potential applications in other fields where collaborative decision-making is critical.”

You can read the DARPA press release on the SC2 Grand Challenge at the following link:

http://www.darpa.mil/news-events/2016-03-23

SC2 is a response to the rapid growth in demand for wireless spectrum by both U.S. military and civilian users.  A DARPA representative stated, “The current practice of assigning fixed frequencies for various uses irrespective of actual, moment-to-moment demand is simply too inefficient to keep up with actual demand and threatens to undermine wireless reliability.”  The complexity of the current radio frequency allocation in the U.S. can be seen in the following chart.

image

Chart Source: U.S. Department of Commerce, National Telecommunications and Infrastructure Administration

You can download a high-resolution PDF copy of the above U.S. frequency spectrum chart at the following link:

https://www.ntia.doc.gov/files/ntia/publications/2003-allochrt.pdf

15 July 2016 Update: FCC allocates frequency spectrum to facilitate deploying 5G wireless technologies in the U.S.

On 14 July 2016, the Federal Communications Commission (FCC) announced:

“Today, the FCC adopted rules to identify and open up the high frequency airwaves known as millimeter wave spectrum. Building on a tried-and-true approach to spectrum policy that enabled the explosion of 4G (LTE), the rules set in motion the United States’ rapid advancement to next-generation 5G networks and technologies.

The new rules open up almost 11 GHz of spectrum for flexible use wireless broadband – 3.85 GHz of licensed spectrum and 7 GHz of unlicensed spectrum. With the adoption of these rules, the U.S. is the first country in the world to open high-band spectrum for 5G networks and technologies, creating a runway for U.S. companies to launch the technologies that will harness 5G’s fiber-fast capabilities.”

You can download an FCC fact sheet on this decision at the following link:

https://www.fcc.gov/document/rules-facilitate-next-generation-wireless-technologies

These new rules change the above frequency allocation chart by introducing terrestrial 5G systems into high frequency bands that historically have been used primarily by satellite communication systems.

U.S. Global (Climate) Change Research Program Plan Update

Peter Lobner

It used to be called “global warming”, then came “global climate change.” Now it seems that the simpler, but less informative term “global change” has become the politically-correct variant. National Academies Press (NAP) has just published the final document, “Review of the U.S. Global Change Research Program’s Update to the Strategic Plan Document.”

image  Source: NAP

The NAP abstract states:

“The Update to the Strategic Plan (USP) is a supplement to the Ten-Year Strategic Plan of the U.S. Global Change Research Program (USGCRP) completed in 2012. The Strategic Plan sets out a research program guiding thirteen federal agencies in accord with the Global Change Research Act of 1990. This report reviews whether USGCRP’s efforts to achieve its goals and objectives, as documented in the USP, are adequate and responsive to the Nation’s needs, whether the priorities for continued or increased emphasis are appropriate, and if the written document communicates effectively, all within a context of the history and trajectory of the Program.”

You might find this interesting reading. If you have a MyNAP account, you can download a PDFs copy of this report for free at the following link:

http://www.nap.edu/catalog/23396/review-of-the-us-global-change-research-programs-update-to-the-strategic-plan-document

You can download the 2011 report, “Review of the U.S. Global Change Research Program’s Strategic Plan,” at the following link:

http://www.nap.edu/catalog/13330/a-review-of-the-us-global-change-research-programs-strategic-plan

Draw your own conclusions on how this updated plan implements science and politics.

Solar Impulse 2 is Making its way Across the USA

Peter Lobner

If you have been reading the Pete’s Lynx blog for a while, then you should be familiar with the remarkable team that created the Solar Impulse 2 aircraft and is attempting to make the first flight around the world on solar power.  The planned route is shown in the following map.

Solar Impulse 2 route map

Image source: Solar Impulse

I refer you to my following posts for background information:

  • 10 March 2015: Solar Impulse 2 Designed for Around-the-World Flight on Solar Power
  • 3 July 2015: Solar Impulse 2 Completes Record Solo, Non-Stop, Solar-Powered Flight from Nagoya, Japan to Oahu, Hawaii
  • 27 February 2016: Solar Impulse 2 Preparing for the Next Leg of its Around-the-World Journey

Picking off where these stories left off in Hawaii, Solar Impulse 2 has made four more flights:

  • 21 – 24 April 2016: Hawaii to Moffett Field, near San Francisco, CA; 2,539 miles (4,086 km) in 62 h 29 m
  • 2 – 3 May 2016: San Francisco to Phoenix, AZ; 692 miles (1,113 km) in 15 h 52 m
  • 12 – 13 May 2016: Phoenix to Tulsa, OK; 976 miles (1,570 km) in 18 h 10 m
  • 21 – 22 May 2016: Tulsa to Dayton, OH; 692 miles (1,113 km) in 16 h 34 m

From the above distances and flight times, the average speed of Solar Impulse 2 across the USA was a stately 43.6 mph (70.2 kph).  Except for the arrival in the Bay Area, I think the USA segments of the Solar Impulse 2 mission have been given remarkably little coverage by the mainstream media.

SI2 flying above the USAImage source: Solar Impulse

Regarding the selection of Dayton as a destination for Solar Impulse 2, the team posted the following:

“On his way to Dayton, Ohio, hometown of Wilbur and Orville Wright, André Borschberg pays tribute to pioneering spirit, 113 years after the two brothers succeeded in flying the first power-driven aircraft heavier than air.

To develop their wing warping concept, the two inventors used their intuition and observation of nature to think out of the box. They defied current knowledge at a time where all experts said it would be impossible. When in 1903, their achievement marked the beginning of modern aviation; they did not suspect that a century later, two pioneers would follow in their footsteps, rejecting all dogmas to fly an airplane around the world without a drop of fuel.

This flight reunites explorers who defied the impossible to give the world hope, audacious men who believed in their dream enough to make it a reality.”

Wright Bros and SI2 pilotsImage source: Solar Impulse.

You can see in the above route map that future destinations are not precisely defined. Flight schedules and specific routes are selected with due consideration for en-route weather.

The Solar Impulse 2 team announced that its next flight is scheduled to take off from Dayton on 24 May and make an 18-hour flight to the Lehigh Valley Airport in Pennsylvania. Following that, the next flight is expected to be to an airport near New York City.

If you haven’t been following the flight of Solar Impulse 2 across the USA, I hope you will start now. This is a remarkable aeronautical mission and it is happening right now. You can check out the Solar Impulse website at:

http://www.solarimpulse.com

If you wish, you can navigate to and sign up for e-mail updates on future flights. Here’s the direct link:

http://www.solarimpulse.com/subscribe

With these updates, you also will be able to access live video feeds during the flights. OK, the videos are mostly pretty boring, but they are remarkable nonetheless because of the mission you have an opportunity to watch, even briefly, in real time.

There’s much more slow, steady flying to come before Solar Impulse 2 completes its around-the-world journey back to Abu Dhabi. I send my best wishes for a successful mission to the brave pilots, André Borschberg and Bertrand Piccard, and to the entire Solar Impulse 2 team.

Tall and Skinny in New York City and Miami

Peter Lobner

An architectural trend in New York City (NYC) is the construction of very tall, very slender residential / multi-use towers on small building sites in the heart of the city. This trend is driven by the very high cost and limited availability of large building sites. This trend is enabled by zoning laws and the following technical factors:

  • Materials: Use of higher-strength steel, concrete and composite structures permits lighter / stronger structures than commonly found in earlier generation skyscrapers.
  • Advanced design analysis and simulation: Advances in structural modeling, computing power, and simulation permit a more detailed engineering analysis of the building’s response to static and dynamic loads and optimization of the design for the specified conditions.
  • Aerodynamic shaping: Incorporation of shapes and design details that break up the wind flow around a building help reduce wind loads that can cause swaying and vortex shedding that can shake / vibrate a building.
  • Damping devices: Devices such as mass dampers (moving weights) and slosh dampers (large tanks of water) are employed to counteract the building’s natural response to external forces. For example, mass dampers installed on an upper floor can be tuned to move out of phase with wind-induced forces and thereby reduce sway. Slosh dampers can help absorb vibrations. Both can help make the building more comfortable for its occupants, particularly on the upper floors.

New York City’s Skyscraper Museum (https://skyscraper.org) defines “slenderness” as the ratio of the width of a building’s base to its height.

  • The 1,250 ft. (381 meters) tall Empire State Building (not including antenna) occupies a full city block site measuring 424 x 187 ft. (129.2 x 57 meters), for a slenderness ratio of 1:2.95.
  • The original World Trade Center (WTC) north tower (not including antenna) was 1,368 ft. (417 meters) tall and measured 209 ft. (63.7 meters) on a side, yielding a slenderness ratio of 1:6.5.
  • New “super-slender” towers in NYC have slenderness ratios up to 1:23. At this slenderness ratio, a 12-inch ruler standing on end would be slightly more than 1/2 inch wide.

Visit the Skyscraper Museum’s website and check out their 2013 – 2014 exhibition, “SKY HIGH & the logic of luxury.”  The museum describes this exhibit as follows: “SKY HIGH exhibit examines the recent proliferation of super-slim, ultra-luxury residential towers on the rise in Manhattan. These pencil-thin buildings-all 50 to 90+ stories-constitute a new type of skyscraper in a city where tall, slender structures have a long history.” The direct link to this exhibition is here: http://www.skyscraper.org/EXHIBITIONS/TEN_TOPS/slender.php

The top three NYC “super-slenders” are discussed below. Also discussed below is a notable “super-slender” building being developed in Miami.

Rafael Vainly & SLCE Architects: Residential tower, 432 Park Avenue, New York City

This 96-floor residential tower in mid-town Manhattan was built between 2012 and 2015, and, at a height of 1,396 ft. (426 meters), is one of the tallest buildings in New York City and currently is the tallest residential tower in the Western hemisphere. The highest occupied floor is almost a quarter mile up, at 1,287 ft. (392 meters).

432 Park Ave NYCImage source: StreetEasy.com

This square building measures 93 ft. (28 meters) on a side (one foot less than the length of a basketball court), giving it a slenderness ratio of 1:15.

You can explore this skyscraper at the following website:

http://www.architecturebeast.com/432-park-avenue-skyscraper/

This site includes the following diagram, which compares (L to R) the new One WTC, the 432 Park Ave tower, one of the original WTC towers, and the Empire State Building.  Note how slender the 432 Park Ave tower is relative to the conventional skyscrapers.

Tall builsing comparisonIn case you’re interested, you can find apartment listings for sale or rent at the following website:

http://streeteasy.com/building/432-park-avenue

On the date I wrote this article, the least expensive apartment (6 rooms, 3 bedrooms, 4-1/2 baths) was selling for $17.5M on the lowly 36th floor. A penthouse on the 88th floor was under contract for $76.5M.

SHoP Architects: Residential tower, 111 West 57th Street, New York City

This building is under construction and will be an 80-floor, 1,438 ft. (438 meter) tall, residential tower when it is completed in 2018. With a slenderness ratio of 1:23, this will be the most slender skyscraper in the world. The square cross-section of the building steps back at about 2/3 height to give the top of the building a chisel-like profile.

SHoP Architects describes this project as:

“The design aims to bring back the quality, materiality and proportions of historic NYC towers, while taking advantage of the latest technology to push the limits of engineering and fabrication.”

To improve stability in high winds and seismic events, the building includes an 800-ton tuned mass damper.

You can explore this cutting-edge skyscraper at the following link:

http://111w57.com

111 W 57 St NYCImage source: SHoP Architects

Adrian Smith + Gordon Gill Architecture: Central Park Tower, 225 West 57th Street, New York City

This is a mixed-use, irregularly shaped 99-floor skyscraper that will be 1,550 ft. (472 m) tall when it is completed in 2019. The highest occupied floor will be more than a quarter mile high, at 1,450 ft. (442 meters).

The developers purchased “air rights” from a neighboring property owner to permit part of the Central Park Tower to be cantilevered over the neighboring property, as shown in the following figures.

Central Park Tower 1          Central Park Tower 2Image source: Adrian Smith + Gordon Gill Architecture

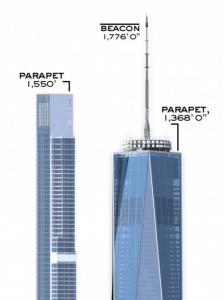
The deck at the top of the building will be 182 ft. (55.5 meters) taller than the new One World Trade Center, which is still considered to be taller because of its antenna structure on the roof. This height comparison can be seen in the following diagram, which also highlights how slender the Central Park Tower is in comparison to One WTC.

Central Park Tower 3

Image source: adapted from New York YIMBY

SHoP Architects: Miami Innovation Tower, 1031 NW First Ave, Miami

The trend toward tall, slender towers is not limited to NYC. Another stunning tall, slender mixed-use skyscraper is SHoP’s twisting 633 ft. (193 meters) Miami Innovation Tower planned for Miami’s Park West neighborhood. This skyscraper will be built as part of a four block “Miami Innovation District,” which is intended to attract high-tech businesses to the mixed-use neighborhood.

Miami Innovation Tower

Image source: SHoP Architects

The tower incorporates a fully integrated “active skin” that provides lighting and a messaging capability on the surface of the building. The Miami Herald reported:

“Unlike traditional billboard signage, the mesh-like messaging technologies are in fact integrated completely into the complex, pleated form of the tower’s exterior. The result is an ethereal, highly-transparent surface, open to the slender concrete tower core and views of the city and the sky beyond.”

You will find more information on the Miami Innovation Tower, and its integration in the Innovation District at the following link:

http://innovatemiami.com/about/tower

Other skyscrapers around the world

If you want to know more about other skyscrapers around the world, I refer you to the Council on Tall Buildings and Urban Habitat (CTBUH). Their home page is at the following link:

http://www.ctbuh.org

From here, you can navigate to their Tall Buildings Information & Resources, including The Skyscraper Center, which contains the Global Tall Building Database. The direct link to the Skyscraper Center is:

http://skyscrapercenter.com

Have fun exploring!

Farewell Magnox: 1956 – 2015

Peter Lobner

Magnox reactors were the first generation of nuclear power plants developed in the UK. They were CO2-cooled, graphite moderated power reactors with natural uranium metal fuel. The name Magnox refers to the magnesium-aluminum alloy cladding on the metal fuel rods.

The first two Magnox sites, Calder Hall and Chapelcross, each had four dual-purpose reactors primarily intended to produce nuclear material for the UK nuclear weapons program, with the secondary role of generating electricity for UK’s national grid. The first unit at Calder Hall went critical in May 1956 and, on 27 August 1956, became the first UK nuclear power plant to connect to the national power grid. All subsequent Magnox plants were larger, two-unit commercial nuclear power plants. The UK’s fleet of Magnox plants reached a total of 26 units at 11 sites. On 30 December 2015, the final Magnox plant, Wylfa unit 1, ceased generation after operating for 44 years. This milestone ended 59 years of Magnox reactor operation in the UK.

The only remaining CO2-cooled, graphite moderated commercial power reactor in the world are the UK’s Advanced Gas-cooled Reactors (AGRs). Other commercial operators of CO2-cooled, graphite-moderated reactors have retired their units: Italy in 1987, Spain in 1990, France in 1994, and Japan in 1998. North Korea operates a small CO2-cooled, graphite-moderated reactor that likely has been used for nuclear material production.

Following is a brief overview of this pioneering reactor type.

Overview of Magnox reactors:

A Magnox reactor has a large reactor core that operated at low power density (< 1 kW/liter) and relatively temperatures, which enabled the use of uranium metal fuel and Magnox cladding. The relatively low operating pressure (typically 130 – 150 psig) of the primary circuit enabled the use mild steel for the primary pressure boundary.

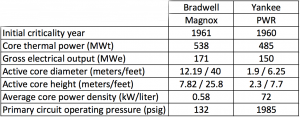
Here’s a comparison of some key parameters for the early Bradwell Magnox reactor and the similar vintage early U.S. pressurized water reactor (PWR), Yankee.
Magnox-PWR comparison

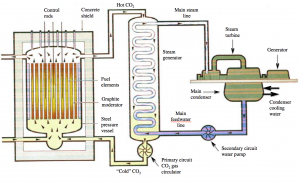
The basic gas and fluid flow paths in the earlier Magnox plants are shown in the following diagram, which shows one of four steam generators. In the closed-loop steel primary circuit, forced circulation of CO2 transfers heat from the reactor core to the steam generators, which in turn transfer heat into the secondary circuit. In the closed-loop secondary circuit, water delivered to the steam generators is heated and converted to steam, which drives turbine generators to produce electricity. The steam exhausted from the turbines is condensed in the main condensers and returned to the steam generators. An open- or closed-loop circulating water system transfers waste heat from the main condensers to a heat sink (i.e., cooling towers or a body of water).
Magnox reactor 1_IEE adapted

Image credit: adapted from The Institution of Electrical Engineers, London, ISBN 0 85296 581 8

The first two 4-unit Magnox sites, Calder Hall and Chapelcross, were dual-use sites producing nuclear material for the military and electric power for the UK power grid. Calder Hall was the world’s first nuclear power plant capable of delivering “industrial scale“ electric power (initially 35 MWe net per reactor, 140 MWe total), which far exceeded the generating capacities of the two nuclear plants that previously had connected to their local grids in Russia (Obninsk, 27 June 1954, 6 MWe) and the USA (Borax III, 17 July 1955, 500 kWe).

Calder Hall operated from 1956 to 2003 and produced weapons-grade plutonium until about 1995, when the UK government announced that the production of plutonium for weapons purposes had ceased. Chapelcross operated from 1959 to 2004. Two Chapelcross units produced tritium for the UK nuclear weapons program and required enriched uranium fuel.

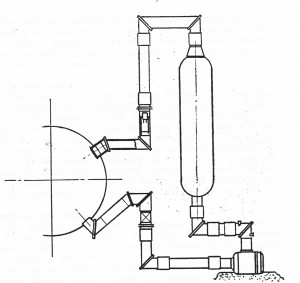
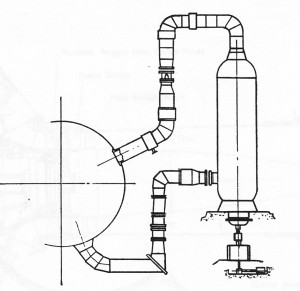
The first two 2-unit Magnox commercial power stations were Berkeley and Bradwell, which were followed by seven more 2-unit Magnox stations in the UK. The physical arrangement of Magnox plants varied significantly from plant to plant, as designers revised gas circuit designs, refueling schemes (top or bottom refueling), and other features. The following diagrams show the differences between the Hinkley Point and later Sizewell gas circuits.
Magnox gas circuit-Hinkley Point

Hinkley Point with separate CO2 gas blower and steam generator.  Image credit: Nuclear Engineering, April 1965
Magnox gas circuit-Sizewell

Sizewell with CO2 gas blower integral with the steam generator. Image credit: Nuclear Engineering, April 1965

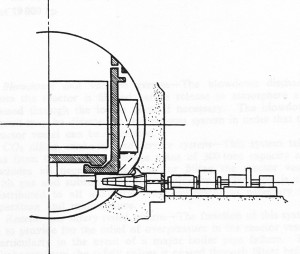
In the last two Magnox plants, Oldbury and Wylfa, the steel primary circuit pressure vessel, piping and external steam generators were replaced by an integral primary circuit housed inside a prestressed concrete reactor vessel (PCRV) with integral steam generators. The Oldbury PCRV was cylindrical and Wylfa’s was spherical. The physical arrangement for Wylfa’s primary circuit is shown in the following diagram, which shows a CO

In the last two Magnox plants, Oldbury and Wylfa, the steel primary circuit pressure vessel, piping and external steam generators were replaced by an integral primary circuit housed inside a prestressed concrete reactor vessel (PCRV) with integral steam generators. The Oldbury PCRV was cylindrical and Wylfa’s was spherical. The physical arrangement for Wylfa’s primary circuit is shown in the following diagram, which shows a CO2 blower drive unit outside the PCRV.
Magnox gas circuit - Wylfa

Wylfa integral primary circuit.  Image credit: Nuclear Engineering, April 1965

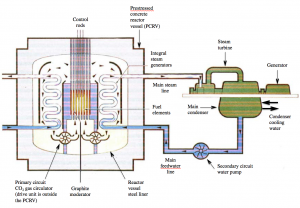
The basic gas and fluid flow paths in the Oldbury and Wylfa Magnox plants are shown in the following diagram. Note that steam generator modules surrounding the reactor core inside the PCRV.
Magnox reactor 2_IEE adapted

Image credit: adapted from The Institution of Electrical Engineers, London, ISBN 0 85296 581 8

A generic issue for all Magnox plants was the corrosion of mild steel components by the high temperature CO2 coolant. To manage this issue, the average core outlet gas temperature was reduced from the original design temperature of 414 °C to 360 – 380 °C, with a corresponding decrease in net power output and thermal efficiency.

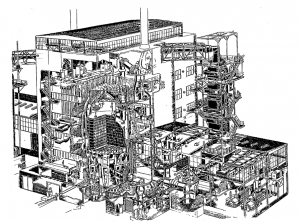
None of the Magnox reactors are enclosed in a pressure-retaining containment building, as is common practice for most other types of power reactors. In the early Magnox plants, only the reactor was inside an industrial-style building , while the steam generators and parts of the primary circuit piping were outside the building, as shown in the following diagram of a single unit at Calder Hall. The steam generators were enclosed in later plants, primarily to protect them from the weather.
Calder Hall

Image source: NKS-2, ISBN 87-7893-050-2

Accident conditions in a Magnox reactor are very different than in a water-cooled reactor. Magnox reactors do not encounter coolant phase change during an accident or have a risk of the core becoming “uncovered” because of a loss of coolant through a breach in the primary circuit. The low core power density, the large heat capacity of the graphite moderator, and the availability of natural circulation flow paths for core cooling limit post-accident core temperatures. On this basis, Magnox reactors were permitted to operate with three barriers to the release of fission products to the atmosphere: the metal fuel matrix, the Magnox fuel cladding, and the mild steel primary circuit pressure boundary.

Export Magnox plants:

The following two single-unit Magnox nuclear power plants were exported to Italy and Japan.

Latina:       Operated from 1963 to 1987; originally rated at 210 MWe, derated to 160 MWe

Tōkai 1:     Operated from 1966 to 1998; 166 MWe

UK’s successor to the Magnox:

The UK’s second generation commercial power reactor is the Advanced Gas-cooled Reactor (AGR), which is a more advanced, higher-temperature, CO2-cooled, graphite moderated reactor with stainless steel clad, enriched UO2 fuel. The UK’s fleet of AGRs totals 14 units at 6 sites. All are currently operating. Retirement of the oldest units is expected to start in about 2023.

French CO2-cooled, graphite moderated reactors:

In the early 1950s, the UK and France arrived at the same basic fuel / coolant / moderator selection for their first generation power reactors:

  • Natural uranium metal fuel
  • CO2 coolant
  • Graphite moderator

This choice was driven largely by the desire for nuclear independence and the unavailability of enriched uranium, which the U.S. refused to export, and heavy water (moderator), which was not available in significant quantities.

In France, these reactors were known as UNGG (Uranium Naturel Graphite Gaz), which were developed independently of the UK Magnox reactors. All UNGGs used magnesium-zirconium alloy fuel cladding instead of the Magnox magnesium-aluminum alloy.

The first UNGGs were the dual-use Marcoule G2 and G3 reactors, which produced nuclear material for the French nuclear weapons programs and also had a net electric power output of about 27 MWe. The horizontal reactor core was housed in a steel-lined PCRV with external steam generators.

Initial criticality of Marcoule G2 occurred on 21 July 1958, and it first generated electricity in April 1959. Marcoule G3 began operation in 1960. G2 was retired in 1980 and G3 in 1984.

Electricité de France (EDF) built six larger UNGG commercial nuclear power plants in three basic configurations:

  • The early Chinon A1 and A2 plants had a vertical reactor core in a steel primary circuit. These plants had net electrical outputs of 70 MWe (A1) and 200 MWe (A2). A1 operated for 10 years from 1963 to 1973. A2 operated longer, from 1965 to 1985.
  • The later 480 MWe Chinon A3 plant adopted a different design, with a vertical reactor core in a PCRV with external steam generators. A3 operated for 24 years, from 1966 to 1990.
  • The 480 – 515 MWe A1 and A2 plants at Saint Laurent-des-Eaux and the 540 MWe Bugey 1 plant adopted a more advanced and compact design, with an integral primary circuit in a steel-lined PCRV. Unlike the Wylfa Magnox plant, the steam generators were placed under the reactor core in a tall PCRV, as shown in the following diagram. This basic arrangement is similar to the U.S. Fort St. Vrain helium-cooled high-temperature gas-cooled reactor (HTGR) built in the 1970s. Saint Laurent A1 operated from 1969 to 1990, A2 from 1971 to 1994, and Bugey 1 from 1972 to 1994.
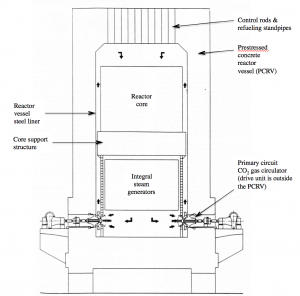
St Laurent gas circuit adapted

Image credit: adapted from Nuclear Engineering, Feb 1968

Export UNGG:

France exported to Spain one UNGG similar to the Saint Laurent-des-Eaux plant. This became the 508 MWe Vandellos unit 1 power plant, which operated from 1972 to 1990.

French successor to the UNGG:

After Bugey 1, France abandoned gas-cooled reactor technology for commercial nuclear power plants. Pressurized water reactor (PWR) technology was chosen for the next generation of French commercial power reactors: the CP0 900 MW PWR.

North Korean CO2-cooled, graphite moderated reactor:

North Korea’s Yongbyon nuclear plant is a CO2-cooled, graphite-moderated reactor with natural uranium fuel. This is a logical choice of reactor type because natural uranium and graphite are domestically available in North Korea. Yongbyon is believed to be a dual-use production reactor that is modeled after the UK’s Calder Hall Magnox reactor.

Yongbyon is believed to have a thermal power in the 20 – 25 MWt range and a net electrical output of about 5 MWe. Reactor operation began in 1986. In 2007, operation of Yongbyon was disabled when the cooling towers were demolished to comply with an international agreement related to preventing North Korean production of nuclear material. On 2 April 2013, North Korea announced it would restart Yongbyon. NTI reported that Yongbyon has been operating since September 2013. See details at the following link:

http://www.nti.org/learn/facilities/766/

Fukushima Daiichi Current Status and Lessons Learned

Peter Lobner

The International Atomic Energy Agency (IAEA) presents a great volume of information related to the 12 March 2011 Fukushima Daiichi accident and the current status of planning and recovery actions on their website at the following link:

https://www.iaea.org/newscenter/focus/fukushima

From this web page, you can navigate to many resources, including: Fukushima Daiichi Status Updates, 6 September 2013 – Present. Here is the direct link to the status updates:

https://www.iaea.org/newscenter/focus/fukushima/status-update

The IAEA’s voluminous 2015 report, The Fukushima Daiichi Accident, consists of the Report by the IAEA Director General and five technical volumes. The IAEA states that this report is the result of an extensive international collaborative effort involving five working groups with about 180 experts from 42 Member States with and without nuclear power programs and several international bodies. It provides a description of the accident and its causes, evolution and consequences based on the evaluation of data and information from a large number of sources.

IAEA Fukushima  Source: IAEA

You can download all or part of this report and its technical annexes at the following link to the IAEA website:

http://www-pub.iaea.org/books/IAEABooks/10962/The-Fukushima-Daiichi-Accident

There have been many reports on the Fukushima Daiichi accident and lessons learned. A few of the more recent notable documents are identified briefly below along with the web links from which you can download these documents.

Japan’s Nuclear Regulatory Authority (NRA):

A summary of the NRA’s perspective on Fukushima accident and lessons learned is the subject of the March 2014 presentation, “Lessons Learned from the Fukushima Dai-ichi Accident and Responses in New Regulatory Requirements.” You can download this presentation at the following link:

http://www-pub.iaea.org/iaeameetings/cn233p/OpeningSession/1Fuketa.pdf

 National Academy of Sciences:

The U.S. Congress asked the National Academy of Sciences to conduct a technical study on lessons learned from the Fukushima Daiichi accident for improving safety and security of commercial nuclear power plants in the U.S. This study was carried out in two phases. The Phase 1 report, Lessons Learned from the Fukushima Nuclear Accident for Improving Safety of U.S. Nuclear Plants, was issued in 2014, and focused on the causes of the Fukushima Daiichi accident and safety-related lessons learned for improving nuclear plant systems, operations, and regulations exclusive of spent fuel storage.

NAP Fukushima Phase 1  Source: NAP

If you have a MyNAP account, you can download the Phase 1 report at the following link to the National Academies Press website:

http://www.nap.edu/catalog/18294/lessons-learned-from-the-fukushima-nuclear-accident-for-improving-safety-of-us-nuclear-plants

The Phase 2 report, Lessons Learned from the Fukushima Accident for Improving Safety and Security of U.S. Nuclear Plants: Phase 2, recently issued in 2016, focuses on three issues: (1) lessons learned from the accident for nuclear plant security, (2) lessons learned for spent fuel storage, and (3) reevaluation of conclusions from previous Academies studies on spent fuel storage.

NAP Fukushima Phase 2  Source: NAP

If you have a MyNAP account, you can download the Phase 2 report at the following link:

http://www.nap.edu/catalog/21874/lessons-learned-from-the-fukushima-nuclear-accident-for-improving-safety-and-security-of-us-nuclear-plants

U.S. Nuclear Regulatory Commission (NRC):

A summary of the U.S. NRC’s response to the Fukushima accident is contained in the May 2014 presentation, “NRC Update, Fukushima Lessons Learned.” You can download this presentation at the following link:

http://nnsa.energy.gov/sites/default/files/nnsa/07-14-multiplefiles/May%2013%20-%208_LAUREN%20GIBSON%20NRC%20Update%20-%20Fukushima%20Lessons%20Learned.pdf

U.S. Energy Information Administration’s (EIA) Early Release of a Summary of its Annual Energy Outlook (AEO) Provides a Disturbing View of Our Nation’s Energy Future

Peter Lobner

Each year, the EIA issues an Annual Energy Outlook that provides energy industry recent year data and projections for future years. The 2016 AEO includes actual data of 2014 and 2015, and projections to 2040. These data include:

  • Total energy supply and disposition demand
  • Energy consumption by sector and source
  • Energy prices by sector and source
  • Key indicators and consumption by sector (Residential, Commercial, Industrial, Transportation)
  • Electricity supply, disposition, prices and emissions
  • Electricity generating capacity
  • Electricity trade

On 17 May, EIA released a PowerPoint summary of AEO2016 along with the data tables used in this Outlook.   The full version of AEO2016 is scheduled for release on 7 July 2016.

You can download EIA’s Early Release PowerPoint summary and any of the data tables at the following link:

http://www.eia.gov/forecasts/aeo/er/index.cfm

EIA explains that this Summary features two cases: the Reference case and a case excluding implementation of the Clean Power Plan (CPP).

  • Reference case: A business-as-usual trend estimate, given known technology and technological and demographic trends. The Reference case assumes Clean Power Plan (CPP) compliance through mass-based standards (emissions reduction in metric tones of carbon dioxide) modeled using allowances with cooperation across states at the regional level, with all allowance revenues rebated to ratepayers.
  • No CPP case: A business-as-usual trend estimate, but assumes that CPP is not implemented.

You can find a good industry assessment of the AEO2016 Summary on the Global Energy World website at the following link:

http://www.globalenergyworld.com/news/24141/Obama_Administration_s_Electricity_Policies_Follow_the_Failed_European_Model.htm

A related EIA document that is worth reviewing is, Assumptions to the Annual Energy Outlook 2015, which you will find at the following link:

http://www.eia.gov/forecasts/aeo/assumptions/

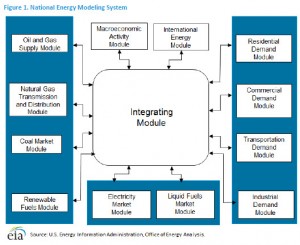
This report presents the major assumptions of the National Energy Modeling System (NEMS) used to generate the projections in AE02015. A 2016 edition of Assumptions is not yet available. The functional organization of NEMS is shown below.

EIA NEMS

The renewable fuels module in NEMS addresses solar (thermal and photovoltaic), wind (on-shore and off-shore), geothermal, biomass, landfill gas, and conventional hydroelectric.

The predominant renewable sources are solar and wind, both of which are intermittent sources of electric power generation. Except for the following statements, the EIA assumptions are silent on the matter of energy storage systems that will be needed to manage electric power quality and grid stability as the projected use of intermittent renewable generators grows.

  • All technologies except for storage, intermittents and distributed generation can be used to meet spinning reserves
  • The representative solar thermal technology assumed for cost estimation is a 100-megawatt central-receiver tower without integrated energy storage
  • Pumped storage hydroelectric, considered a nonrenewable storage medium for fossil and nuclear power, is not included in the supply

In my 4 March 2016 post, “Dispatchable Power from Energy Storage Systems Help Maintain Grid Stability,” I addressed the growing importance of such storage systems as intermittent power generators are added to the grid. In the context of the AEO, the EIA fails to address the need for these costly energy storage systems and they fail to allocate the cost of energy storage systems to the intermittent generators that are the source of the growing demand for the energy storage systems. As a result, the projected price of energy from intermittent renewable generators is unrealistically low in the AEO.

Oddly, NEMS does not include a “Nuclear Fuel Module.” Nuclear power is represented in the Electric Market Module, but receives no credit as a non-carbon producing source of electric power. As I reported in my posts on the Clean Power Plan, the CPP gives utilities no incentives to continue operating nuclear power plants or to build new nuclear power plants (see my 27 November 2015 post, “Is EPA Fudging the Numbers for its Carbon Regulation,” and my 2 July 2015 post, “EPA Clean Power Plan Proposed Rule Does Not Adequately Recognize the Role of Nuclear Power in Greenhouse Gas Reduction.”). With the current and expected future low price of natural gas, nuclear power operators are at a financial disadvantage relative to operators of large central station fossil power plants. This is the driving factor in the industry trend of early retirement of existing nuclear power plants.

The following 6 May 2016 announcement by Exelon highlights the current predicament of a high-performing nuclear power operator:

“Exelon deferred decisions on the future of its Clinton and Quad Cities plants last fall to give policymakers more time to consider energy market and legislative reforms. Since then, energy prices have continued to decline. Despite being two of Exelon’s highest-performing plants, Clinton and Quad Cities have been experiencing significant losses. In the past six years, Clinton and Quad Cities have lost more than $800 million, combined.“

“Exelon announced today that it will need to move forward with the early retirements of its Clinton and Quad Cities nuclear facilities if adequate legislation is not passed during the spring Illinois legislative session, scheduled to end on May 31 and if, for Quad Cities, adequate legislation is not passed and the plant does not clear the upcoming PJM capacity auction later this month.”

“Without these results, Exelon would plan to retire Clinton Power Station in Clinton, Ill., on June 1, 2017, and Quad Cities Generating Station in Cordova, Ill., on June 1, 2018.”

You can read Exelon’s entire announcement at the following link:

http://www.exeloncorp.com/newsroom/exelon-statement-on-early-retirement-of-clinton-and-quad-cities-nuclear-facilities

Together the Clinton and Quad Cities nuclear power plants have a combined Design Electrical Rating of 2,983 MWe from a non-carbon producing source. For the period 2013 – 2015, the U.S. nuclear power industry as a whole had a net capacity factor of 90.41. That means that the nuclear power industry delivered 90.41% of the DER of the aggregate of all U.S. nuclear power plants. The three Exelon plants being considered for early retirement exceeded this industry average performance with the following net capacity factors: Quad Cities 1 @ 101.27; Quad Cities 2 @ 92.68, and Clinton @ 91.26.

For the same 2013 – 2015 period, EIA reported the following net capacity factors for wind (32.96), solar photovoltaic (27.25), and solar thermal (21.25).  Using the EIA capacity factor for wind generators, the largest Siemens D7 wind turbine, which is rated at 7.0 MWe, delivers an average output of about 2.3 MWe. We would need more than 1,200 of these large wind turbines just to make up for the electric power delivered by the Clinton and Quad Cities nuclear power plants. Imagine the stability of that regional grid.

CPP continues subsidies to renewable power generators. In time, the intermittent generators will reduce power quality and destabilize the electric power grid unless industrial-scale energy storage systems are deployed to enable the grid operators to match electricity supply and demand with reliable, dispatchable power.

As a nation, I believe we’re trending toward more costly electricity with lower power quality and reliability.

I hope you share my concerns about this trend.

Wave Glider Autonomous Vehicle Harvests Wave and Solar Power to Deliver Unique Operational Capabilities at Sea

Peter Lobner

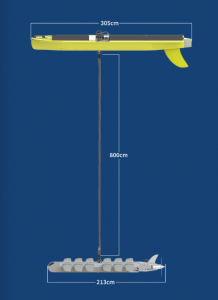
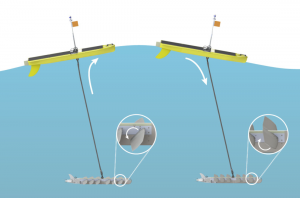
The U.S. firm Liquid Robotics, Inc., in Sunnyvale, CA, designs, manufactures, and sells small unmanned surface vehicles (USVs) called Wave Gliders, which consist of two parts: an underwater “glider” that provides propulsion and a surface payload vehicle that houses electronics and a solar-electric power system. The physical arrangement of a Wave Glider is shown in the following diagrams. The payload vehicle is about 10 feet (305 cm) long. The glider is about 7 feet (213 cm) long and is suspended about 26 feet (800 cm) below the payload vehicle.

Wave Glider configurationSource: Liquid Robotics. Note: 800 cm suspension distance is not to scale.

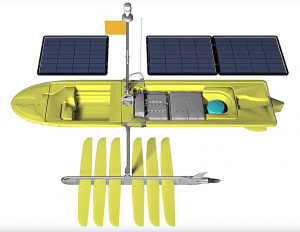
The payload vehicle is topped with solar panels and one or more instrumentation / communication / navigation masts. The interior modular arrangement of a Wave Glider is shown in the following diagram. Wave Glider is intended to be an open, extensible platform that can be readily configured for a wide range of missions.

Wave Glider configuration 2Source: Liquid Robotics

The Wave Glider is propelled by wave power using the operational principle for wave power harvesting shown in the following diagram. Propulsion power is generated regardless of the heading of the Wave Glider relative to the direction of the waves, enabling sustained vehicle speeds of 1 to 3 knots.

Wave Glider propulsion schemeSource: Liquid Robotics

The newer SV3 Wave Glider has a more capable electric power system than its predecessor, the SV2, enabling the SV3 glider to be equipped with an electric motor-driven propeller for supplementary solar-electric propulsion. SV3 also is capable of towing and supplying power to submerged instrument packages.

Autonomous navigation and real-time communications capabilities enable Wave Gliders to be managed individually or in fleets. The autonomous navigation capability includes programmable course navigation, including precise hold-station capabilities, and surface vessel detection and avoidance.

Originally designed to monitor whales, the Wave Glider has matured into a flexible, multi-mission platform for ocean environmental monitoring, maritime domain awareness / surveillance, oil and gas exploration / operations, and defense.

More information and short videos on the operation of the Wave Glider are available on the Liquid Robotics website at the following link:

http://www.liquid-robotics.com/platform/overview/

On 28 April 2016, the U.S. Navy announced that it was in the process of awarding Liquid Robotics a sole-source contract for Wave Glider USV hardware and related services. You can read the Notice of Intent at the following link:

https://www.fbo.gov/index?s=opportunity&mode=form&id=6abb899b3e3286bfcd861fc5dedfdb65&tab=core&_cview=0

As described by the Navy:

“The required USV is a hybrid sea-surface USV comprised of a submerged ‘glider’ that is attached via a tether to a surface float. The vehicle is propelled by the conversion of ocean wave energy into forward thrust, independent of wave direction. No electrical power is generated by the propulsion mechanism.”

Navy requirements for the Wave Glider USV include the following:

  • Mission: Capable of unsupported autonomous missions of up to ten months duration, with long distance transits of up to 1,000 nautical miles in the open ocean
  • Propulsion: Wave power harvesting at all vehicle-to-wave headings, with sustained thrust adequate under own propulsion sufficient to tow significant loads
  • Electric Power: Solar energy harvesting during daylight hours, with power generation / storage capabilities sufficient to deliver ten watts to instrumentation 24/7
  • Instrumentation: Payload of 20 pounds (9.1 kg)
  • Navigation: Commandable vehicle heading and autonomous on-board navigation to a given and reprogrammable latitude/longitude waypoint on the ocean’s surface
  • Survivability: Sea states up to a rating of five and winds to 50 knots
  • Stealth: Minimal radar return, low likelihood of visual detectability, minimal radiated acoustic noise

In my 11 April 2016 post, I discussed how large autonomous surface and underwater vehicles will revolutionize the ways in which the U.S. Navy conducts certain operational missions. Wave Glider is at the opposite end of the autonomous vehicle size range, but retains the capability to conduct long-duration, long-distance missions. It will be interesting to see how the Navy employs this novel autonomous vehicle technology.

Stunning Ultra High Resolution Images From the Google Art Camera

Peter Lobner

The Google Cultural Institute created the ultra high resolution Art Camera as a tool for capturing extraordinary digital images of two-dimensional artwork. The Institute states:

 “Working with museums around the world, Google has used its Art Camera system to capture the finest details of artworks from their collection.”

A short video at the following link provides a brief introduction to the Art Camera.

https://www.youtube.com/watch?v=dOrJesw5ET8

The Art Camera simplifies and speeds up the process of capturing ultra high resolution digital images, enabling a 1 meter square (39.4 inch square) piece of flat art to be imaged in about 30 minutes. Previously, this task took about a day using third-party scanning equipment.

The Art Camera is set up in front of the artwork to be digitized, the edges of the image to be captured are identified for the Art Camera, and then the camera proceeds automatically, taking ultra high-resolution photos across the entire surface within the identified edges. The resulting set of digital photos are processed by Google and converted into a single gigapixel file.

Google has built 20 Art Cameras and is lending them out to institutions around the world at no cost to assist in capturing digital images of important art collections.

You can see many examples of artwork images captured by the Art Camera at the following link:

https://www.google.com/culturalinstitute/project/art-camera

Among the images on this site is the very detailed Chinese ink and color on silk image shown below. The original image measures about 39 x 31 cm (15 x 12 inches). The first image below is of the entire scene. Following are two images that show the higher resolution available as you zoom in on the dragon’s head and reveal the fine details of the original image, including the weave in the silk fabric.

Google cultural Institute image

GCI image detail 1

GCI image detail 2

Image credit, three images above: Google Cultural Institute/The Nelson-Atkins Museum of Art

In the following pointillist painting by Camille Pissarro, entitled Apple Harvest, the complex details of the artist’s brush strokes and points of paint become evident as you zoom in and explore the image. The original image measures about 74 x 61 cm (29 x 24 inches).

Pissaro Apple Harvest

Pissaro image detail 1

Pissaro image detail 2

Image credit, three images above: Google Cultural Institute/Dallas Museum of Art

Hopefully, art museums and galleries around the world will take advantage of Google’s Art Camera or similar technologies to capture and present their art collections to the world in this rich digital format.

5G is Coming, Slowly

Peter Lobner

The 5th generation of mobile telephony and data services, or 5G, soon will be arriving at a cellular service provider near each of us, but probably not this year. To put 5G in perspective, let’s start with a bit of telecommunications history.

1. Short History of Mobile Telephony and Data Services

0G non-cellular radio-telephone service:

  • 1946 – Mobile Telephone Service (MTS): This pre-cellular, operator assisted, mobile radio-telephone service required a full duplex VHF radio transceiver in the mobile user’s vehicle to link the mobile user’s phone to the carrier’s base station that connected the call to the public switched telephone network (PSTN) and gave access to the land line network. Each call was allocated to a specific frequency in the radio spectrum allocated for radio-telephone use. This type of access is called frequency division multiple access (FDMA). When the Bell System introduced MTS in 1946 in St. Louis, only three channels were available, later increasing to 32 channels.
  • 1964 – Improved Mobile Telephone Service (IMTS): This service provided full duplex UHF/VHF communications between a radio transceiver (typically rated at 25 watts) in the mobile user’s vehicle and a base station that covered an area 40 – 60 miles (64.3 – 96.6 km) in diameter. Each call was allocated to a specific frequency. The base station connected the call to the PSTN, which gave access to the land line network.

1G analog cellular phone service:

  • 1983 – Advanced Mobile Phone System (AMPS): This was the original U.S. fully automated, wireless, portable, cellular standard developed by Bell Labs. AMPS operated in the 800 MHz band and supported phone calls, but not data. The control link between the cellular phone and the cell site was a digital signal. The voice signal was analog. Motorola’s first cellular phone, DynaTAC, operated on the AMPS network.
    •  AMPS used FDMA, so each user call was assigned to a discrete frequency for the duration of the call. FDMA resulted in inefficient use of the carrier’s allocated frequency spectrum.
    • In Europe the comparable 1G standards were TACS (Total Access Communications System, based on AMPS) and NMT (Nordic Mobile Telephone).
    • The designation “1G” was retroactively assigned to analog cellular services after 2G digital cellular service was introduced. As of 18 February 2008, U.S. carriers were no longer required to support AMPS.

2G digital cellular phone and data services:

  • 1991 – GSM (Global System for Mobile), launched in Finland, was the first digital wireless standard. 2G supports digital phone calls, SMS (Short Message Service) text messaging, and MMS (Multi-Media Message). 2G networks typically provide data speeds ranging from 9.6 kbits/s to 28.8 kbits/s. This relatively slow data speed is too slow to provide useful Internet access in most cases. Phone, messages and the control link between the cellular phone and the cell site all are digital signals.
    •  GSM operates on the 900 and 1,800 MHz bands using TDMA (time division multiple access) to manage up to 8 users per frequency channel. Each user’s digital signal is parsed into discrete time slots on the assigned frequency and then reassembled for delivery.
    • Today GSM is used in about 80% of all 2G devices
  • 1995 – Another important 2G standard is Interim Standard 95 (IS-95), which was the first code division multiple access (CDMA) standard for digital cellular technology. IS-95 was developed by Qualcomm and adopted by the U.S. Telecommunications Industry Association in 1995. In a CDMA network, each user’s digital signal is parsed into discrete coded packets that are transmitted and then reassembled for delivery. For a similar frequency bandwidth, a CDMA cellular network can handle more users than a TDMA network.
  • 2003 – EDGE (Enhanced Data Rates for GSM Evolution) is a backwards compatible evolutionary development of the basic 2G GSM system. EDGE generally is considered to be a pre-3G cellular technology. It uses existing GSM spectra and TDMA access and is capable of improving network capacity by a factor of about three.
  •  In the U.S., some cellular service providers plan to terminate 2G service by the end of 2016.

3G digital cellular phone and data services:

  • 1998 – There are two main 3G standards for cellular data: IMT-2000 and CDMA2000. All 3G networks deliver higher data speeds of at least 200 kbits/s and lower latency (the amount of time it takes for the network to respond to a user command) than 2G. High Speed Packet Access (HSPA) technology enables even higher 3G data speeds, up to 3.6 Mbits/s. This enables a very usable mobile Internet experience with applications such as global positioning system (GPS) navigation, location-based services, video conferencing, and streaming mobile TV and on-demand video.
    •  IMT (International Mobile Telecommunications) -2000 accommodates three different access technologies: FDMA, TDMA and CDMA. Its principal implementations in Europe, Japan, Australia and New Zealand use wideband CDMA (W-CDMA) and is commonly known as the Universal Mobile Telecommunications System (UMTS). Service providers must install almost all new equipment to deliver UMTS 3G service. W-CDMA requires a larger available frequency spectrum than CDMA.
    • CDMA2000 is an evolutionary development of the 2G CDMA standard IS-95. It is backwards compatible with IS-95 and uses the same frequency allocation. CDMA2000 cellular networks are deployed primarily in the U.S. and South Korea.
  • 3.5G enhances performance further, bringing cellular Internet performance to the level of low-end broadband Internet. With peak data speeds of about 7.2 Mbits/sec.

4G digital cellular phone and data services:

  • 2008 – IMT Advanced: This standard, adopted by the International Telecommunications Union (ITU), defines basic features of 4G networks, including all-IP (internet protocol) based mobile broadband, interoperability with existing wireless standards, and a nominal data rate of 100 Mbit/s while the user is moving at high speed relative to the station (i.e., in a vehicle).
  • 2009 – LTE (Long Term Evolution): The primary standard in use today is known as 4G LTE, which first went operational in Oslo and Stockholm in December 2009. Today, all four of the major U.S. cellular carriers offer LTE service.
    • In general, 4G LTE offers full IP services, with a faster broadband connection with lower latency compared to previous generations. The peak data speed typically is 1Gbps, which translates to between 1Mbps and 10Mbps for the end user.
    • There are different ways to implement LTE. Most 4G networks operate in the 700 to 800 MHz range of the spectrum, with some 4G LTE networks operating at 3.5 GHz.

2. The Hype About 5G

The goal of 5G is to deliver a superior wireless experience with speeds of 10Mbps to 100Mbps and higher, with lower latency, and lower power consumption than 4G. Some claim that 5G has the potential to offer speeds up to 40 times faster than today’s 4G LTE networks. In addition, 5G is expected to reduce latency to under a millisecond, which is comparable to the latency performance of today’s high-end broadband service.

With this improved performance, 5G will enable more powerful services on mobile devices, including:

  • Rapid downloads / uploads of large files; fast enough to stream “8K” video in 3-D. This would allow a person with a 5G smartphone to download a movie in about 6 seconds that would take 6 minutes on a 4G network.
  • Enable deployment of a wider range of IoT (Internet of Things) devices on networks where everything is connected to everything else and IoT devices are communicating in real-time. These devices include “smart home” devices and longer-lasting wearable devices, both of which benefit from 5G’s lower power consumption and low latency.
  • Provide better support for self-driving cars, each of which is a complex IoT node that needs to communicate in real time with external resources for many functions, including navigation, regional (beyond the range of the car’s own sensors) situation awareness, and requests for emergency assistance.
  • Provide better support for augmented reality / virtual reality and mobile real-time gaming, both of which benefit from 5G’s speed and low latency

3. So what’s the holdup?

5G standards have not yet been yet and published. The ITU’s international standard is expected to be known as IMT-2020. Currently, the term “5G” doesn’t signify any particular technology.

5G development is focusing on use of super-high frequencies, as high as 73 GHz. Higher frequencies enable faster data rates and lower latency. However, at the higher frequencies, the 5G signals are usable over much shorter distances than 4G, and the 5G signals are more strongly attenuated by walls and other structures. This means that 5G service will require deployment of a new network architecture and physical infrastructure with cell sizes that are much smaller than 4G. Cellular base stations will be needed at intervals of perhaps every 100 – 200 meters (328 to 656 feet). In addition, “mini-cells” will be needed inside buildings and maybe even individual rooms.

Fortunately, higher frequencies allow use of smaller antennae, so we should have more compact cellular hardware for deploying the “small cell” architecture. Get ready for new cellular nomenclature, including “microcells”, “femtocells” and “picocells”.

Because of these infrastructure requirements, deployment of 5G will require a significant investment and most likely will be introduced first in densely populated cities.

Initial introduction date is unlikely to be before 2017.

More details on 5G are available in a December 2014 white paper by GMSA Intelligence entitled, “Understanding 5G: Perspectives on Future Technological Advances in Mobile,” which you can download at the following link:

https://gsmaintelligence.com/research/?file=141208-5g.pdf&download

Note that 5G’s limitations inside buildings and the need for “mini-cells” to provide interior network coverage sound very similar to the limitations for deploying Li-Fi, which uses light instead of radio frequencies for network communications. See my 12 December 2015 post for information of Li-Fi technology.

15 July 2016 Update: FCC allocates frequency spectrum to facilitate deploying 5G wireless technologies in the U.S.

On 14 July 2016, the Federal Communications Commission (FCC) announced:

“Today, the FCC adopted rules to identify and open up the high frequency airwaves known as millimeter wave spectrum. Building on a tried-and-true approach to spectrum policy that enabled the explosion of 4G (LTE), the rules set in motion the United States’ rapid advancement to next-generation 5G networks and technologies.

The new rules open up almost 11 GHz of spectrum for flexible use wireless broadband – 3.85 GHz of licensed spectrum and 7 GHz of unlicensed spectrum. With the adoption of these rules, the U.S. is the first country in the world to open high-band spectrum for 5G networks and technologies, creating a runway for U.S. companies to launch the technologies that will harness 5G’s fiber-fast capabilities.”

You can download an FCC fact sheet on this decision at the following link:

https://www.fcc.gov/document/rules-facilitate-next-generation-wireless-technologies

These new rules should hasten the capital investments needed for timely 5G deployments in the U.S.