Peter Lobner
Magnox reactors were the first generation of nuclear power plants developed in the UK. They were CO2-cooled, graphite moderated power reactors with natural uranium metal fuel. The name Magnox refers to the magnesium-aluminum alloy cladding on the metal fuel rods.
The first two Magnox sites, Calder Hall and Chapelcross, each had four dual-purpose reactors primarily intended to produce nuclear material for the UK nuclear weapons program, with the secondary role of generating electricity for UK’s national grid. The first unit at Calder Hall went critical in May 1956 and, on 27 August 1956, became the first UK nuclear power plant to connect to the national power grid. All subsequent Magnox plants were larger, two-unit commercial nuclear power plants. The UK’s fleet of Magnox plants reached a total of 26 units at 11 sites. On 30 December 2015, the final Magnox plant, Wylfa unit 1, ceased generation after operating for 44 years. This milestone ended 59 years of Magnox reactor operation in the UK.
The only remaining CO2-cooled, graphite moderated commercial power reactor in the world are the UK’s Advanced Gas-cooled Reactors (AGRs). Other commercial operators of CO2-cooled, graphite-moderated reactors have retired their units: Italy in 1987, Spain in 1990, France in 1994, and Japan in 1998. North Korea operates a small CO2-cooled, graphite-moderated reactor that likely has been used for nuclear material production.
Following is a brief overview of this pioneering reactor type.
Overview of Magnox reactors:
A Magnox reactor has a large reactor core that operated at low power density (< 1 kW/liter) and relatively temperatures, which enabled the use of uranium metal fuel and Magnox cladding. The relatively low operating pressure (typically 130 – 150 psig) of the primary circuit enabled the use mild steel for the primary pressure boundary.
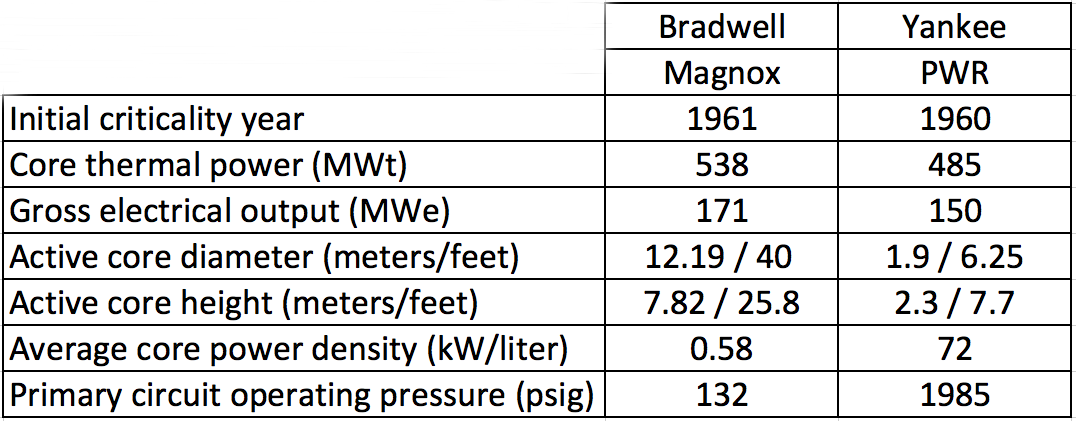
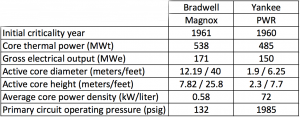
Here’s a comparison of some key parameters for the early Bradwell Magnox reactor and the similar vintage early U.S. pressurized water reactor (PWR), Yankee.
The basic gas and fluid flow paths in the earlier Magnox plants are shown in the following diagram, which shows one of four steam generators. In the closed-loop steel primary circuit, forced circulation of CO2 transfers heat from the reactor core to the steam generators, which in turn transfer heat into the secondary circuit. In the closed-loop secondary circuit, water delivered to the steam generators is heated and converted to steam, which drives turbine generators to produce electricity. The steam exhausted from the turbines is condensed in the main condensers and returned to the steam generators. An open- or closed-loop circulating water system transfers waste heat from the main condensers to a heat sink (i.e., cooling towers or a body of water).
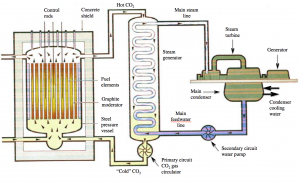
Image credit: adapted from The Institution of Electrical Engineers, London, ISBN 0 85296 581 8
The first two 4-unit Magnox sites, Calder Hall and Chapelcross, were dual-use sites producing nuclear material for the military and electric power for the UK power grid. Calder Hall was the world’s first nuclear power plant capable of delivering “industrial scale“ electric power (initially 35 MWe net per reactor, 140 MWe total), which far exceeded the generating capacities of the two nuclear plants that previously had connected to their local grids in Russia (Obninsk, 27 June 1954, 6 MWe) and the USA (Borax III, 17 July 1955, 500 kWe).
Calder Hall operated from 1956 to 2003 and produced weapons-grade plutonium until about 1995, when the UK government announced that the production of plutonium for weapons purposes had ceased. Chapelcross operated from 1959 to 2004. Two Chapelcross units produced tritium for the UK nuclear weapons program and required enriched uranium fuel.
The first two 2-unit Magnox commercial power stations were Berkeley and Bradwell, which were followed by seven more 2-unit Magnox stations in the UK. The physical arrangement of Magnox plants varied significantly from plant to plant, as designers revised gas circuit designs, refueling schemes (top or bottom refueling), and other features. The following diagrams show the differences between the Hinkley Point and later Sizewell gas circuits.
Hinkley Point with separate CO2 gas blower and steam generator. Image credit: Nuclear Engineering, April 1965

Sizewell with CO2 gas blower integral with the steam generator. Image credit: Nuclear Engineering, April 1965
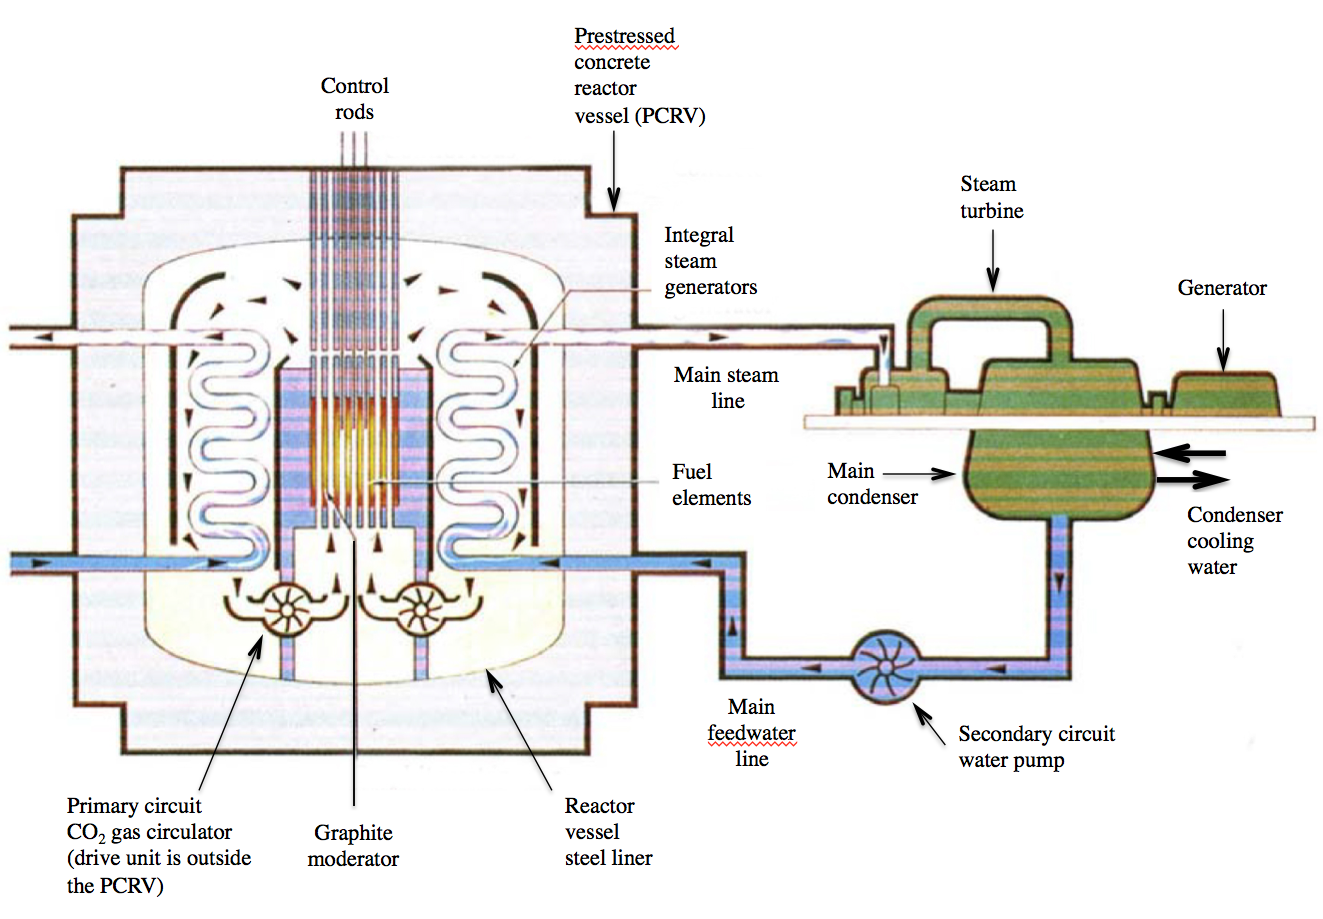
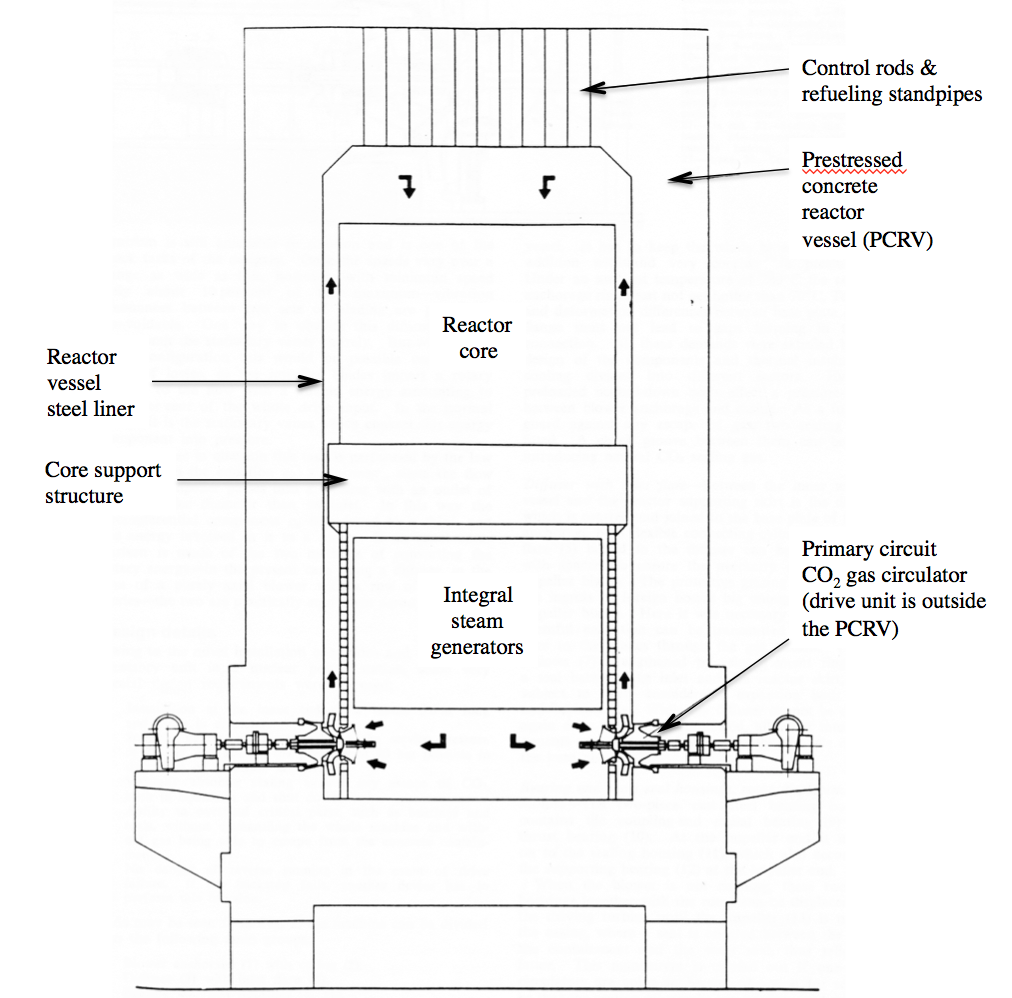
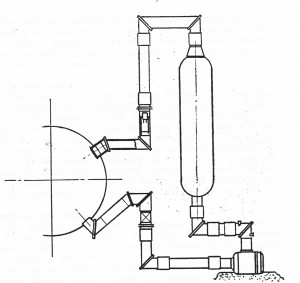
In the last two Magnox plants, Oldbury and Wylfa, the steel primary circuit pressure vessel, piping and external steam generators were replaced by an integral primary circuit housed inside a prestressed concrete reactor vessel (PCRV) with integral steam generators. The Oldbury PCRV was cylindrical and Wylfa’s was spherical. The physical arrangement for Wylfa’s primary circuit is shown in the following diagram, which shows a CO
In the last two Magnox plants, Oldbury and Wylfa, the steel primary circuit pressure vessel, piping and external steam generators were replaced by an integral primary circuit housed inside a prestressed concrete reactor vessel (PCRV) with integral steam generators. The Oldbury PCRV was cylindrical and Wylfa’s was spherical. The physical arrangement for Wylfa’s primary circuit is shown in the following diagram, which shows a CO2 blower drive unit outside the PCRV.
Wylfa integral primary circuit. Image credit: Nuclear Engineering, April 1965
The basic gas and fluid flow paths in the Oldbury and Wylfa Magnox plants are shown in the following diagram. Note that steam generator modules surrounding the reactor core inside the PCRV.

Image credit: adapted from The Institution of Electrical Engineers, London, ISBN 0 85296 581 8
A generic issue for all Magnox plants was the corrosion of mild steel components by the high temperature CO2 coolant. To manage this issue, the average core outlet gas temperature was reduced from the original design temperature of 414 °C to 360 – 380 °C, with a corresponding decrease in net power output and thermal efficiency.
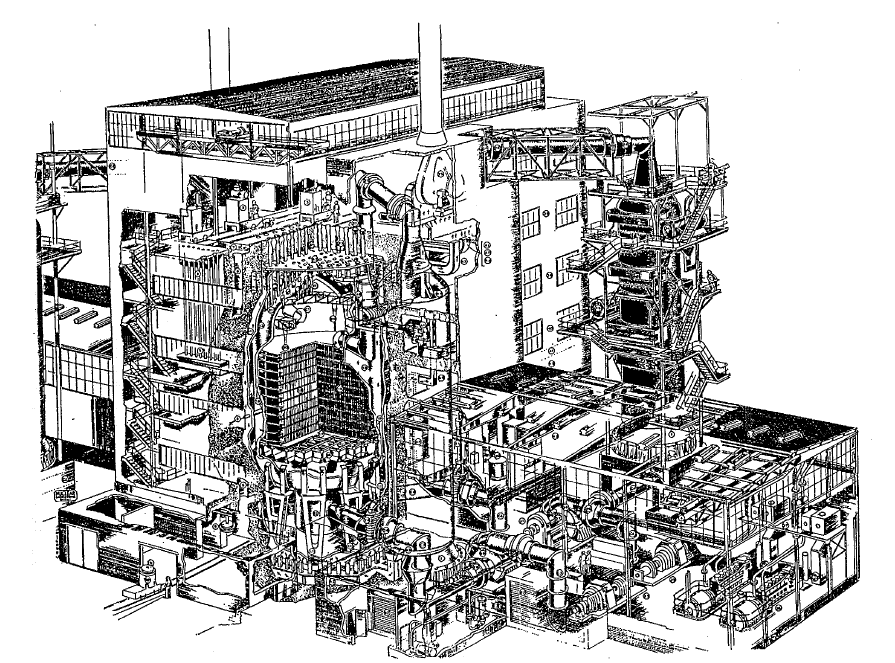
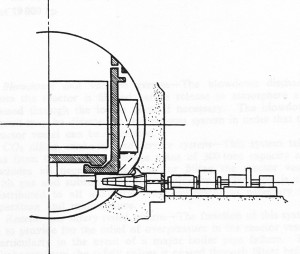
None of the Magnox reactors are enclosed in a pressure-retaining containment building, as is common practice for most other types of power reactors. In the early Magnox plants, only the reactor was inside an industrial-style building , while the steam generators and parts of the primary circuit piping were outside the building, as shown in the following diagram of a single unit at Calder Hall. The steam generators were enclosed in later plants, primarily to protect them from the weather.
Image source: NKS-2, ISBN 87-7893-050-2
Accident conditions in a Magnox reactor are very different than in a water-cooled reactor. Magnox reactors do not encounter coolant phase change during an accident or have a risk of the core becoming “uncovered” because of a loss of coolant through a breach in the primary circuit. The low core power density, the large heat capacity of the graphite moderator, and the availability of natural circulation flow paths for core cooling limit post-accident core temperatures. On this basis, Magnox reactors were permitted to operate with three barriers to the release of fission products to the atmosphere: the metal fuel matrix, the Magnox fuel cladding, and the mild steel primary circuit pressure boundary.
Export Magnox plants:
The following two single-unit Magnox nuclear power plants were exported to Italy and Japan.
Latina: Operated from 1963 to 1987; originally rated at 210 MWe, derated to 160 MWe
Tōkai 1: Operated from 1966 to 1998; 166 MWe
UK’s successor to the Magnox:
The UK’s second generation commercial power reactor is the Advanced Gas-cooled Reactor (AGR), which is a more advanced, higher-temperature, CO2-cooled, graphite moderated reactor with stainless steel clad, enriched UO2 fuel. The UK’s fleet of AGRs totals 14 units at 6 sites. All are currently operating. Retirement of the oldest units is expected to start in about 2023.
French CO2-cooled, graphite moderated reactors:
In the early 1950s, the UK and France arrived at the same basic fuel / coolant / moderator selection for their first generation power reactors:
- Natural uranium metal fuel
- CO2 coolant
- Graphite moderator
This choice was driven largely by the desire for nuclear independence and the unavailability of enriched uranium, which the U.S. refused to export, and heavy water (moderator), which was not available in significant quantities.
In France, these reactors were known as UNGG (Uranium Naturel Graphite Gaz), which were developed independently of the UK Magnox reactors. All UNGGs used magnesium-zirconium alloy fuel cladding instead of the Magnox magnesium-aluminum alloy.
The first UNGGs were the dual-use Marcoule G2 and G3 reactors, which produced nuclear material for the French nuclear weapons programs and also had a net electric power output of about 27 MWe. The horizontal reactor core was housed in a steel-lined PCRV with external steam generators.
Initial criticality of Marcoule G2 occurred on 21 July 1958, and it first generated electricity in April 1959. Marcoule G3 began operation in 1960. G2 was retired in 1980 and G3 in 1984.
Electricité de France (EDF) built six larger UNGG commercial nuclear power plants in three basic configurations:
- The early Chinon A1 and A2 plants had a vertical reactor core in a steel primary circuit. These plants had net electrical outputs of 70 MWe (A1) and 200 MWe (A2). A1 operated for 10 years from 1963 to 1973. A2 operated longer, from 1965 to 1985.
- The later 480 MWe Chinon A3 plant adopted a different design, with a vertical reactor core in a PCRV with external steam generators. A3 operated for 24 years, from 1966 to 1990.
- The 480 – 515 MWe A1 and A2 plants at Saint Laurent-des-Eaux and the 540 MWe Bugey 1 plant adopted a more advanced and compact design, with an integral primary circuit in a steel-lined PCRV. Unlike the Wylfa Magnox plant, the steam generators were placed under the reactor core in a tall PCRV, as shown in the following diagram. This basic arrangement is similar to the U.S. Fort St. Vrain helium-cooled high-temperature gas-cooled reactor (HTGR) built in the 1970s. Saint Laurent A1 operated from 1969 to 1990, A2 from 1971 to 1994, and Bugey 1 from 1972 to 1994.

Image credit: adapted from Nuclear Engineering, Feb 1968
Export UNGG:
France exported to Spain one UNGG similar to the Saint Laurent-des-Eaux plant. This became the 508 MWe Vandellos unit 1 power plant, which operated from 1972 to 1990.
French successor to the UNGG:
After Bugey 1, France abandoned gas-cooled reactor technology for commercial nuclear power plants. Pressurized water reactor (PWR) technology was chosen for the next generation of French commercial power reactors: the CP0 900 MW PWR.
North Korean CO2-cooled, graphite moderated reactor:
North Korea’s Yongbyon nuclear plant is a CO2-cooled, graphite-moderated reactor with natural uranium fuel. This is a logical choice of reactor type because natural uranium and graphite are domestically available in North Korea. Yongbyon is believed to be a dual-use production reactor that is modeled after the UK’s Calder Hall Magnox reactor.
Yongbyon is believed to have a thermal power in the 20 – 25 MWt range and a net electrical output of about 5 MWe. Reactor operation began in 1986. In 2007, operation of Yongbyon was disabled when the cooling towers were demolished to comply with an international agreement related to preventing North Korean production of nuclear material. On 2 April 2013, North Korea announced it would restart Yongbyon. NTI reported that Yongbyon has been operating since September 2013. See details at the following link:
http://www.nti.org/learn/facilities/766/

 Image source: Solar Impulse
 Image source: Solar Impulse.