All posts by Drummer

Floating Nuclear Power Plants Will be Operating at Several Sites Around the World by the End of the 2020s

Peter Lobner

1. Introduction

This post is an update and supplement to the information on floating nuclear power plants (FNPPs) in my July 2018 post, “Marine Nuclear Power: 1939 – 2018,” at the following link: https://lynceans.org/all-posts/marine-nuclear-power-1939-2018/

An FNPP is a transportable barge housing one or more nuclear power reactors that can deliver electric power and other services, such as low temperature process heat and/or desalinated water, to users at a wide variety of coastal or offshore sites. FNPPs are a zero-carbon energy solution that has particular value in remote locations where the lack of adequate electrical power and other basic services are factors limiting development and/or the quality of life.

After being manufactured in a shipyard, the completed FNPP is fueled, tested and then towed to the selected site, where a safe mooring provides the interfaces to connect to the local / regional electrical grid and other user facilities.

The US operated the first FNPP, Sturgis, in the Panama Canal from 1968 to 1975.  Sturgiswas equipped with a 45 MWt / 10 MWe Martin Marietta MH-1A pressurized water reactor (PWR) that was developed under the Army Nuclear Power Program. 

Sturgis moored in the Panama Canal. Source: Army Corps of Engg’s

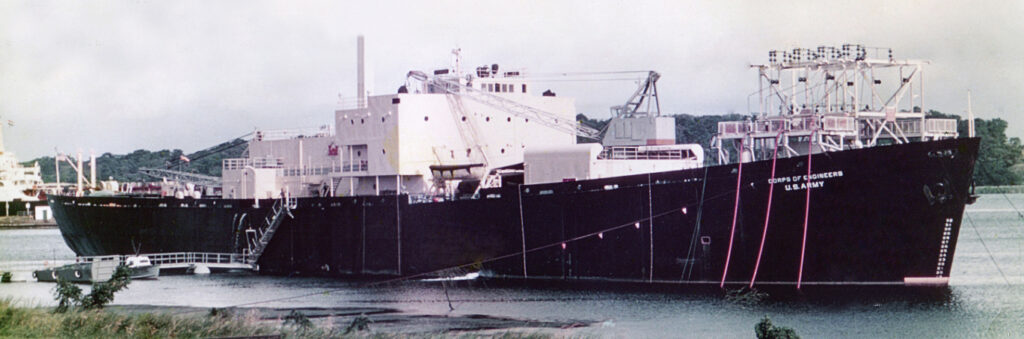
Sturgis supplied electric power to the Panama Canal Zone grid, replacing the output of Gatun Hydroelectric Plant. This allowed more water from Gatun Lake to be available to fill canal locks, enabling 2,500 more ships per year to pass through the canal. After decommissioning, dismantling was finally completed in 2019.

2. Akademik Lomonosov – The first modern FNPP

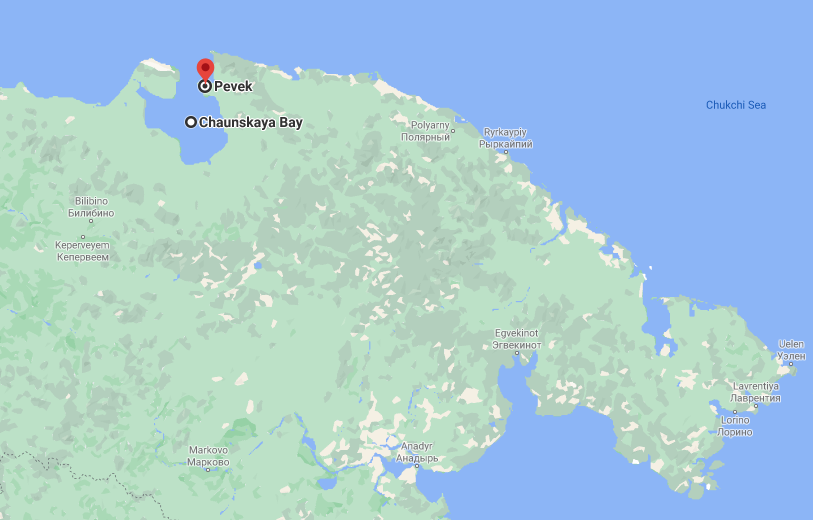
It wasn’t until 2019 that another FNPP, Russia’s Akademik Lomonosov, supplied power to a terrestrial electricity grid, 44 years after Sturgis.  The Lomonosov is a one-of-a-kind, modern FNPP designed for operation in the Arctic.  With two KLT-40S PWRs, Lomonosov supplies up to 70 MWe of electric power to the isolated Chukotka regional power grid or up to 50 Gcal/h of low temperature process heat at reduced electrical output to users in the industrial city of Pevek, near the eastern end of Russia’s Northern Sea Route. 

Akademik Lomonosov at Pevek. Source: Sputnik / Pavel Lvov

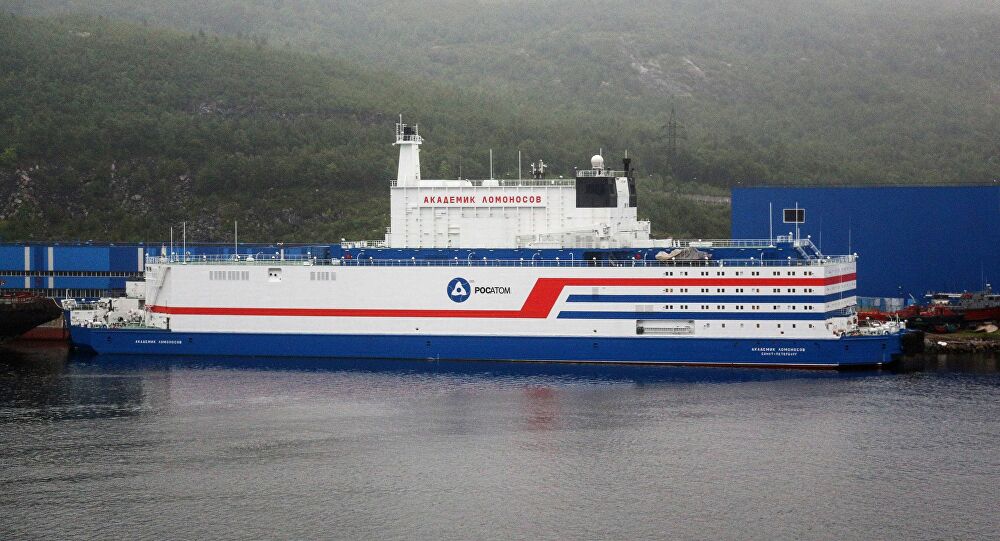
Lomonosov started providing electricity to the grid on 19 December 2019 and regular commercial operation began on 22 May 2020.

3. FNPPs under development by several nations

Several nations are developing new FNPP designs along with plans for their serial production for domestic and/or export sale.  The leading contenders are presented in the following chart. 

Floating Nuclear Power Plants in Operation & Under Development

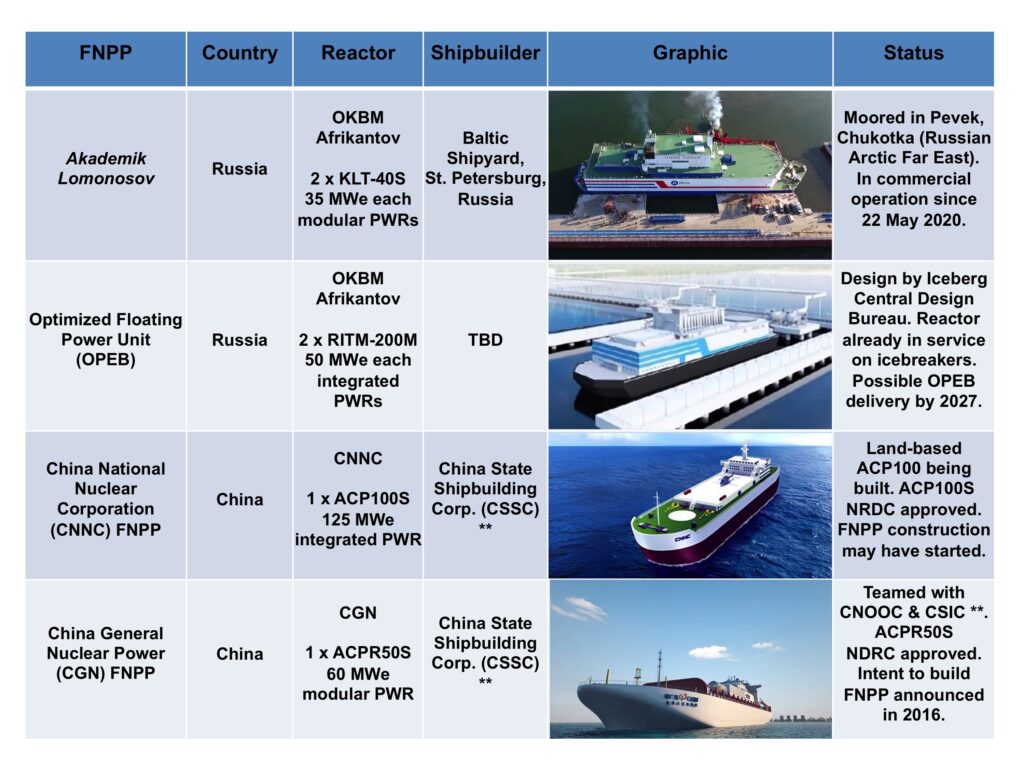
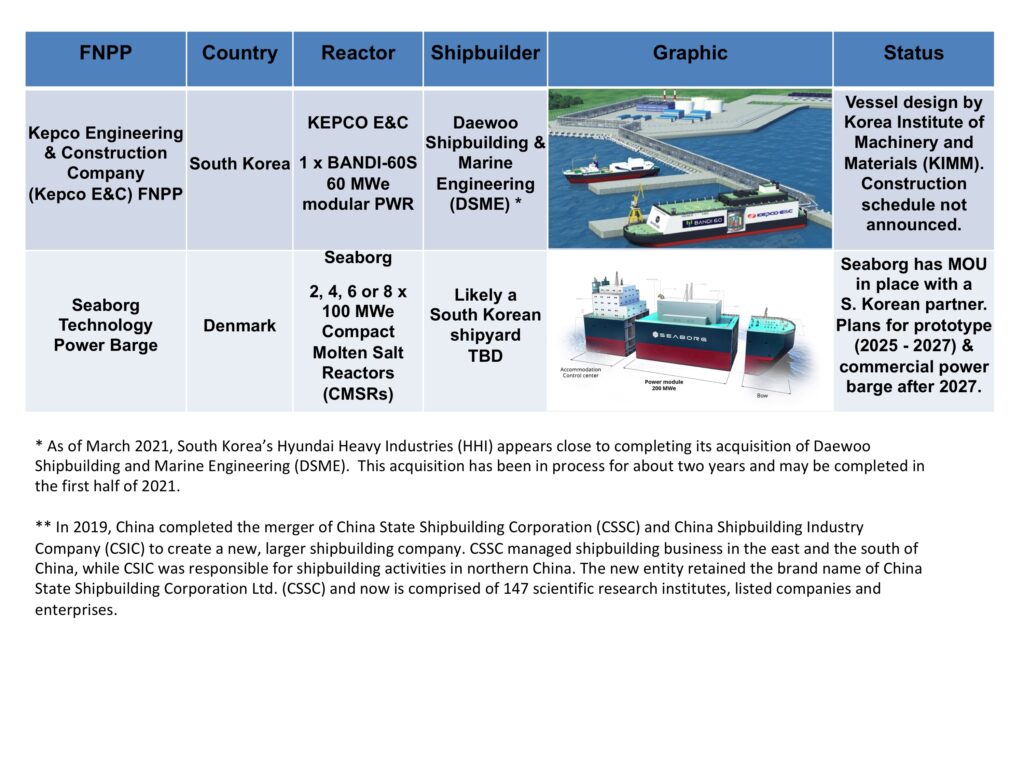
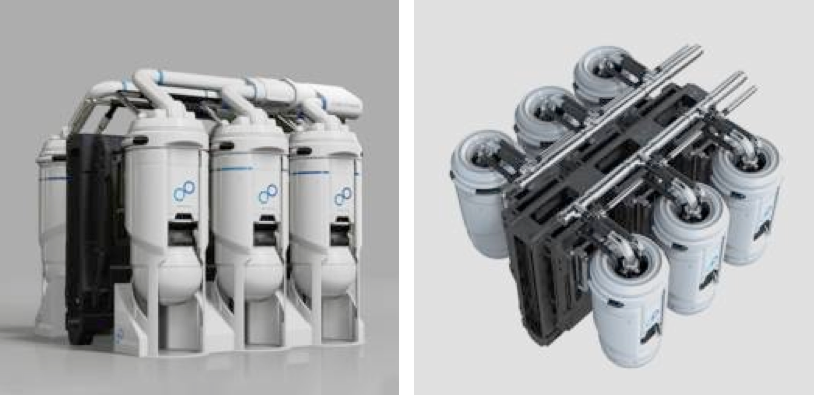
Akademik Lomonosov and the first four new FNPP designs in the above chart use small PWRs in various compact configurations. PWRs have been the dominant type of power reactor worldwide since their introduction in naval reactors and commercial power reactors in the 1950s. The Seaborg power barges will use compact molten salt reactors (CMSRs) that have functional similarities to the Molten Salt Reactor Experiment (MSRE) that was tested in the US in the early 1960s.

Russia

Russia is developing their 2nd-generation “optimized floating power unit” (OPEB) to deliver 100 MWe electric power, low temperature process heat and water desalination to support their domestic economic development in the Arctic. In November 2020, Rosatom director for development and international business, Kirill Komarov, reported that there was demand for FNPPs along the entire length of Russia’s Northern Sea Route, where a large number of projects are being planned. This was reinforced in May 2021, when Russia’s President Vladimir Putin endorsed a plan to deploy OPEBs to supply a new power line at Cape Nagloynyn, Chaunskaya Bay, to support the development of the Baimskaya copper project in Chukotka.  The development plan calls for 350 MWe of new generation from nuclear or liquid natural gas (LNG) generators.  Baimskaya currently is supplied from Pevek, where the Lomonosov is based.

Chaunskaya Bay & Pevek in Russia’s Arctic Far East. Source:  Google maps

A version of the OPEB also is intended for international export and has been designed with the flexibility to operate in hot regions of the world.  Bellona reported that “Rosatom has long claimed that unspecified governments in North Africa, the Middle East and Southeast Asia are interested in acquiring floating nuclear plants.”

China

In the 1960s, China Shipbuilding Industry Corporation (CSIC) set up the 719 Research Institute, also known as the Wuhan Second Ship Design Institute or CSIC 719, to develop applications for nuclear power technology in marine platforms. CSIC has become China’s biggest constructor of naval vessels, including nuclear submarines. 

About a decade ago, China considered importing FNPP technology from Russia.  In 2015, China’s National Development and Reform Commission (NDRC) agreed with a CSIC 719 design plan to develop an indigenous offshore marine nuclear power platform. This plan included both floating nuclear power plants and seabed-sited nuclear power plants. Today, part of this plan is being realized in the FNPP programs at China National Nuclear Corporation (CNNC) and China General Nuclear Power (CGN), two staunch competitors in China’s nuclear power business sector.

China included the development of CNNC’s 125 MWe ACP100S and CGN’s 65 MWe ACPR50S marine PWR plants in its 13th five-year plan for 2016 to 2020. The NDRC subsequently approved both marine reactor designs. 

As an example of the magnitude of China’s domestic offshore market for FNPPs, the total installed fossil fuel-powered generation in China’s offshore Bohai oilfield was estimated to be about 1,000 MWe in 2020 and growing.  Replacing just these generators and providing heating and desalination services for offshore facilities represents a near-term market for a dozen or more FNPPs.  Other domestic application include providing these same services at remote coastal sites and offshore islands. China has announced its intention to construct a batch 20 FNPPs for domestic use. The Nuclear Power Institute of China (NPIC) has recommended installing the country’s first FNPP at a coastal site on the Yellow Sea near Yantai, Shandong Province. South Korea raised its objection to this siting plan in 2019.  

Possible site for China’s first FNPP.
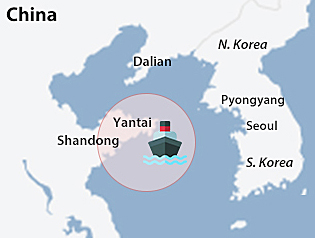
Source: Pulse (22 Mar 2019)

Other possible FNPP deployment sites may include contested islands that China has begun developing the South China Sea.  This is a very sensitive political issue that may partially account for why there has been very little recent news on the CNNC and CGN FNPP programs.  Based on their development plans discussed about five years ago, it seemed that China’s first FNPP would be completed in the early 2020s. 

In addition to their domestic applications, China has repeatedly expressed interest in selling their FNPPs to international customers.

South Korea & Denmark

In the absence of clear domestic FNPP markets in South Korea and Denmark, KEPCO E&C and Seaborg Technologies are focusing on the export market, primarily with developing nations.  

Details on modern FNPP designs 

You’ll find more details on these new FNPPs in my separate articles at the following links:

4. Maintaining FNPP fleets

All of the new FNPPs require regular reactor refueling and periodic maintenance overhauls during their long service lives.  The periodic overhauls ensure that the marine vessel, the reactor systems and ship’s systems remain in good condition for their planned service life, which could be 60 or more years.

The FNPPs with PWRs have refueling intervals ranging from about 2 years (ACP100S) to as long as 10 years (RITM-200). Some of the PWR refuelings will be conducted dockside, while others will be conducted in a shipyard during a periodic maintenance overhaul. For Russian FNPPs, such overhauls (referred to as “factory repairs”) are scheduled to occur at 12-year intervals for the Lomonosov and 20-year intervals for the OPEB.

The fundamentally different Seaborg CMSR, with molten salt fuel, is refueled regularly while the reactor is operating.  Periodic maintenance overhauls would still be expected to ensure the condition of the marine vessel, the reactor systems and ship’s systems.

With a fleet of FNPPs in service, most will be operating, while some are in the shipyard for their periodic maintenance overhauls.  In addition, new FNPPs would be entering service periodically. When it is time to service an FNPP in a shipyard, it will be replaced by a different (existing or new) FNPP that is brought in to take its place.

At the end of its service life, an FNPP will be returned to a shipyard to be decommissioned, decontaminated and then dismantled, like Sturgis. Russia already has established special long-term spent fuel and radioactive waste storage facilities in mainland Russia. China, South Korea and Denmark will need to make similar provisions for the end-of-life processing and safe disposition of their retired FNPPs.

5. Economic issues

In March 2019, Jim Green wrote on what he called “the questionable economics of SMRs” in his article, “An obituary for small modular reactors.” One of his conclusions was that, “…in truth there is no market for SMRs.”  Another conclusion was that “No-one wants to pay for SMRs. No company, utility, consortium or national government is seriously considering building the massive supply chain that is at the very essence of the concept of SMRs ‒ mass, modular factory construction. Yet without that supply chain, SMRs will be expensive curiosities.” 

I might agree that this could be the case for land-based SMRs, but marine FNPPs are a different matter.  In remote areas being considered for FNPP deployment, there probably are fewer energy options, energy price competition is a lesser concern, and an extended fuel supply chain is undesirable or impractical. Examples include FNPP applications supporting resource development along Russia’s Northern Sea Route and in China’s offshore waters.  The domestic markets in both nations probably can support production runs of 10s of FNPPs.  While this isn’t “mass production” in the sense of many heavy industries, it would certainly be a big enough production run to change the manufacturing paradigm in the marine nuclear industry and provide a real validation of the economics of SMRs.

6. International nuclear regulatory / legal / political issues

Deployment of the first modern FNPP, the Akademik Lomonosov, in the Arctic was accomplished under Russian domestic nuclear laws and regulations and, after the reactors were fueled, the transit to its destination was accomplished within Russian territorial waters. The final destination, Pevek, is about 980 km (609 miles) from the Bering Strait and the nearest international boundary.  Not without controversy, particularly among Scandinavian nations, Lomonosov’s deployment was straightforward after the vessel completed all stages of licensing and regulatory reviews required in Russia.  Now Lomonosov has been commissioned and is setting an example for the rest of the world by operating successfully in a remote Arctic port.

Except for Russia’s nuclear-powered icebreaking vessels, there have been no other civilian nuclear vessels in service since Japan’s Mutsu retired in 1992. For almost 30 years, there has been no need to establish and maintain a comprehensive international civilian nuclear vessel regulatory and legal framework. 

In her August 2020 article, “Legal framework for nuclear ships,” Iris Bjelica Vlajić reports that the main international documents regulating the use of civil nuclear ships are:

  • UN Convention on the Law of the Sea (UNCLOS)
  • IMO Convention for the Safety of Life at Sea (SOLAS)
  • IMO Convention on The Liability of Operators of Nuclear Ships and the Code of Safety for Nuclear Merchant Ships

Further FNPP deployment along Russia’s arctic coast and initial FNPP deployment in China’s territorial coastal waters can be accomplished under the respective nation’s domestic nuclear laws and regulations.  It’s easy to imagine that a range of international issues will arise as FNPP deployment becomes more widespread, in situations like the following

  • An FNPP is deployed to a site close to an international border.
  • An FNPP is deployed in a sensitive international ecosystem.
  • A fueled FNPP from any nation needs to transit an international strait or an exclusive economic zone (EEZ) of another nation enroute to its destination.
  • An FNPP is deployed to an island that is contested by one or more other nations (i.e., several islands and island groups in the South China Sea).

There has been speculation recently that the sensitivity of the last issue, above, may be contributing to increased secrecy in the last couple of years related to China’s FNPP programs.

As FNPP deployment expands, the international community will be playing catch-up as the UN, IMO, IAEA and others contribute to developing a modern nuclear regulatory and legal framework for FNPPs.

7. Conclusions

In the next decade, I think it’s very likely that two or more of the new FNPP designs will enter service.  The leading contenders seem to be Russia’s OPEB and China’s ACP100S FNPP.   It remains to be seen if economic issues and/or international nuclear regulatory / legal / political issues will stand in the way of eventual FNPP deployments to sites around the world.  

8. For more information

General

US – Sturgis

Russia

China

South Korea

Denmark – Seaborg

Other

Other FNPP designs and concepts for “transportable reactor units” (only the nuclear steam supply section of an FNPP) and seabed-sited nuclear power plants are included in my 2018 post: “Marine Nuclear Power: 1939 – 2018:” https://lynceans.org/all-posts/marine-nuclear-power-1939-2018/

The Sad Tale of New York’s “Greener Grid” and the Closure of Two Nuclear Power Plants

Peter Lobner, updated 29 July 2022

Goodbye Indian Point 2 and 3.  Your contributions of zero-carbon energy to New York’s “clean energy grid of the future” will be greatly missed.

In an average year, the 1,028-MWe Indian Point Unit 2 nuclear power plant and the 1,041-MWe Unit 3 operated at capacity factors of greater than 90% and delivered more than 18,000 GWh (thousand MWh) per year of zero-carbon electricity to the New York state electrical grid. Unit 2 was shutdown on 30 April 2020 and Unit 3 followed on 30 April 2021.  Prior to its final shutdown, Unit 3 had run continuously for 753 day, which set a new nuclear industry world record.  The ANS Newswire reported, “The plant’s closure is the result of a settlement agreement reached in 2017 by Entergy and the State of New York and environmental groups opposed to Indian Point’s operation. According to an April 28 (2021) news release from Entergy, its decision to accede to the shutdown was driven by a number of factors, including ‘sustained low current and projected wholesale energy prices that reduced revenues.’”

Now, Indian Point Units 2 and 3 are delivering exactly zero zero-carbon energy.  I imagine the environmental groups involved in the settlement agreement are hailing the shutdowns as great achievements.  I think the shutdowns represent remarkable shortsightedness (I’m using the kindest words I can think of) on the parts of Entergy and the State of New York.

New York Independent System Operator, Inc. (NYISO) operates the New York state electrical grid, which is divided into two main parts, “downstate”, which includes New York City and the Indian Point Units 2 and 3 nuclear power plants, and “upstate,” which includes the Nine Mile Point and Ginna nuclear power plants. I credit NYISO with providing the public with excellent reports that summarize their annual grid and electrical market performance.  In their Power Trends 2021 report, NYISO states: “The NYISO is committed to offering the tools, skills, independent perspectives, and experience necessary to transition to a zero-emission power system by 2040.” 

I’ll refer to two of those NYISO Power Trend reports to illustrate the impact of closing the Indian Point 2 and 3 nuclear power plants on progress toward New York’s “clean energy grid of the future.”  Using their own graphics, let’s take a look at how NYISO was doing in 2019 (with both Indian Point Unit 2 & 3 operating), 2020 (Unit 2 shutdown in April), and their projected performance in summer 2021 (after Unit 3 shutdown). 


2019:  New York statewide: 58% zero-emission; Upstate: 88% zero-emission; Downstate: 29% zero-emission

Source: NYISO Power Trends 2020

2020:  New York statewide: 55% zero-emission; Upstate: 90% zero-emission; Downstate: 21% zero-emission

Source: NYISO Power Trends 2021

2021:  New York statewide (projected, summer): 25% zero-emission; Upstate: 67% zero-emission; Downstate: 2% zero-emission

Source: NYISO Power Trends 2021

Anyone who can draw a tend chart from 2019 to 2021 using the above three years of data and then extrapolate to the State’s goal of a zero-emission power system by 2040 can see that New York’s plans for its “clean energy grid of the future” have come off the rails.  The slope of the curve to get from where NYISO is today to the State’s 2040 goal has gotten a lot steeper, and that translates directly into the cost of achieving that goal.  Surely the New York ratepayers served by NYISO will pay the price in the years ahead as the State works to improve its zero-emission performance. Even getting back to where they were in 2019 would be a big improvement.

So, I reiterate that the Indian Point Unit 2 and 3 shutdowns represent remarkable shortsightedness on the parts of Entergy and the State of New York, both of which have undervalued two reliable sources of bulk zero-emission electric power generation, and have failed to appreciate Indian Point’s potential long-term contribution to achieving the State’s 2040 zero-emission power system goal (at a rate of more than 18,000 GWh per year).  New York State has failed to step up and provide economic incentives to enable Entergy to compete effectively against fossil fuel generators that have been benefiting for more than a decade from the low cost of natural gas fuel. In the wholesale market, the fossil generators can undercut nuclear generators and drive the cost of electricity down to levels that no longer support the continued operation of zero-emission nuclear power plants.  These trends can be seen in the following NYISO chart.

Source: NYISO Power Trends 2021

Beyond the significant loss of zero-carbon electrical generation capacity, the closure of a nuclear power plant will have significant local and statewide impacts through the loss of many full-time and temporary jobs, associated wages, and income and property taxes.  You’ll find a thorough discussion of these issues in the May 2021 ANS Nuclear Newswire article, “The consequences of closure: The local cost of shutting down a nuclear power plant,” at the following link: https://www.ans.org/news/article-2877/the-consequences-of-closure-the-local-cost-of-shutting-down-a-nuclear-power-plant/

R.I.P. Indian Point Units 2 and 3.

Update – 29 July 2022

In July 2022, the American Nuclear Society reported, “Stats show that closing Indian Point was a ‘mistake’ for New York.”  I’d say that’s putting it mildly.

For more information:

New Grid-scale Energy Storage Alternatives to Batteries

Peter Lobner

1. Introduction

As the world generates an increasing fraction of its electricity from intermittent renewable energy sources, there currently are growing problems with grid stability and there will be problems delivering electric power on demand 24/7 unless the huge swings in intermittent renewable generating capacity are brought under control.

The nature of the intermittent photovoltaic (PV) energy generation problem is described in a 2020 paper by Alberto Boretti, et al., in which the authors note, “Because of increasing uptake (of electricity) and the phasing out of back-up conventional power plants producing energy on demand, there is the necessity to study the current variability of the (PV) capacity factors based on the actual energy production.”  The authors concluded, “While the best-performing (PV) facilities achieve annual capacity factors of about 32-33%, the average annual capacity factor is less than 30%, at about 26-27%.”

During the course of an average day, PV generation can go from 0% at night to 100% at mid-day, with “tails” as generation capacity grows in the morning and falls off in the evening, and variability during the day due to weather.  Using Australian high-frequency capacity factor data (because similar data were unavailable in the US), Alberto Boretti, et al., developed the following chart that compiles the capacity factors from many individual PV plants and computes their average capacity factor (the dark line in the top chart), which is a measure of the average PV generating capacity actually delivered to the grid over the course of a 24 hour period.

The second chart shown below shows the actual load demand in megawatts (MW) from the California grid operator, CAISO, for 18 August 2020, a hot day with high load demand.  The broad (5-hour) peak mid-day demand on the CAISO grid was about 47,000 MW.  Minimum demand at about 4 AM was about 27,000 MW.

Comparison of a representative PV generation cycle & grid demand cycle.
Sources: (Top) adapted from Alberto Boretti, et al. (2020),
(Bottom): CAISO via GreenTechMedia (19 Aug 2020)

Hopefully, you see the problem.  In this case for PV generation, the generation cycle is not in sync with the demand cycle.  If states and nations are unwilling to address this mismatch with reliable generators that can be started on demand, then large-scale deployment of long-duration, grid-scale energy storage systems will be needed to meet electricity demand 24/7. 

What do “long duration” and “grid-scale” mean?  Look at the above curves and you can see the answers for yourself.  How long is there no PV generation between sunset and sunrise?  It’s 10 to 14 hours in Southern California, depending on the time of year.  How much is 10% of peak demand on the CAISO grid?  On 18 August 2020, that would have been about 4,700 MW, about the generating capacity for four nuclear power plants (but California only has two nuclear power plants, and those will be retired in 2024 and 2025).  My point is that even 10% of peak demand is a big number and to store just one hour of that requires 4,700 MWh (megawatt-hours) of storage.  The numbers only get bigger as you look at the amount of energy storage needed to meet demand for several hours, or over night. 

To establish a point of reference regarding grid-scale energy storage capacity, here are a few important points.

  • California has a goal of having an energy generation portfolio with 60% renewable generation sources by 2030.  That equates to a renewable generating capacity of up to 28,000 MW during the broad mid-day peak demand period on a hot day.
  • California has a goal of having 10,000 MW of “energy storage” by 2030, but they haven’t defined the needed storage capacity in terms of MWh.  Most of the battery energy storage systems (BESS) delivered to date in California can operate at rated power for only 1 – 2 hours.  That can help reduce short-term power peaking problems during the day, but is not useful for long-term power delivery at night.
  • The Gateway Energy Storage project in San Diego County, CA, currently the largest BESS in the world. It is rated a 250 MW with an energy storage capacity of about 250 MWh.  That will supply about 0.5% of CAISO’s peak grid demand for less than one hour because the battery can’t be fully discharged.  In terms of grid-scale energy storage requirements, this “world’s largest energy storage project” is still pretty small.  It represents less than 10% of the output of the Diablo Canyon nuclear power plant for one hour, after which the BESS would be exhausted while Diablo Canyon would continue delivering electricity for the remaining 23 hours of the day, generating about 54,000 MWh per day with zero carbon emissions, day after day. 

An approach for using energy storage systems to help meet daily peak load demand is shown in the following graphs, with energy storage from online power generators early in the day (blue) and stored energy dispatch (orange) later in the day to supplement online power generators and reduce the peak generation demand.  In the top curve, the online power generators need to follow the load profile curve between the lower and upper limits set by the “energy storage” and “energy usage”  horizontal lines. With more energy storage capacity, the second graph illustrates the case of constant online generation capacity (the single horizontal line), with all demand variability being absorbed by charging and discharging energy storage systems.

Examples of daily load leveling using electrical energy storage systems to absorb variability in demand (more storage available in the bottom graph)
Source, both graphics: Siraj Sabihuddin, et.al. (2014)

As electric vehicles proliferate, the peak of the demand curve will likely continue longer into the evening and night as commercial and private vehicles are recharged.  The mismatch between the generation cycle of intermittent PV energy sources and the demand curve will be getting larger.

In this post, we’ll take a look two technologies for long-duration, grid-scale energy storage systems:

  • Advanced compressed air energy storage (A-CAES)
  • Solid medium gravity energy storage

Both of these energy storage systems convert electrical energy into potential energy that can be released on demand, for example, as high-pressure air or a large suspended weight.  As you might expect, these are not “perpetual motion” systems and energy is consumed with each energy storage and discharge cycle.  That means that less electricity can be dispatched than was originally input for storage.  High cycle efficiency becomes a very important performance parameter for energy storage systems. Manchester University, UK, reported on a BESS that had round-trip energy losses between 9.6% and 12.5% for a variety of full charge / discharge cycles, placing BESS cycle efficiency at between 87.5% and 90.4%. 

The A-CAES and solid medium gravity energy storage technologies appear to have long operating lifetimes, which could give them an advantage over battery energy storage systems. The National Renewable Energy Laboratory (NREL) has determined that current technology lithium-ion battery life in BESS applications is limited to about 10 years with active thermal management and restricted cycling, and about 7 years without thermal management.  Over the operating life of a grid-scale BESS, the batteries will have to be replaced periodically, adding to BESS life-cycle cost.

Keep in mind why these energy storage systems are needed.  Going “green” is not simple, and relying on power generation from intermittent renewable energy sources comes with the obligation to deploy long-duration, grid-scale energy storage systems to ensure that electricity demand can be met 24/7.  Rest assured, this will all show up on your future electricity bills.

2. Advanced compressed air energy storage (A-CAES)

Toronto-based Hydrostor (https://www.hydrostor.ca/company/) is a leading developer of Advanced Compressed Air Energy Storage (A-CAES) systems.  Their first system entered service in 2019.  Several other A-CAES systems are being developed.

The basic A-CAES process is shown in the following diagram.

A-CAES process flow. Source: Hydrostor.

Surplus electric generating capacity is used to compress ambient air to produce heated compressed air. A thermal management system captures and stores the heat produced during compression as sensible heat. The cooled, compressed air is stored in a purpose-built underground storage cavern that is maintained at constant pressure by the hydrostatic head of water in a standpipe connected to a compensation reservoir on the surface.  As the storage cavern is charged, water in the cavern is displaced and flows up the standpipe, into the compensation reservoir.

When there is a demand for energy from the storage system, compressed air is released from the underground air storage cavern, reheated by the thermal management system and discharged through an air turbine to generate electricity.  Water flows back from the compensation reservoir on the surface into the storage cavern to maintain the pressure of the air remaining in storage.

A representative Hydrostor installation showing the purpose-built underground air storage cavern and its bi-directional interfaces with the compressed air system (purple line) and the hydrostatic compensation reservoir on the surface (blue line).
Source: Hydrostor
General arrangement of the aboveground facilities of a representative A-CAES facility. 
Source: Adapted from Hydrostor

This A-CAES process is entirely fuel-free and produces zero greenhouse gas emissions.  The operation of the Hydorstor system is explained in the 2021 video, “How Hydrostor Is Enabling The Energy Transition” (3:54 minutes) at the following link: https://www.youtube.com/watch?v=cOWjwwKSR78

Hydrostor’s Goderich A-CAES Facility

The Goderich A-CAES Facility, which went into service in 2019 in Goderich, Ontario, Canada, is the world’s first commercially contracted A-CAES facility.  It is in regular service on Ontario’s Independent Electricity System Operator (IESO) grid.  

This utility-scale system can deliver a peak power output of 1.75 MW, has a maximum charge rate of 2.2 MW, and has more than 10 MWh of energy storage capacity.  The system can deliver rated power for 5 to 6 hours.

Hydrostor notes that this use of A-CAES technology “is a significant achievement, conforming to all interconnection, uptime, performance and dispatch standards as set out by the IESO.  Hydrostor’s Goderich energy storage facility proves out the ability of Hydrostor’s A-CAES technology to fully participate in and deliver a range of valuable grid services to electricity markets.”

More information on the Goderich A-CAES Facility is available here:  https://www.hydrostor.ca/goderich-a-caes-facility/

The aboveground portion of the Goderich A-CAES Facility. Source: Hydrostor

Rosamond Energy Storage Project 

Hydrostor, with partners Pattern Development and Meridiam, is developing the much larger Rosamond Energy Storage Project in Kern County, CA.  This A-CAES project will have a rated power of 500 MW and an energy storage capacity of 4,000 MWh, which will provide for 8 hours of operation at rated power.  This project was announced on 29 April 2021 and is expected to enter service in 2026.  Customers would include the Los Angeles Department of Water and Power and the operator of the state power grid, CAISO.

More information on the Rosamond Energy Storage Project is available here: http://www.hydrostor.ca/rosamond/

3. Solid medium gravity energy storage systems

Pumped storage hydroelectric (PSH) is a type of gravity energy storage system that has been in existence for many decades.  Such systems are dependent on regional topography with a suitable water source in proximity to a suitable elevated water storage basin.  Surplus electric power is used to pump a large volume of water up to the elevated storage basin. Later, water is released through a penstock to a hydroelectric turbine to generate electricity on demand. Among current energy storage technologies, the Electric Power Research Institute (EPRI) rates PSH highest as a long-duration, grid-scale energy storage system. General Electric reports that the round-trip energy efficiency of PSH typically is about 80%.

The solid medium energy storage systems work on a similar principle of using surplus power to raise a solid mass to a relatively high elevation and later release the suspended mass and use it to mechanically drive a generator during its controlled descent.  Two firms working on this type of gravity energy storage system are Energy Vault and Gravitricity.  Unlike PSH, their gravity energy storage systems are not dependent on the local topography.  Here’s a brief look at their systems.

Energy Vault

California-based startup incubator Idealab (https://www.idealab.com), developed an energy storage concept that uses a tall tower topped with tower cranes as a platform for systematically building and deconstructing stacks of regularly shaped heavy masses (bricks).  Potential energy is stored as bricks are raised and emplaced at a higher elevation.  Energy is recovered when a brick at a higher elevation is picked up and lowered while using the suspended mass to drive a generator, a bit like the regenerative braking system on a Toyota Prius.  With multiple cranes in use to move the bricks, energy storage and discharge rates can be adjusted to match operational needs until the stack of bricks is completely constructed (fully charged) or deconstructed (discharged). The Swiss firm Energy Vault (https://energyvault.com) is commercializing this gravity energy storage technology.

 (L to R) Deconstructing an Energy Vault tower to recover energy.
Source: Business Wire

You can watch a 2019 Energy Vault video simulation here: https://vimeo.com/335818817

In partnership with Italian energy company ENEL, Energy Vault built a sub-scale demonstration system in Ticino, Switzerland and has operated the system connected to the regional grid since July 2020. 

Energy Vault’s demonstration system in Ticino, Switzerland.  Source: Energy Vault

The 110 meter (361 ft) tall unit can store 35 MWh of energy.Energy Vault reported that, from proposition to working prototype, the demonstration system took about nine months to complete and cost less than US $2 million.  

Energy Vault’s demonstration system in Ticino, Switzerland, 
not including the 35 metric ton bricks. Source: Energy Vault

Lessons learned from the demonstration unit include:

  • A tower can be erected quickly; the cranes can be delivered within months and erected within weeks.
  • The heavy masses (35 ton composite bricks) can be made from a variety of  materials, including concrete construction debris that would otherwise go to a landfill. At a coal plant site, the bricks could be made with coal ash aggregate.  
  • The mechanical systems do not degrade, providing a long operating life of the project.
  • Specially engineered control software ensures the bricks are placed in exactly the right location each time.
  • Round-trip cycle efficiency is between 80% and 90%.

Energy Vault claims that they have created the world’s only cost-effective, utility-scale gravity-based energy storage system that is not dependent on land topography or specific geology underground.

With its modular, scalable system design, Energy Vault expects to offer energy storage systems with a range of power ratings, from 4 to 8 MW, and energy storage capacities, from 20 to 80 MWh.  These systems can serve as long-duration power sources, delivering rated power for hours.

Gravitricity

Scottish firm Gravitricity Ltd. (https://gravitricity.com) is developing a novel mechanical energy storage technology in which excess electric power is used to power winches that raise a heavy mass inside a deep shaft.  At its new, higher elevation, potential energy has been stored in the heavy mass. Electricity is generated when needed by releasing the heavy mass and allowing it to drop under the influence of gravity, but restrained by a braking system that extracts kinetic energy as electricity until the heavy mass makes a controlled stop at the bottom of the shaft, or at some intermediate height.

You’ll find a short (3:42 minutes) 2020 animated video describing the Gravitricity energy storage technology here:  https://www.youtube.com/watch?v=meFkbADJq28

To demonstrate this technology, Gravitricity constructed a 15-meter (49-foot) tall test rig at a cost of £1 million (US $1.4 million) at the Port of Leith in Edinburgh, Scotland. 

Test rig schematic drawing. Source: Gravitricity
The actual test rig. Source: Gravitricity

This 250 kW concept demonstrator uses two 25-metric ton (27.5-ton) weights suspended by steel cables connected to two winches. With a 7-meter (23-ft) lift, this demonstration system should be able to store almost 1.0 kWh of energy. After being released at the top of the tower, the two weights discharge their stored energy via a regenerative braking system for little more than 10 seconds. While the test duration is short, it is sufficient to demonstrate that the concept works. Moreover, the demonstrator is being used to validate engineering simulations that will be used in the design of a full-scale system.

Gravitricity plans to offer systems in the 1 MW to 20 MW power range with output durations from 15 minutes to 8 hours.  Key operating parameters are:

  • Flexible, controllable power output and total energy delivered. 
  • Response time: zero to full power in less than one second.
  • Cycle efficiency: between 80% and 90%
  • Design life: 50-years, with no cycle limit or degradation

A single mass system is well suited for applications that require high power quickly and for a short duration. 

Concept for a single-weight energy storage system.
Source: Gravitricity

Multiple-weight systems are better suited to storing more energy and releasing power over a longer period.

Concept for a multiple-weight energy storage system.
Source: Gravitricity

A full-scale system will be designed to operate in retired (end-of-life) mine shafts or purpose-built deep shafts rather than in tall towers. In the UK, some potentially suitable mines have end-of-life shafts that go to depths of 750 m (2,461 ft).  Deep shafts specifically built for the job could have a depth in excess of 2 km (1.2 miles).  Masses up to 12,000 metric tons / 13,200 tons may be used.

The energy storage capacity of a Gravitricity system can be quite significant.  For example:

  • A 12,000 metric ton mass suspended at the top of a 750 m deep mineshaft has a potential energy of about 24.5 MWh.
  • The same 12,000 metric ton mass suspended at the top of a 2 km purpose-built deep shaft has a potential energy of about 65.3 MWh.

Gravitricity reports that they currently are developing a number of project opportunities at existing mines with end-of-life shafts that are suitable for full-scale prototype energy storage systems.  Candidate end-of-life shafts have been identified in the UK, the Moravian Silesian Region of Czech Republic and adjacent areas in Poland, and in South Africa.  Gravitricity estimates that over 10,000 MWh of energy storage capacity can be deployed globally in existing end-of-life mine shafts.

In the longer term, Gravitricity plans to sink purpose-built shafts, allowing their energy storage technology to be deployed wherever it is required.  Multiple, purpose-built shafts can be built in the same area to scale the total energy storage capacity to meet user requirements.

Gravitricity expects that their system will have a levelized cost of storage (cost/MWh) that is significantly less than for  lithium-ion battery energy storage systems

4. For more information

Need for grid-scale energy storage:

Advanced compressed air energy storage (A-CAES):

Solid medium gravity energy storage:

A Trend of Increasing Neutron Count Rates Detected at Chernobyl

Peter Lobner

The accident at Chernobyl Unit 4 occurred on 26 April 1986.  A post-accident view of the Unit 4 reactor building is shown below.

Post-accident west-east building cross-section of Chernobyl Unit 4. 
Source: G.G. Pretzsch, et al. (2002)

A temporary “sarcophagus” was hastily erected around Unit 4 to provide some protection for the recovery workers and the public, to stabilize the damaged building and protect its interior from the effects of weather.  Since November 2016, Unit 4 has been fully enclosed within the more substantial New Safe Confinement (NSC) building.  You’ll find a good overview of the NSC at the Chernobyl Gallery website here:  http://www.chernobylgallery.com/chernobyl-disaster/new-safe-confinement/

On 5 May 2021, Richard Stone, writing for Science magazine, reported online that, “Sensors are tracking a rising number of neutrons, a signal of fission, streaming from one inaccessible room, Anatolii Doroshenko of the Institute for Safety Problems of Nuclear Power Plants (ISPNPP) in Kyiv, Ukraine, reported last week during discussions about dismantling the reactor..….ever since its (the NSC) emplacement, neutron counts in most areas in the Shelter have been stable or are declining. But they began to edge up in a few spots, nearly doubling over 4 years in room 305/2, which contains tons of FCMs (fuel containing material) buried under debris.” Modeling by the ISPNPP suggests that the increasing neutron count rates may be related to the gradual drying of the FCMs.  Other phenomena may be contributing, such as the observed long-term disintegration and change of consistency of some FCM formations in the rubble.

The ceiling of room 305/2 was directly under the Unit 4 reactor core.  From the force of the accident, that ceiling was driven down by almost four meters.

The original inventory of uranium in the Unit 4 core was about 180 metric tons enriched to 3%. In a French-German study of the condition of the Chernobyl sarcophagus, authors G.G. Pretzsch, et al. reported that about 96% of the original nuclear fuel inventory remained inside the sarcophagus.  The distribution was estimated as summarized in the following table.  The authors estimated that about one-half of the total fuel mass was in Room 305/2. 

Post-accident estimated distribution of fuel masses at
Chernobyl Unit 4. Source: G.G. Pretzsch, et al. (2002)

The condition of room 305/2 is described in considerable detail (in Russian) in the 1998 IAEA Report INIS-UA—062, “Room 305/2 Block 4 of the Chernobyl NPP: Its Condition, Assessment of the Amount of Fuel.”  The room is a jumble of damaged building structural elements, reactor parts, and FCM in various forms, including “lava” flows.

Physical model of sub-reactor room 305/2. 
Source: A.A. Borovov, et al. (1998)

The authors reported on estimates developed using a variety of methods, as summarized in the following table, and concluded that the best estimate for room 305/2 was ≥ 60 metric tons of uranium.

Estimates of the amount of fuel material in sub-reactor room 305/2. 
Source: A.A. Borovov, et al. (1998)

You’ll find my machine translation of this IAEA report to English, including the legend for the above figure, at the following link: https://lynceans.org/wp-content/uploads/2021/05/Chernobyl-Room-305_2-Assessment.pdf

Ukraine has long intended to remove the FCMs from the Unit 4 debris and store them in a geological repository. This plan remains under development, but now may have a new sense of urgency.

For more information

The Giant Air-Launch Mothership, Roc, Makes its Second Flight

Peter Lobner

After Paul Allen’s death on 15 October 2018, the Stratolaunch Systems company he founded lost the broad air launch business vision it had under his leadership. A year later, on October 2019, the private equity firm Cerberus Capital Management became the new owner of the firm renamed Stratolaunch, LLC.  Another year later, in November 2021, Stratolaunch LLC announced its new air launch business vision with an initial focus on missions involving a prototype reusable hypersonic rocket plane called the Talon-A. Stratolaunch has engaged the aerospace firm Calspan (https://www.calspan.com/stratolaunch-testing/) to build and test models of the Talon-A.  As described on the Stratolaunch LLC website (https://www.stratolaunch.com), Talon-A is only the first of a family of air-launched vehicles that will be developed to establish “a complete air-launch vehicle ecosystem.”  It looks like Paul Allen’s broad air launch business vision still may be alive and well under new leadership.

In an important milestone for Stratolaunch LLC, their giant carrier aircraft, Roc, returned to the air for the second time from the Mojave Air and Space Port in southern California on 29 April 2021, more than two years after its first flight on 13 April 2019.

Stratolaunch’s Roc carrier plane during its second test flight
on 29 April 2021.  Source: Stratolaunch
Stratolaunch’s Roc carrier plane during its second test flight
on 29 April 2021.  Source: Stratolaunch
The Roc on its landing approach at Mojave Air and Space Port at the end of its second flight. Source: AP Photo/Matt Hartman

During its second flight on 29 April 2021, the Roc reached a maximum altitude of 14,000 feet (4,267 m) and a top speed of 199 mph (320 kph).  The 28-wheel undercarriage remained extended for the whole flight.

At some point in the future, the Roc carrier aircraft test flight program will transition to captive carry flights with a Talon-A vehicle, followed by drop tests and finally actual flight tests of the hypersonic vehicle.  

Stratolaunch explains that its Mach 6-class Talon-A vehicle is designed to make hypersonic testing more routine. They describe the Talon-A as follows:

“The Talon-A features a length of 28 feet (8.5 m), a wingspan of 11.3 feet (3.4 m), and a launch weight of approximately 6,000 pounds (2,722 Kg). It will conduct long duration flight at high Mach, and glide back for an autonomous, horizontal landing on a conventional runway. It will also be capable of autonomous takeoff, under its own power, via a conventional runway.”

Rendering of the Mach-6 Talon-A hypersonic vehicle in flight. 
Source: Stratolaunch

Beyond Talon-A, Stratolaunch is developing a larger hypersonic vehicle named Talon-Z.  A longer-term objective is to develop the Black Ice fully reusable space plane that will be able to fly payloads and crew to orbit and return them to Earth for a landing at a conventional airport. The initial design will be optimized for unmanned cargo launch and return missions. A follow-on manned version will be optimized for transporting crews and cargo to and from orbit. 

Stratolaunch’s planned family of aerospace vehicles is shown in the following graphic.

The Stratolaunch carrier vehicle, Roc, is shown with three hypersonic vehicles ready for launch.  Below (L to R) are the Talon-Z and Talon-A hypersonic vehicles and the
Black Ice orbital space plane.  Source: Stratolaunch

If you’re interested, you can subscribe to the Stratolaunch newsletter on their website.

For more information:

Anti-Stars and Anti-Star Clusters May be Hiding in Plain Sight

Peter Lobner

It is generally assumed that all of the observable objects in our universe in composed of ordinary matter.  The rationale for this assumption if explained in a 1999 Scientific American article by Steve Naftilan: https://www.scientificamerican.com/article/how-do-we-know-that-dista/

In most of the electromagnetic spectrum, a star composed of normal matter and a star composed of antimatter (anti-star) will look the same to an observer on Earth. Their visible spectra will be indistinguishable. A key difference in behavior may be observable in the gamma ray spectrum, where high-energy gamma rays characteristic of matter-antimatter annihilation (i.e., baryon-antibaryon reactions) may reveal the identity of an antimatter star within our galaxy or an antimatter star cluster outside our galaxy.  Luigi Foschini provides a good introduction to this subject in his 2000 paper at the following link: https://cds.cern.ch/record/447091/files/0007180.pdf

NASA’s Alpha Magnetic Spectrometer (AMS) has developed into an important tool in the search for anti-stars. The prototype, AMS-01 flew on the STS-91 Space Shuttle mission from 2 to 12 June 1998 and was successfully tested in orbit. The full-scale AMS-2 was launched aboard the STS-134 Space Shuttle mission on 16 May 2011. Since it was installed on the International Space Station (ISS) and activated on 19 May 2011, this 18,739 pound (8,500 kg), 2,250 cu. ft (64 cu meter) instrument has collected and analyzed more than 165 billion cosmic ray events (as of April 2021), and identified 9 million of these as antimatter, including the possible detection of antihelium nuclei.

You’ll find more information on AMS-1 and -2 on the NASA website here: https://ams.nasa.gov

AMS-2 installed on the ISS.  Source: NASA

Another important source of data related to antimatter in our universe is NASA’s Fermi Gamma-ray Space Telescope, which was launched into a low Earth orbit on June 11, 2008.  NASA’s website for the ongoing Fermi mission is here: https://fermi.gsfc.nasa.gov

The entire sky at gamma-ray energies greater than 1 GeV based on five years of data from Fermi’s Large Area Telescope (LAT) instrument. Brighter colors indicate brighter gamma-ray sources. Source: NASA/DOE/Fermi LAT Collaboration

In an 8 February 2021 article, astrophysicist Paul Sutter postulates the existence of antimatter star clusters that escaped the primordial matter-antimatter annihilations and now exist in relative isolation, for example, as an antimatter star cluster orbiting our Milky Way galaxy.  

The antimatter stars in the cluster would continuously shed antimatter into the cosmos, leading to subsequent matter-antimatter interactions that produce high-energy particles that may be detectable from Earth.

Sutter commented, “…if astronomers are able to pinpoint a globular cluster as a particularly strong source of anti-particles, it would be like opening a time capsule, giving us a window into the physics that dominated the universe when it was only a second old.” 

In a 20 April 2021 paper, authors Dupourqué, Tibaldo, and von Ballmoos report the possible detection of 14 anti-stars within our Milky Way galaxy.  They used 10 years of data on 5,800 gamma-ray sources in Fermi’s data catalog to develop an estimate of the possible abundance of anti-stars. The authors report: “We identify in the catalog 14 anti-star candidates not associated with any objects belonging to established gamma-ray source classes and with a spectrum compatible with baryon-antibaryon annihilation.”  

Fourteen celestial sources of gamma rays (colored dots in this all-sky map of the Milky Way; yellow / green indicates bright sources and blue shows dim sources) may come from stars made of antimatter.  Source: Simon Dupourqué / IRAP via ScienceNews

The 14 anti-star candidates await further analysis to confirm or refute their existence.  If confirmed, they represent only a small fraction of the population of all gamma-ray sources observed by the Fermi Gamma-ray Space Telescope.  Nonetheless, even one confirmed anti-star would be a remarkable achievement.

For more information:

NASA’s Mars Helicopter Ingenuity is the First Aircraft to Fly on Mars

Peter Lobner

NASA’s Perseverance rover landed on Mars on 18 February 2021 carrying an impressive suite of scientific instruments and another vehicle, the autonomous Mars helicopter Ingenuity.  The Perseverance rover joins the Curiosity rover and the InSight lander, as active NASA missions on the surface of Mars. The Perseverance mission website here: https://mars.nasa.gov/mars2020/

One of the important objectives of this mission is to demonstrate that the solar-powered Ingenuity helicopter can fly in the thin atmosphere of Mars.  On Earth, our standard sea level air pressure is 1,013 millibars. On Mars, the surface atmospheric pressure varies during the year, but averages between 6 to 7 millibars.  That’s equivalent to an Earth pressure altitude of 88,000 to 90,600 ft (27,127 to 27,615 m). On Earth, the helicopter altitude record is 40,820 ft (12,442 m).  During development, Ingenuity’s rotor system was tested in a high-altitude chamber to validate its expected performance.

Ingenuity was carried under the rover and was deployed on 3 April 2021, about six weeks after landing.

View of Ingenuity on the surface of Mars after it was deployed by the Perseverance rover. Source:  NASA / JPL

After system checkouts and software updates, Ingenuity flew for the first time on 19 April 2021, becoming the first aircraft ever to fly on Mars. The first flight took place in Jezero Crater, lasted 39 seconds, and covered a vertical distance of about 10 feet (3 m), with Ingenuity landing back at the takeoff point. For this first flight, the Perseverance rover was parked about 211 feet (64.3 meters) away and chronicled the flight operations with its cameras.

Ingenuity lifts off & rises vertically about 10 feet before landing at the takeoff point.  Use the red-circled rock as a common point of reference in each frame. Source: Screenshots from NASA video.
Ingenuity altimeter data confirmed the first flight. 
Source: Screenshot from NASA video.
Shadow on the ground of Ingenuity in flight, 
taken from its own downward-looking navigation camera. 
Source: Screenshot from NASA video.

You can watch a short (0:58 minute) HD video of the first flight here: https://www.facebook.com/NASAPersevere/videos/201857924836638/

A longer (47:20 minute) video from NASA Mission Control is here:

The Mars helicopter was conceived as a 30-day technology demonstration. To meet the weight and space budgets allocated for the Mars Helicopter, Ingenuity had to be a very compact, lightweight flying machine. The 1.8 kg (4.0 lb) mini-copter flies with two electric motor driven, counter-rotating, coaxial rotors about 1.1 m (3 ft 7 in) in diameter.  The rotors are powered from a rechargeable 2 Ah (Amp-hour) lithium-ion battery.  This is similar to the battery capacity of many cell phones. The general arrangement of the Ingenuity Mars helicopter is shown in the following diagram.

Mars Helicopter. Source: NASA/JPL-Caltech  

For more information on Ingenuity, visit the NASA website here: https://mars.nasa.gov/technology/helicopter/

The Earth 300 Eco-Yacht Could Serve as a Prototype for De-carbonizing the World’s Commercial Marine Transportation Fleets

Peter Lobner

In early April 2021, a flurry of articles described the beautiful, futuristic, nuclear-powered eco-yacht conceived by entrepreneur Aaron Olivera, CEO of Earth 300 (https://earth300.com), and introduced in Singapore as his concept for a signature vessel for conducting environmental research and raising environmental awareness around the world.

Aaron Olivera and the Earth 300 eco-yacht. Source: Archyde.com

This sleek yacht is almost 300 meters long with a prominent cantilevered observation deck near the bow and a 13-story glass “science sphere” amidships. Olivera describes this vessel as follows: 

“Earth 300 it is an extreme technology platform for science, exploration and innovation at sea. Its mission is to ring the ecological alarm on a global scale and combat climate change. Using technology it will quickly scale and deploy solutions to market. Its ultimate ambition is to inspire billions of people to contribute to the preservation of our shared planet, and becoming a sustainable and future worthy civilization.”

The ship’s design was developed by Ivan Salas Jefferson, founder of Iddes Yachts (https://iddesyachts.com), in collaboration with the Polish naval architecture firm NED (https://www.ned-project.eu). Mikal Bøe is the CEO of London-based Core Power (https://corepower.energy), which will supply the next-generation, inherently safe marine molten salt reactor (m-MSR) power plant, using MSR technology developed by the US nuclear company TerraPower (https://www.terrapower.com) that was co-founded by Bill Gates. 

The general arrangement of the ship’s inhabited spaces.
Source: Earth 300

The current design has taken six years and $5 million to develop.  Earth 300 reports that it is making good progress toward getting an Approval in Principle (AIP) from RINA (formerly Registro Italiano Navale). RINA is a founding member of the International Association of Classification Societies (IACS), which promotes safer and cleaner shipping worldwide.  The AIP is a framework used by RINA to review and approve innovative and novel concepts that are not covered by traditional classification prescriptive rules, so that a level of safety in line with the current marine industry practice is provided. The AIP process is a risk-based approach to classification that allows for new designs and novel concepts to be validated with safety equivalencies.

Following the AIP, Earth 300 should be able to request construction quotes from one or more shipyards, likely in Europe and/or South Korea. The ship will be equipped with 22 laboratories for about 160 scientists, cutting-edge artificial intelligence (AI) and robotics systems, and facilities for operating helicopters and submersible and semi-submersible vehicles.  Earth 300 executives reportedly estimated that the total construction cost will be between $500 million and $700 million.

The observation deck is located atop the bow section of the ship.
Source: Earth 300
Foredeck helipad and hangar for a helicopter. Source: Earth 300
The sphere houses a “science city” where most of the shipboard research facilities are located.  Source: Earth 300

Once in operation, the ship is certain to command attention wherever it goes, as a recognizable symbol for environmental protection.  This notoriety may be enough to attract wealthy tourists willing to pay $3 million for a 10-day cruise in the 10 luxury suites with private balconies and accommodations for personal staff in a separate set of cabins.  That sort of money will buy a lot of selfies, instagrams and some durable bragging rights. 

The ship is designed to accommodate 425 people, including the ship’s crew, scientists, and the group of wealthy tourists paying full price. In addition, it has been reported that Olivera envisages inviting groups of other people to travel at a lower price or even for free. For example, 10 suites would be made available to what Olivera calls Very Interesting Persons – people from all walks of life who would bring unique experience or knowledge to the voyage. In addition, some lucky artists, explorers and students may travel for free.

While I’m impressed with the general concept of this ship, I feel that the primary benefit of this grand vessel can’t be to serve as a mobile marine “mixer” for a few very wealthy individuals to associate with scientists, some elite Very Interesting Persons, and a patchwork of others interested in environmental protection.

Like the 3 AM infomercial says, “But wait, there’s more.” Research performed aboard the ship would be “open source” and shared with other research efforts around the world.  That’s great, but more information is needed on the meaningful research programs that would be conducted on the Earth 300 vessel in segments that match the schedule and route of what is essentially a cruise ship.  It seems that a much less expensive dedicated vessel could accomplish the same research while not serving as an environmental sideshow on a cruise ship.

With the ship scheduled to launch in 2025, the vessel itself will be ready many years before the planned marine molten salt reactors (m-MSRs) have been developed and approved by the appropriate nuclear and marine regulatory agencies.  Therefore, it is likely that the vessel will be designed to operate initially with a conventional marine power plant running on synthetic “renewable” fuels.  This isn’t exactly a big step in the right direction for helping to reduce the carbon emissions from worldwide commercial marine transportation.

Like the 3 AM infomercial says, “But wait, there’s more,” or at least, there should be.

Core Power, the developer of the m-MSR planned for the Earth 300 vessel, is designing their 15 MWe inherently safe micro-reactor system as a zero-carbon replacement power source for the fossil-fueled power plants in many commercial marine vessels. On their website, Core Power presents the following business case:

“Over the next few decades as many as 60,000 ships must transition from combustion of fossil fuels to zero-emission propulsion. The UN’s maritime agency IMO has mandated with unanimous approval from 197 countries that shipping must reduce emissions by 50% of the 2008 total, before 2050. This means an actual emission reduction of almost 90%, by 2050. MSR technology being developed by the consortium could achieve that goal, by powering production of green sustainable fuels for smaller ships and providing onboard electric power for large ships, with zero emissions as standard.”

A set of six small, compact Core Power m-MSRs could generate
90 MWe (about 120,000 hp). Source: Core Power

I think it is actually fortuitous that the Earth 300 vessel will start its life as a fossil-fueled vessel.  From this starting point, Earth 300 will be at the vanguard of a new generation of inherently safe marine nuclear power system development and deployment.

Converting the Earth 300 vessel to nuclear power will move the discussions on commercial marine nuclear power from the academic domain, where it has languished for many decades, to the commercial marine nuclear safety regulatory domain, which has been inactive for decades and likely is not prepared for this new applicant.  By being first in line, Earth 300 and Core Power take on substantial licensing risk that certainly will add to the time and cost of their nuclear licensing efforts.  However, they are in unique positions as a reactor supplier and a vessel operator to help shape the licensing dialogue pertaining to the use of inherently safe micro-reactors in marine vessels, and the worldwide operation of vessels using such reactors.

The experience gained from converting Earth 300 from fossil to nuclear power will de-risk the nuclear power conversion process for the entire marine transportation industry.  

  • Regulatory precedents will have been established for the reactor designer and the vessel operator. 
  • The conversion experience will yield many metrics and lessons learned that will help in planning and executing subsequent conversions. 
  • Ports around the world will be on notice that commercial nuclear-powered vessels once again are a reality and appropriate port-specific nuclear safety plans may be required

In this role alone, Earth 300 will create a path for the commercial marine transportation industry to meet the IMO’s 2050 emission goal.  This would be a truly substantive accomplishment that will far outweigh the ship’s public relations accomplishments as a symbol of environmental protection and showcase for environmental research.

I hope Aaron Olivera gets the support he needs to build the Earth 300 ship and subsequently convert it to nuclear power.  At one level, the ship is a grand gesture.  On another level, the nuclear powered ship is a substantive step toward a future with zero-carbon commercial marine transportation.

For more information

Multi-messenger Astronomy Provides Extraordinary Views of Uranus

Peter Lobner, updated 19 December 2023

1. Introduction

Uranus, the seventh planet from the Sun, is an ice giant planet with 27 known moons in a unique orbit beyond Saturn. Uranus makes a complete orbit around the Sun in about 84 Earth years. It is the only planet whose equator is tilted nearly at a right angle to its orbital plane, which results in the polar regions pointing toward the Sun (and Earth) during parts of the orbit.

Uranus was visited briefly by NASA’s Voyager 2 spacecraft during its January 1986 flyby, which came within 81,500 km (50,600 miles) of the planet’s cloud tops. Since then, Uranus has been studied at visible, near-infrared and X-ray wavelengths from the perspective of terrestrial and near-Earth, space-based observatories.

Visible light has a wavelength in the range from about 350 to 750 nanometers (nm, 10-9meters) or 3,500 to 7,500 Angstroms.  Near-infrared light is the part of the infrared spectrum that is closest to the visible light spectrum, but at a longer wavelength, from about 800 to 2,500 nm.  X-rays have a much shorter wavelength, from about 20 to 0.001 nm.  In the following chart, you can see the relative placement of visible and near-infrared light and X-rays in the electromagnetic spectrum.

Electromagnetic spectrum. Source: Wikipedia

2. 2021 composite images of Uranus at visible / near-infrared and X-ray wavelengths

In March 2021, the National Aeronautics and Space Administration (NASA) announced that its orbiting Chandra X-ray Observatory had made the first ever detection of X-rays coming from the ice giant planet Uranus.  Recent analysis of Chandra observations from 2002 and 2017 resulted in this discovery. You can read NASA’s 2021 announcement of this discovery here: https://chandra.si.edu/photo/2021/uranus/

X-rays coming from other planets have been detected in the past.  NASA reported, “Like Jupiter and Saturn, Uranus and its rings appear to mainly produce X-rays by scattering solar X-rays, but some may also come from auroras…… The X-rays from auroras on Jupiter come from two sources: electrons traveling down magnetic field lines, as on Earth, and positively charged atoms and molecules raining down at Jupiter’s polar regions. However, scientists are less certain about what causes auroras on Uranus.”  

Another possible X-ray source could be from an interaction between Uranus’ rings and the near-space charged particle environment around the planet.  This phenomenon has been observed at Saturn.

In connection with the discovery of X-rays coming from Uranus, NASA released two spectacular composite (multi-messenger) images of the planet created by combining images from two different parts of the electromagnetic spectrum: optical / near-infrared and X-ray. 

The components of the first composite image are described below:

  • Near-infrared image: This was taken in July 2004 with the 10-meter (32-foot 10-inch) Keck-1 telescope located at an altitude of 4,145 meters (13,599 ft) on Maunakea, Hawaii.
  • The X-ray image: This was produced with 7 August 2002 data from the Advanced CCD Imaging Spectrometer (ACIS) aboard Chandra, which has a spatial resolution of 0.5” (seconds). The angular size of Uranus for the observation was 3.7”. The X-rays were in the 0.6 to 1.1 keV (2.1 to 1.1 nm) spectral range, which is consistent with X-ray emissions from Jupiter and Saturn. 
(Left) Keck-1 July 2004 near-infrared image of Uranus. The North Pole is at the 4 o’clock position. Sources: Space Science Institute;  University of Wisconsin-Madison / W. M. Keck Observatory (Right) Chandra August 2002 ACIS X-ray image of Uranus.  Sources: NASA/CXO/University College London
2021 Keck-1 & Chandra ACIS composite image

The second 2021 composite image, shown below, was created from a Keck optical image and X-ray images made with Chandra’s High Resolution Camera (HRC) during observations on 11 and 12 November 2017.  The HRC is sensitive to softer X-ray emissions (down to 0.06 keV, 20.7 nm) than ACIS, enabling it to collect more photons in the 0.1–1.2 keV (12.4 to 0.1 nm) range most important for planetary studies. The authors report, ”These fluxes exceed expectations from scattered solar emission alone, suggesting either a larger X-ray albedo than Jupiter/Saturn or the possibility of additional X-ray production processes at Uranus.”

2021 Keck & Chandra HRC composite image
Sources:  X-ray: NASA/CXO/University College London/W. Dunn 
et al; Optical: W.M. Keck Observatory

The authors conclude by noting that, “Further, and longer, observations with Chandra would help to produce a map of X-ray emission across Uranus and to identify, with better signal-to-noise, the source locations for the X-rays, constraining possible contributions from the rings and aurora…… However, the current generation of X-ray observatories does not provide sufficient sensitivity to spectrally characterize the short interval temporal fluctuation observed in the November 12, 2017 observation.”

New space-based X-ray observational capabilities are being developed by NASA and the European Space Agency (ESA), but won’t be operational for a decade or more:

3. 2023 JWST near-infrared images of Uranus

The James Webb Space Telescope (JWST), which has four science instruments designed to observe at optical to mid-infrared (0.6 – 28.3 microns) wavelengths, produced its first images of Uranus in April 2023.

Annotated image of Uranus captured by the JWST on 6 Feb. 2023,  provides a view of the bright North polar ice cap and glowing clouds at near-infrared wavelengths of 1.4 to 3.0 microns. Sources: NASA, ESA, CSA, STScI

Wide field image of Uranus captured by the JWST on 6 Feb. 2023 at near-infrared wavelengths of 1.4 to 5.0 microns. Note  that 14 of the 27 known moons are identified in the image. Also note the many distant galaxies in this image. Sources: NASA, ESA, CSA, STScI

Enlarged view of the 6 Feb. 2023 JWST near-infrared image shows the bright North polar cap, glowing clouds, details of the ring structure and many of the inner moons. Sources: NASA, ESA, CSA, STScI

4. For more information:

Polarized Image Provides New Insights Into the M87 Black Hole

Peter Lobner, 25 March 2021

The first image of the shadow of a black hole was released on 10 April 2019 by the Event Horizon Telescope (EHT) collaboration and the National Science Foundation (NSF).  The target of their observation was the supermassive black hole located near the center of the Messier 87 (M87) galaxy, which is about 55 million light years from Earth.  That black hole is estimated to have a mass 6.5 billion times greater than our Sun.

Non-polarized image of M87 released 10 April 2019.  Source: EHT & NSF

After further analysis of the historic M87 data, EHT astronomers have been able to measure the polarization of the radio frequency signals from the bright disk of the black hole.  Polarization is a signature of the direction of the very strong magnetic fields in the hot glowing gas at the edge of a black hole, which can be seen in the following image released on 24 March 2021.  

Polarized image of M87 released 24 March 2021.  Source: EHT 

The ability to measure the polarization in fine detail provides a new tool for mapping the dynamic magnetic field structure of a black hole.  The new image shows the magnetic fields in the swirling accretion disk, which contains matter that is falling into the black hole.  

Researchers also measured polarization that is pointing directly toward or away from the black hole, perpendicular to the accretion disk.  Very strong magnetic fields in these directions may be responsible for launching plasma jets into space, away from the black hole.  Such jets have been observed emanating from some black holes.

These are exciting times in astronomy and astrophysics.

For more information: