All posts by Drummer

VBB-3, the World’s Most Powerful Electric Car, will Challenge the Land Speed Record in 2016

Peter Lobner

Updated 2 January 2017

Venturi Buckeye Bullet-3 (VBB-3) is an all-electric, four wheel drive, land speed record (LSR) car that has been designed to exceed 400 mph (643.7 km/h). The organizations involved in this project are:

  • Venturi Automobiles:

This Monaco-based company is a leader in the field of high performance electric vehicles. Read more at the Venturi website at the following link:

http://en.venturi.fr/challenges/world-speed-records

  • Ohio State University (OSU) Center for Automotive Research (CAR):

OSU’s CAR has been engaged in all-electric LSR development and testing since 2000. On 3 October 2004 at the Bonneville Salt Flats in Utah, the original nickel-metal hydride (NiMH) battery-powered Buckeye Bullet reached a top speed of 321.834 mph (517.942 km/h).

In an on-going program known as Mission 01, started in 2009, OSU partnered with Venturi to develop, test, and conduct the land speed record runs of the hydrogen fuel cell-powered VBB-2, the battery-powered VBB-2.5, and the more powerful battery-powered VBB-3.  Read more at the OSU / CAR website at following link:

https://car.osu.edu/search/node/VBB-3

 The Venturi – OSU team’s accomplishments to date are:

  • 2009:  The team’s first world land speed record was achieved on the Bonneville Salt Flats with hydrogen fuel cell-powered VBB-2 at 303 mph (487 km/h).
  •  2010:  The team returned to the salt flats with the 700 hp lithium-ion battery powered VBB-2.5 which set another world record at 307 mph (495 km/h); with a top speed at 320 mph (515 km/h).
  •  2013:  The 3,000 hp lithium iron phosphate battery-powered VBB-3 was unveiled. Due to the flooding of the Bonneville Salt Flats, the FIA and the organizers of the world speed records program cancelled the 2013 competition.
  •  2014Poor track conditions at Bonneville persisted after flooding from a summer storm. Abbreviated test runs by VBB-3 yielded a world record in its category (electric vehicle over 3.5 metric tons) with an average speed of 212 mph (341 km/h) and a top speed of 270 mph (435 km/h).
  •  2015:  Poor track conditions at Bonneville persisted after flooding from a summer storm. Abbreviated test runs by VBB-3 yielded a world record in its category (electric vehicle over 3.5 metric tons) with an average speed of 212 mph (341 km/h) and a top speed of 270 mph (435 km/h).

You will find a comparison of the VBB-2, VBB-2.5 and VBB-3 vehicles at the following link:

http://en.vbb3.venturi.fr/about/the-car

VBB-3 has a 37.2 ft. (11.35 meter) long, slender, space frame chassis that houses eight battery packs with a total of 2,000 cells, two 1,500 hp AC induction motors developed by Venturi for driving the front and rear wheels, a coolant system for the power electronics, disc brakes and a braking parachute, and a small cockpit for the driver. The basic internal arrangement of these components in the VBB-3 chassis is shown in the following diagram.

VBB-3 internalSource: Venturi

You can see a short video of a test drive of VBB-3 without its external skin at the following link:

http://en.vbb3.venturi.fr

The exterior aerodynamic carbon fiber shell was designed with the aid of the OSU Supercomputer Center to minimize vehicle drag and lift.

VBB-3 skinSource: Venturi

The completed VBB-3 with members of the project team is shown below.

VBB-3 completeSource: Venturi

A good video showing the 2010 VBB-2.5 record run and a 2014 test run of VBB-3 is at the following link:

https://www.youtube.com/watch?v=KLn07Y-t1Xc&ebc=ANyPxKqkVxPKQWnYXzUemRbE5WWlRIJUbaXA-UN6XPNoiDZG1O4NsFq8RE08QlrfdbfkxKmE32MEf5g2Qw0_WQbFXBvKYz9qwg

VBB-3 currently is being prepared in the OSU / CAR workshop in Columbus, Ohio, for another attempt at the land speed record in summer 2016. A team of about 25 engineers and students are planning to be at the Bonneville Salt Flats in summer 2016 with the goal of surpassing 372 mph (600 km/h).

You can subscribe to Venturi new releases on VBB-3 at the following link:

http://en.venturi.fr/news/the-vbb-3-gets-ready

VBB-3 at BonnevilleSource: Venturi

Update 2 January 2017: VBB-3 sets new EV land speed record

On 19 September 2016, VBB-3 set an electric vehicle (Category A Group VIII Class 8) land-speed record of 341.4 mph (549 kph), during a two-way run within one hour on the Bonneville salt flats in Utah. You can read the OSU announcement at the following link:

https://news.osu.edu/news/2016/09/21/ohio-states-all-electric-venturi-buckeye-bullet-3-sets-new-landspeed-record/

You also can watch a short video of VBB-3’s record run at the following link:

https://www.youtube.com/watch?v=rIqT4qLtGcY

Certification of this EV speed record by the Federation Internationale de l’Automobile’s (FIA) is still pending.

The Venturi-OSU team believes VBB-3 has the capability to achieve 435 mph (700 kph) in the right conditions, so we can expect more record attempts in the future.

Dispatchable Power from Energy Storage Systems Help Maintain Grid Stability

Peter Lobner

On 3 March 2015, Mitsubishi Electric Corporation announced the delivery of the world’s largest energy storage system, which has a rated output of 50 MW and a storage capacity of 300 MWh. The battery-based system is installed in Japan at Kyushu Electric Power Company’s Buzen Power Plant as part of a pilot project to demonstrate the use of high-capacity energy storage systems to balance supply and demand on a grid that has significant, weather-dependent (intermittent), renewable power sources (i.e., solar and/or wind turbine generators). This system offers energy-storage and dispatch capabilities similar to those of a pumped hydro facility. You can read the Mitsubishi press release at the following link:

http://www.mitsubishielectric.com/news/2016/pdf/0303-b.pdf

The energy storage system and associated electrical substation installation at Buzen Power Plant are shown below. The energy storage system is comprised of 63 4-module units, where each module contains sodium-sulfur (NaS) batteries with a rated output of 200 kW. The modules are double stacked to reduce the facility’s footprint and cost.

Buzen Power Plant - JapanSource: Mitsubishi

The following simplified diagram shows how the Mitsubishi grid supervisory control and data acquisition (SCADA) system matches supply with variable demand on a grid with three dispatchable energy sources (thermal, pumped hydro and battery storage) and one non-dispatchable (intermittent) energy source (solar photovoltaic, PV). As demand varies through the day, thermal power plants can maneuver (within limits) to meet increasing load demand, supplemented by pumped hydro and battery storage to meet peak demands and to respond to the short-term variability of power from PV generators. A short-term power excess is used to recharge the batteries. Pumped hydro typically is recharged over night, when the system load demand is lower.

Mitsubishi SCADA

Above diagram: Mitsubishi BLEnDer® RE Battery SCADA System (Source: Mitsubishi)

Battery storage is only one of several technologies available for grid-connected energy storage systems. You can read about the many other alternatives in the December 2013 Department of Energy (DOE) report, “Grid Energy Storage”, which you can download at the following link:

http://www.sandia.gov/ess/docs/other/Grid_Energy_Storage_Dec_2013.pdf

This 2013 report includes the following figure, which shows the rated power of U.S. grid storage projects, including announced projects.

US 2013 grid  storage projectsSource: DOE

As you can see, battery storage systems, such as the Mitsubishi system at Buzen Power Plant, comprise only a small fraction of grid-connected energy storage systems, which currently are dominated in the U.S. by pumped hydro systems. DOE reported that, as of August 2013, there were 202 energy storage systems deployed in the U.S. with a total installed power rating of 24.6 GW. Energy storage capacity (i.e., GWh) was not stated. In contrast, total U.S. installed generating capacity in 2013 was over 1,000 GW, so fully-charged storage systems can support about 2.4% of the nation’s load demand for a short period of time.

Among DOE’s 2013 strategic goals for grid energy storage systems are the following cost goals:

  • Near-term energy storage systems:
    • System capital cost: < $1,750/kW; < $250/kWh
    • Levelized cost: < 20¢ / kWh / cycle
    • System efficiency: > 75%
    • Cycle life: > 4,000 cycles
  • Long-term energy storage systems:
    • System capital cost: < $1,250/kW; < $150/kWh
    • Levelized cost: < 10¢ / kWh / cycle
    • System efficiency: > 80%
    • Cycle life: > 5,000 cycles

Using the DOE near-term cost goals, we can estimate the cost of the energy storage system at the Buzen Power Plant to be in the range from $75 – 87.5 million. DOE estimated that the storage devices contributed 30 – 40% of the cost of an energy storage system.  That becomes a recurring operating cost when the storage devices reach their cycle life limit and need to be replaced.

The Energy Information Agency (EIA) defines capacity factor as the ratio of a generator’s actual generation over a specified period of time to its maximum possible generation over that same period of time. EIA reported the following installed generating capacities and capacity factors for U.S. wind and solar generators in 2015:

US renewable power 2015

Currently there are 86 GW of intermittent power sources connected to the U.S. grid and that total is growing year-on-year. As shown below, EIA expects 28% growth in solar generation and 16% growth in wind generation in the U.S. in 2016.

Screen Shot 2016-03-03 at 1.22.06 PMSource: EIA

The reason we need dispatchable grid storage systems is because of the proliferation of grid-connected intermittent generators and the need for grid operators to manage grid stability regionally and across the nation.

California’s Renewables Portfolio Standard (RPS) Program has required that utilities procure 33% of their electricity from “eligible renewable energy resources” by 2020. On 7 October 2015, Governor Jerry Brown signed into law a bill (SB 350) that increased this goal to 50% by 2030. There is no concise definition of “eligible renewable energy resources,” but you can get a good understanding of this term in the 2011 California Energy Commission guidebook, “Renewables Portfolio Standard Eligibility – 4th Edition,” which you can download at the following link:

http://www.energy.ca.gov/2010publications/CEC-300-2010-007/CEC-300-2010-007-CMF.PDF

The “eligible renewable energy resources” include solar, wind, and other resources, several of which would not be intermittent generators.

In 2014, the installed capacity of California’s 1,051 in-state power plants (greater than 0.1 megawatts – MW) was 86.9 GW. These plants produced 198,908 GWh of electricity in 2014. An additional 97,735 GWh (about 33%) was imported from out-of-state generators, yielding a 2014 statewide total electricity consumption of almost 300,000 GWh of electricity. By 2030, 50% of total generation is mandated to be from “eligible renewable energy resources,” and a good fraction of those resources will be operating intermittently at average capacity factors in the range from 22 – 33%.

The rates we pay as electric power customers in California already are among the highest in the nation, largely because of the Renewables Portfolio Standard (RPS) Program. With the higher targets for 2030, we soon will be paying even more for the deployment, operation and maintenance of massive new grid-connected storage infrastructure that will be needed to keep the state and regional grids stable.

How Long Does it Take to Certify a Commercial Airliner?

Peter Lobner

After designing, developing, and manufacturing a new commercial airliner, I’m sure the airframe manufacturer has a big celebration on the occasion of the first flight. The ensuing flight test and ground static test programs are intended to validate the design, operating envelope, and maintenance practices and satisfy these and other requirements of the national certifying body, which in the U.S. is the Federal Aviation Administration (FAA). Meanwhile, airlines that have ordered the new aircraft are planning for its timely delivery and introduction into scheduled revenue service.

The time between first flight and first delivery of a new commercial airliner is not a set period of time. As you can see in the following chart, which was prepared by Brian Bostick (http://aviationweek.com/thingswithwings), there is great variability in the time it takes to get an airliner certified and delivered.

Time to certify an airliner

In this chart, the Douglas DC-9 has the record for the shortest certification period (205 days) with certification in November 1965. The technologically advanced supersonic Concorde had one of the longest certification periods (almost 2,500 days), with authorization in February 1976 to conduct a 16-month demonstration period with flights between Europe and the U.S. before starting regular commercial service.

The record for the longest certification period goes to the Chinese Comac ARJ21 twin-jet airliner, which is the first indigenous airliner produced in China. The first ARJ21 was delivered to a Chinese airline in November 2015. The ARJ is based on the DC-9 and reuses tooling provided by McDonnell Douglas for the licensed production of the MD-80 (a DC-9 variant) in China. I suspect that the very long certification period is a measure of the difficulty in establishing the complete aeronautical infrastructure needed to deliver an indigenous commercial airliner with an indigenous jet engine.

In the chart, compare the certification times for the following similar commercial airliners:

  • Four-engine, single aisle, long-range airliners: Boeing 707 (shortest), Douglas DC-8, Convair CV-880, Vickers VC-10, De Havilland Comet (longest)
  • Three-engine, single aisle, medium range airliners: Boeing 727 (shorter), Hawker Siddeley Trident (longer)
  • Two-engine, single aisle airliners: Douglas DC-9 (shortest), Boeing 737, Boeing 757, Airbus A320, British Aircraft Corporation BAC 1-11, Dassault Mercure, Caravelle (longest)
  • Two-engine, single aisle, short range regional jets: Embraer ERJ 145 (shortest), Bombardier CRJ-100, BAe 146, Fokker F-28, ERJ 170, Bombardier CS Series, Mitsubishi MRJ, Sukhoi Superjet, VFW-614, Comac ARJ21 (longest)
  • Four-engine, wide-body, long-range airliners: Boeing 747, Airbus A340, Airbus A380 (longest)
  • Three-engine, wide-body, long-range airliners: Douglas DC-10 (shorter), Lockheed L-1011 (longer)
  • Two-engine, wide-body airliners: Boeing 767 (shortest), Boeing 777, Airbus 350, Airbus A300, Boeing 787 (longest)

Time is money, so there is tremendous economic value in minimizing the time between first flight and first delivery. The first 16 aircraft at the top of the chart all enjoyed relatively short certification periods. This group, which includes many aircraft that appeared in the 1960s – 70, averaged about 400 days between first flight and first delivery.

More modern aircraft (blue bars in the chart representing aircraft appearing in 2000 or later) have been averaging about 800 days between first flight and first delivery (excluding ARJ21).

Solar Impulse 2 Preparing for the Next Leg of its Around-the-World Journey

Peter Lobner

In my 10 March 2015 post, I provided basic information of the remarkable Solar Impulse 2 aircraft and its mission to be the first aircraft to fly around the world on solar power. On 10 July 2015, I posted a summary of the first eight legs of the around the world flight, which started in Abu Dhabi on 9 March 2015 and ended on 3 July at Kalaeloa, a small airport outside Honolulu, Hawaii.

After arriving in Hawaii, the Solar Impulse team determined that the batteries had been damaged due to overheating on the first day of the Leg 8 flight and would have to be replaced. Solar Impulse reported the following root cause for the overheating:

“Since the plane had been exposed to harsh weather conditions from Nanjing to Nagoya, we decided to do a test flight before leaving for Hawaii. Having to perform a test flight followed by a mission flight had not been taken into account in the design process of the battery system, which did not allow the batteries to cool down in between the two” (flights).

By November 2015, the Solar Impulse engineers had upgraded the design of the whole battery system and integrated a battery cooling system. You can read the details on the Solar Impulse website at the following link:

http://blog.solarimpulse.com/post/133346944960/cool-batteries-solarimpulse

A further delay in starting Leg 9 was caused by the seasonal shortening of daylight hours in the Northern hemisphere. The late autumn and winter daylight hours weren’t long enough to allow the batteries to be fully recharged during the day along the planned route to the U.S. mainland and back to Abu Dhabi.

Solar Impulse 2 routeSource: Solar Impulse

On 26 February 2016, the upgraded Solar Impulse II made a successful “maintenance” flight in Hawaii. The flight lasted 93 minutes, reached an altitude of 8,000 feet (2,400 meters), and included tests of the stabilization and battery cooling systems.

Solar Impulse is planning to restart its around-the-world journey on 20 April 2016.

Solar Impulse composite photo over HawaiiSource: Solar Impulse

You can subscribe to news releases from the Solar Impulse team at the following link:

http://www.solarimpulse.com/subscribe

Virgin Galactic’s SpaceShipTwo is a Step Closer to Operational Commercial Spaceflights from Spaceport America

Peter Lobner

In my 13 April 2015 post, I provided an introduction to three U.S. commercial, suborbital human spaceflight programs. You may recall that Virgin Galactic’s first SpaceShipTwo was destroyed in an in-flight accident on 31 October 2014. The in-flight breakup of SpaceShipTwo resulted from the premature unlocking of the wing, which allowed the wing to move to the high-drag “feathered” position while the ship was accelerating through the transonic region (i.e., not yet supersonic). The pilot was seriously injured and the copilot was killed in this accident. You can find the Executive Summary of the National Transportation Safety Board’s (NTSB’s) accident report at the following link:

http://www.ntsb.gov/investigations/AccidentReports/Pages/AAR1502.aspx

More information from the 28 July 2015 NTSB Board meeting is available at the following link:

http://www.ntsb.gov/news/events/Pages/2015_spaceship2_BMG.aspx

Today, Virgin Galactic unveiled the second SpaceShipTwo at the Mojave Air and Space Port in California. The ship was named, Virgin Spaceship (VSS) Unity by Professor Stephen Hawking, who said in a recorded speech, “I would be very proud to fly on this spaceship.”

VSS_Unity_Reveal Source: Virgin Galactic

The second SpaceShipTwo, which was under construction before the crash of its predecessor, is very similar to the first article, but with the following significant changes:

  • Feathering system: Virgin Galactic reports, “With regard to the accident specifically, we have made one structural change to the vehicle, which is to add a mechanical inhibit to the featherlock system that would prevent that from ever being inadvertently opened at the wrong time in flight.”
  • Rocket fuel: Virgin Galactic switched from a hydroxyl-terminated polybutadiene (HTBP) rubber-based solid fuel to a polyamide (plastic)-based fuel for the rocket motor on the first SpaceShipTwo. For the second SpaceShipTwo, Virgin Galactic announced in October 2015 that it was switching back to HTBP-based fuel.

Virgin Galactic has not yet announced other design and/or operational changes.

Like the first SpaceShipTwo, VSS Unity will go through an extensive test program that starts with “captive carry” flights on the WhiteKnightTwo aircraft.

SpaceShipTwo carriedWhiteKnightTwo carrying SpaceShipTwo; source: Virgin Galactic

The next series of tests include unpowered (gliding) flights after being dropped from WhiteKnightTwo, and finally, powered tests that will validate the flight envelope of SpaceShipTwo. At the conclusion of this testing program, VSS Unity may become the first commercial space vehicle to make regular, suborbital flights with paying passengers.

You can keep track of the progress being made at the Virgin Galactic website at the following link:

http://www.virgingalactic.com

The commercial flights will be conducted from Spaceport America, which is located in the desert east of Truth of Consequences, NM. You can find information of the Spaceport and make arrangements for a tour at the following website.

http://spaceportamerica.com

I visited Spaceport America in October 2015 and found it to be an impressive, but lonely facility, just waiting for the start of regular commercial space missions. The main hanger, shown below, housed only a SpaceShipTwo mockup and the enormous runway was silent.

All that will change after VSS Unity completes its test program and begins the operational phase of commercial human spaceflight in the desert of southern New Mexico. These are exciting times!

Spaceport pic 1

Spaceport pic 2

Spaceport pic 3Source, three photos: Author

New From The National Academies Press

Peter Lobner

My 14 March 2015 post provided an introduction to The National Academies Press (NAP), which is a very good source for reports and other documents on the following topics:

  • Agriculture
  • Behavioral & social sciences
  • Biographies & autobiographies
  • Biology & life sciences
  • Computers & information technology
  • Conflict & security issues
  • Earth sciences
  • Education
  • Energy & energy conservation
  • Engineering & technology
  • Environment & environmental studies
  • Food & nutrition
  • Health & medicine
  • Industry & labor
  • Mathematics, chemistry & physics
  • Policy for science & technology
  • Space & aeronautics
  • Transportation

Most of the NAP reports can be downloaded for free as pdf files if you establish a MyNAP account. If you haven’t set up such an account, you can do so at the following link:

http://www.nap.edu/content/using-mynap

With this account, you also can get e-mail notifications of new NAP reports.

For those of you who have not set up a MyNAP account, here are several new NAP reports that I found to be interesting.

Infusing Ethics into the Development of Engineers (2016)

Ethical practice in engineering is critical for ensuring public trust in the field and in its practitioners, especially as engineers increasingly tackle international and socially complex problems that combine technical and ethical challenges. This report aims to raise awareness of the variety of exceptional programs and strategies for improving engineers’ understanding of ethical and social issues and provides a resource for those who seek to improve ethical development of engineers at their own institutions.

NAP-infuse engineers  Source: NAP

Reducing the Use of Highly Enriched Uranium in Civilian Research Reactors (2016)

Today, 74 civilian research reactors around the world, including 8 in the U.S., use or are planning to use HEU fuel. In the past decades, many civilian reactors around the world have been either shut down or converted from HEU to low enriched uranium fuel. Despite this progress, the large number of remaining HEU-fueled reactors demonstrates that further progress is needed on a worldwide scale.

Print  Source: NAP

Enhancing Participation in the U.S. Global Change Research Program (2016)

The U.S. Global Change Research Program (USGCRP) is a collection of 13 Federal entities charged by law to assist the U.S. and the world to understand, assess, predict, and respond to human-induced and natural processes of global change. As the understanding of global change has evolved over the past decades and as demand for scientific information on global change has increased, the USGCRP has increasingly focused on research that can inform decisions to cope with current climate variability and change, to reduce the magnitude of future changes, and to prepare for changes projected over the coming decades.

NAP-global change  Source: NAP

Frontiers of Engineering – Reports on Leading-Edge Engineering from the 2015 Symposium (2016)

This volume presents papers on the following topics covered at the National Academy of Engineering’s 2015 U.S. Frontiers of Engineering Symposium:

  • Cyber security and privacy
  • Engineering the search for Earth-like exoplanets
  • Optical and mechanical metamaterials
  • Forecasting natural disasters

NAP-frontiers of engg 2015  Source: NAP

There are many other annual reports in the NAP “Frontiers of Engineering” series, dating back to at least 1997, and covering many other engineering topics.

I hope you’ll take some time and browse the NAP library for documents that are of interest to you. You can start your browsing, without a MyNAP account, at the following link:

http://www.nap.edu

China’s Five Hundred Meter Aperture Spherical Telescope (FAST) will be the World’s Largest Radio Telescope

Peter Lobner

Updated 20 October 2019

FAST is being built in a remote region of China, in the southwestern province of Guizhou. Completion is planned for September 2016, at which time FAST will replace the similar 305 meter (1,000 ft) Arecibo Observatory in Puerto Rico as the world’s largest radio telescope.

China builds World's Largest Radio Telescope

FAST pic 2Source: FAST

Main features of FAST are:

  • The telescope is built in a natural karst depression
  • The 500 meter (1,640 ft) active main reflector is comprised of 4,600 triangular panels
    • directly corrects for spherical aberration
    • allows the telescope to be steered to view the sky within 40 degrees from zenith
  • The focus cabin suspended above the main reflector houses nine feeds for receivers covering a frequency range of 70MHz – 3 GHz
  • In comparison to Arecibo, FAST is expected to have the following performance parameters:
    • 2 times greater sensitivity
    • 5 – 10 times faster surveying speed
    • 2 – 3 times greater sky coverage due to the steering capability of the active main reflector

Observation programs are expected to include the following:

  • Large scale neutral hydrogen survey
    • Will support studies such as dark matter and dark galaxies, large scale structures and dark energy, and galaxy formation and evolution
  • Detect interstellar molecules
    • The receiver bands of FAST are designed to cover OH (hydroxyl radical), CH3OH (methanol) and 12 other molecular lines
  • Survey the transient sky, including pulsar observations
  • Operate as part of the international very long baseline interferometry (VLBI) network

All residents within 3 miles of the new telescope (more than 9,000 people) are being relocated to create an electromagnetic “quiet zone” around the telescope.

You can download a fact sheet on the telescope at the following link:

http://www.cospa.ntu.edu.tw/aappsbulletin/data/19-2/33FAST.pdf

You can download a more detailed paper entitled, “The Five Hundred Meter Aperture Spherical Telescope (FAST) Project,” which provides details on the telescope design, at the following link:

http://arxiv.org/pdf/1105.3794.pdf

An English language version of the FAST project website appears not to have been maintained since 2010, but can be accessed at the following link:

http://fast.bao.ac.cn/en/FAST.html

 5 July 2016 Update:  FAST construction complete

The Chinese government announced completion of FAST on 4 July 2016.  The project took roughly five years to complete and cost about $180 million.

 22 October 2019 Update:  FAST is operational

FAST Chief Engineer, JIANG Peng, announced that FAST has been open to Chinese astronomers since April 2019. After the National Construction Acceptance in September 2019, it is expected that FAST will be available for use by astronomers from other nations.   You can read more here:

https://www.universetoday.com/143346/chinas-fast-telescope-the-worlds-largest-single-radio-dish-telescope-is-now-fully-operational/

and here:

https://www.nature.com/articles/d41586-019-02790-3

NSF and LIGO Team Announce First Detection of Gravitational Waves

Peter Lobner

Today, 11 February 2016, the National Science Foundation (NSF) and the Laser Interferometer Gravitational-Wave Observatory (LIGO) project team announced that the first detection of gravitational waves occurred on 14 September 2015. You can view a video of this announcement at the following link:

https://www.youtube.com/watch?v=_582rU6neLc

The first paper on this milestone event, “Observation of Gravitational Waves From a Binary Black Hole Merger,” is reported in Physical Review Letters, at the following link:

http://journals.aps.org/prl/pdf/10.1103/PhysRevLett.116.061102

The recorded signals from the two LIGO sites, Livingston, LA and Hanford, WA, are shown below, with the Hanford data time shifted to account for the slightly later arrival time of the gravitational wave signal at that detector location. The magnitude of the gravitational wave signal was characterized as being just below the detection threshold of LIGO before installation of the new advanced detectors, which improve LIGO sensitivity by a factor of 3 to 10.

LIGO signals

Source: NSF/LIGO

This milestone occurred during the engineering testing phase of the advanced LIGO detectors, before the start of their first official “observing run” on 18 September 2015.

Analysis and simulations conducted on the data indicate that the observed gravitational wave signals were generated when two orbiting black holes coalesced into a single black hole of smaller total mass and ejected about three solar masses of energy as gravitational waves.

In the Physical Review Letters paper, the authors provide the following diagram, which gives a physical interpretation of the observed gravitational wave signals.

Binary black holes merge

Note the very short timescale of this extraordinarily dynamic process. The recorded gravitational wave signals yielded an audible “chirp” when the two black holes merged.

With only two LIGO detectors, the source of the observed gravitational waves could not be localized, but the LIGO team reported that the source was in the southern sky, most likely in the vicinity of the Magellanic Clouds.

Localization of black hole merger Source: NSF/LIGO

The ability to localize gravitational wave signals will improve when additional gravitational wave detectors become operational later in this decade.

For more information on the current status of LIGO and other new-generation gravitational wave detectors, see my 16 December 2015 post: “100th Anniversary of Einstein’s Theory of General Relativity and the Advent of a New Generation of Gravity Wave Detectors.”

Update: 3 October 2017

 Congratulations to Rainer Weiss, Barry C. Barish, and Kip S. Thorne, all members of the LIGO / VIRGO Collaboration, for their award of the 2017 Nobel Prize in Physics for the first direct observation of gravitational waves. You can read the press release from the Royal Swedish Academy of Sciences here:

https://www.nobelprize.org/nobel_prizes/physics/laureates/2017/press.html

You also can read the scientific background on this award on the Royal Swedish Academy of Sciences website at the following link:

https://www.nobelprize.org/nobel_prizes/physics/laureates/2017/advanced-physicsprize2017.pdf

Anyone Can Quantum

Peter Lobner

Nobel Laureate Dr. Richard Feynman is famously quoted as saying, “I think I can safely say that nobody understands quantum mechanics.” University of Southern California (USC) graduate student Chris Cantwell, the inventor of Quantum Chess, is seeking to change that view by demonstrating that, in the right framework, anyone can grapple with some of the basic concepts of quantum mechanics. In particular, Chris Cantwell views Quantum Chess as a means of “demystifying the quantum world through play.” In Quantum Chess, all of the conventional chess moves are allowed as well as certain quantum moves for all pieces except pawns.

Quantum Chess isn’t a game you can purchase right now, but the short video, “Anyone Can Quantum,” provides an entertaining demonstration of what quantum gameplay will be like in the near future. This video was created by Caltech’s Institute for Quantum Information and Matter (IQIM) (‪http://iqim.caltech.edu) in association with Trouper Productions (‪http://trouper.net). In the video, actor Paul Rudd (Ant Man) challenges Stephen Hawking to a game of Quantum Chess for the right to give the keynote address at Caltech’s 26 – 27 January 2016 special event, “One Entangled Evening: A Celebration of Richard Feynman’s Quantum Legacy.”

You can view the almost 12 minute video at the following link.

https://www.youtube.com/watch?v=Hi0BzqV_b44

Here are a few of screenshots from the video.

Quantum chess match announcement

Quantum chess players

Quantum superposition is demonstrated by “Schrodinger’s king”, which could be in two places at one time.

Without superposition                                                      With superposition

Without superposition             With superposition

Quantum entanglement of the king & bishop enabled a bishop to move through a king.

Without entanglement                                                  With entanglement

Without entanglement           With entangelement

Resolution of the game required a quantum measurement to determine the winner.

For those of you who can’t wait to play a real game of Quantum Chess, Chris Cantwell has launched a Kickstarter funding program. Find out details at the following link:

https://www.kickstarter.com/projects/507726696/quantum-chess

You can find out more about the 26 – 27 January 2016 Caltech event, One Entangled Evening: A Celebration of Richard Feynman’s Quantum Legacy,” at the following link:

https://www.caltech.edu/content/one-entangled-evening-celebration-richard-feynmans-quantum-legacy

The Doomsday Clock, the Iraq War and the War Scare of 1983

Peter Lobner

The Doomsday Clock

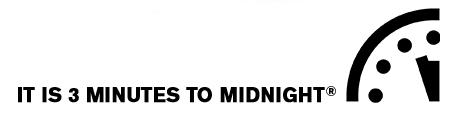
On 26 January 2016, The Bulletin of the Atomic Scientists Science and Security Board announced that the minute hand of its Doomsday Clock will remain at three minutes to midnight in spite of recent progress with the Iran nuclear agreement and the United Nations Climate Change Conference in Paris (COP 21).

Three minutes to midnight

The Science and Security Board gave the following rationale:

“Last year, the Science and Security Board moved the Doomsday Clock forward to three minutes to midnight, noting: ‘The probability of global catastrophe is very high, and the actions needed to reduce the risks of disaster must be taken very soon.’ That probability has not been reduced. The Clock ticks. Global danger looms. Wise leaders should act—immediately.”

You can read their complete announcement at the following link:

http://thebulletin.org/press-release/doomsday-clock-hands-remain-unchanged-despite-iran-deal-and-paris-talks9122

Also on this website, you will find a detailed chronology of the changes in the Doomsday Clock since its inception in 1947. The following link will take you directly to this timeline:

http://thebulletin.org/timeline

From the beginning, the Doomsday Clock has been a measure of the perceived risk to civilization of nuclear annihilation. In 2007, the Science and Security Board added climate change because of its perceived significant risk to civilization.

Another view of the Doomsday Clock timeline is available in Wikipedia at the following link:

https://en.wikipedia.org/wiki/Doomsday_Clock

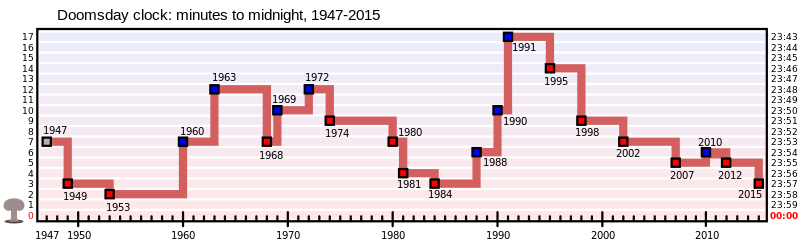
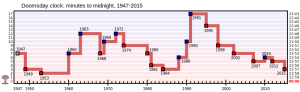
Here you will find the following timeline chart and a compact tabulation of the changes over the years.

Doomsday_Clock_graph

The Iraq War

On 25 January 2016, Stephen Colbert interviewed former Secretary of Defense Donald Rumsfeld, focusing on the Iraq War and the state of knowledge leading up to the decision to go to war. Donald Rumsfeld had previously addressed the state of U.S. intelligence on Iraq in terms of “known knowns” (i.e., things on which we believe we have adequate intelligence), “known unknowns” (i.e., things on which we believe we do not have adequate, or any, intelligence), and “unknown unknowns” (i.e., things we don’t even know we should be concerned about). Stephen Colbert then asked about “unknown knowns”, which he defined as, “things we know, but choose not to let other people know.” The implication was that our leaders in the military and the Executive Branch had important information that they knew had a bearing on the decision to go to war with Iraq, but this information was unknown to other stakeholders in that decision; namely, most members of Congress and the American people. Then the U.S. went to war with Iraq on 20 March 2003. The Doomsday Clock remained at 7 minutes before midnight, even though the U.S. had just saved the world from Saddam Hussein’s weapons of mass destruction.

You can view Stephen Colbert’s interview with Donald Rumsfeld at the following link:

https://www.youtube.com/watch?v=4Z3z7DvoA-M

The War Scare of 1983

I need to expand on Donald Rumsfeld’s and Stephen Colbert’s categories for the state of U.S. intelligence by adding the following: “unknown, should have known better.” I define this as a serious, but avoidable, blunder known only at the highest levels and withheld from the public.

As an example of an “unknown, should have known better,” I present the “War Scare of 1983”. Remember that? I’d be quite surprised if you were even remotely aware of it when it occurred.

NATO forces conducted regular military exercises intended to improve their ability to execute war plans designed to counter a Soviet invasion of Europe. It now appears that only a few high-ranking people in the West knew that some of the Soviet leadership had misinterpreted NATO exercises conducted in the fall of 1983 as a prelude to an actual attack.

To set the stage, note in the timeline chart above that the Doomsday Clock had been reset from 7 minutes to 4 minutes before midnight in early 1981. This was a time of generally heightened tensions between the U.S. and the Soviet Union. Perhaps as a consequence, the Soviets appear to have overreacted when they shot down Korean Airlines flight 007 in August 1983 after it strayed into Russian airspace near Sakhalin Island in the Russian Far East. Some believe that Soviet air defense forces had mistaken this civilian flight for a USAF RC-135 surveillance aircraft that previously had flown a similar route.

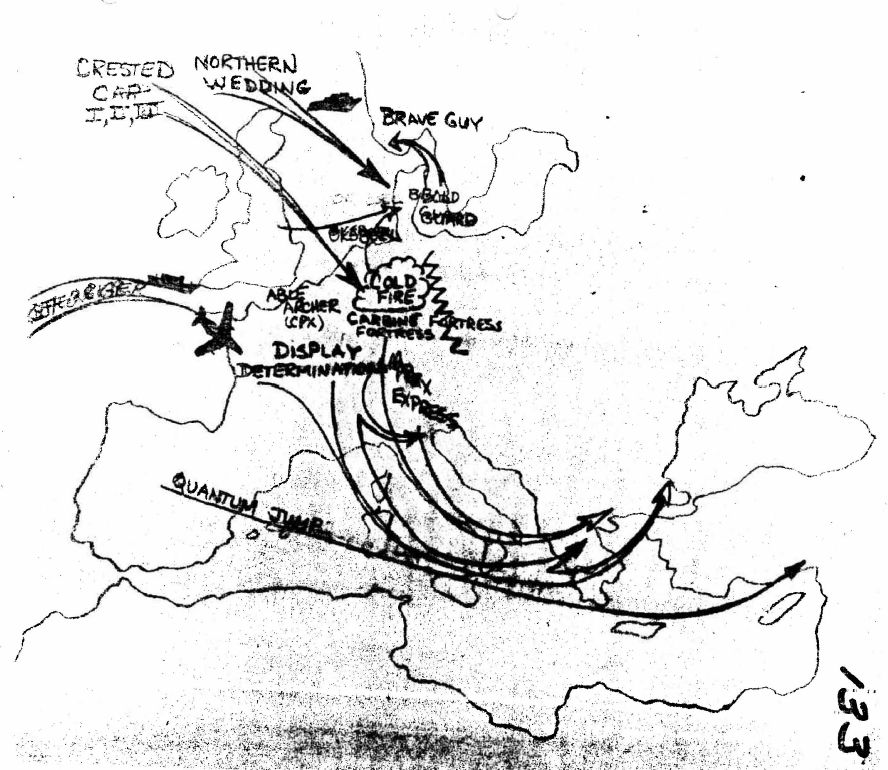
In the fall of 1983, the annual NATO exercise was known as Autumn Forge 83, consisting of at least six exercises. The final exercise, Able Archer 83, was a nuclear command and control exercise intended to simulate an escalating conflict with the Soviet Union leading to the simulated use of nuclear weapons by NATO. Overall, Autumn Forge 83 was a larger exercise than those conducted in previous years and Able Archer 83 was using new nuclear weapons command and control procedures.

In a 21 May 2013 article posted on The National Security Archives website entitled, The 1983 War Scare: “The Last Paroxysm” of the Cold War Part II”, Nate Jones includes the following diagram from an unclassified 9 September 1983 briefing showing the large scale of the Autumn Forge 83 exercise.

Autumn Forge Map

You can read the complete article at the following link:

http://nsarchive.gwu.edu/NSAEBB/NSAEBB427/

A declassified After Action Report issued by the Strategic Air Command (SAC) Seventh Air Division Headquarters on 1 December 1983 addressed the NATO activities conducted as part of Able Archer 83, but presented no information on Soviet reactions during or following the exercise. This After Action Report is available at the following link:

http://nsarchive.gwu.edu/NSAEBB/NSAEBB427/docs/7.%20Exercise%20Able%20Archer%2083%20After%20Action%20Report%201%20December%201983.pdf

I first became aware of the significance of Able Archer 83 via John Prados’ article, “The War Scare of 1983,” in The Quarterly Journal of Military History, Spring 1997 (Vol. 9, Issue 3).

In a 2007 article entitled, “A Cold War Conundrum: The 1983 Soviet War Scare,” author Benjamin Fischer attributed the following statement to Oleg Gordievsky, a KGB colonel who defected to the UK in 1985:

“In the tense atmosphere generated by the crises and rhetoric of the past few months, the KGB concluded that American forces had been placed on alert–and might even have begun the countdown to war…. The world did not quite reach the edge of the nuclear abyss during Operation RYAN. But during ABLE ARCHER 83 it had, without realizing it, come frighteningly close–certainly closer than at any time since the Cuban missile crisis of 1962.”

You can read the complete article in the CIA online library at the following link:

https://www.cia.gov/library/center-for-the-study-of-intelligence/csi-publications/books-and-monographs/a-cold-war-conundrum/source.htm#HEADING1-12

A Special National Intelligence Estimate entitled, “Implications of Recent Soviet Military – Political Activities,” dated 18 May 1984 and declassified in 2010, provides insights into the Soviet reactions to Able Archer 83. You can read / download this redacted document at the following link:

http://www.foia.cia.gov/sites/default/files/document_conversions/17/19840518.pdf

A much more readable overview is available in the 21 May 2013 article entitled, “The Able Archer 83 War Scare: ‘NATO requested initial limited use of nuclear weapons,’” by Nate Jones, in which he states that:

“According to a declassified National Security Agency history…. the ‘period 1982-1984 marked the most dangerous Soviet-American confrontation since the Cuban Missile Crisis.’ The secret history recounts that ‘Cold War hysteria reached its peak’ in the autumn of 1983 with a NATO nuclear-release exercise named Able Archer 83, which…. caused ‘Soviet air units in Germany and Poland [to assume] high alert status with readying of nuclear strike forces.’”

You can read the complete article posted on The National Security Archives website at the following link:

https://nsarchive.wordpress.com/2013/05/21/war-scare-the-real-life-war-game-that-almost-led-to-nuclear-armageddon/

On 24 October 2015, David E. Hoffman, writing for The Washington Post, reported that:

“A nuclear weapons command exercise by NATO in November 1983 prompted fear in the leadership of the Soviet Union that the maneuvers were a cover for a nuclear surprise attack by the United States, triggering a series of unparalleled Soviet military responses…”

The Kremlin, uncertain about U.S. intentions, ordered a series of military measures that appeared to be actual preparations for war. A recently declassified 1990 assessment entitled, “The Soviet ‘War Scare,’” by the President’s Foreign Intelligence Advisory Board concluded:

“In 1983, we may have inadvertently placed our relations with the Soviet Union on a hair trigger…”

The Washington Post obtained a copy of this formerly highly classified (Top Secret – Cover Word – Code Word) assessment, which you can read / download (with modest redactions) at the following link:

http://apps.washingtonpost.com/g/documents/world/read-the-us-assessment-that-concluded-the-soviet-leadership-feared-an-american-nuclear-strike-in-1983/1779/

Obviously, we all survived the War Scare of 1983. Maybe it was better for the public not to know. The Doomsday Clock was adjusted in January 1984 to three minutes before midnight, but not because of Able Archer 83. You can read the rationale for the clock setting on the editorial page in the January 1984 edition of The Bulletin of the Atomic Scientists, which you will find at the following link:

https://books.google.ca/books?id=zAUAAAAAMBAJ&pg=PA2&source=gbs_toc_r&cad=2#v=onepage&q&f=false

If the Science and Security Board had known the details that have surfaced in the past several years about Able Archer 83, I suspect the clock might have been a tick or two closer to midnight for a brief time.

The Doomsday Clock currently is set at three minutes to midnight.