Peter Lobner, updated 20 February 2022
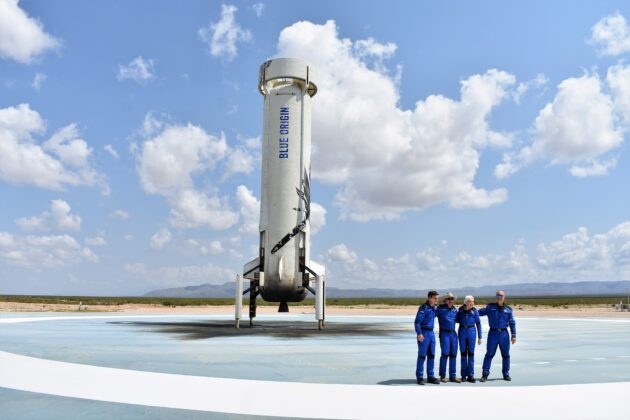
The two-unit Diablo Canyon nuclear power plant, which is owned and operated by Pacific Gas & Electric (PG&E), is the last operating nuclear power station in California. In the five year period from 2016 – 2020, the average annual load factor performance of these power plants was as follows:
- Diablo Canyon 1: 1,138 MWe net @ 91.56% = 1.042 Gigawatt-years (GW-years) generated per year
- Diablo Canyon 2: 1,118 MWe net @ 85.64% = 0.957 GW-years generated per year
Over that five year period, the average annual amount of electricity delivered to the California electrical grid by the two-unit Diablo Canyon nuclear power plant was about 2.0 GW-years (2,000 Megawatt-years or 17,520,000 Megawatt-hours). On a daily basis, that’s an average of about 48,000 MW-hours. This electricity was generated reliably, 24/7 (except during planned outages), with zero carbon emissions.
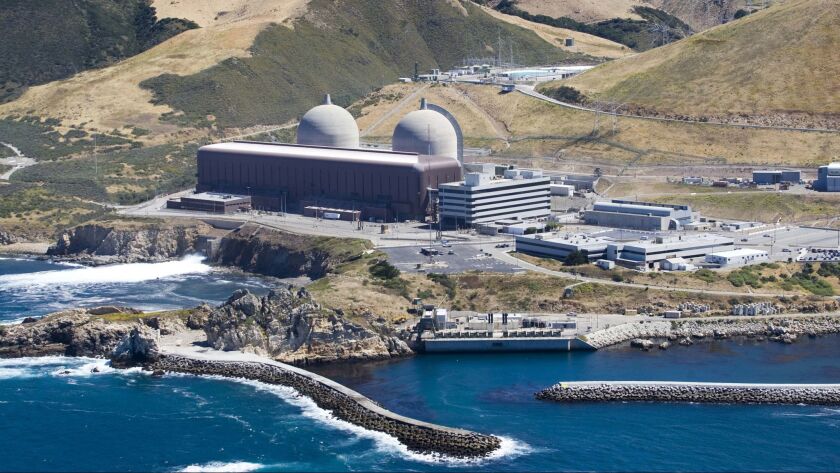
Source: Joe Johnston / San Luis Obispo Tribune via LA Times (2018)
In 2016, I reported (https://lynceans.org/all-posts/the-nuclear-renaissance-is-over-in-the-u-s/):
“On 21 June 2016, PG&E issued a press release announcing that they will withdraw their application to the NRC for a 20-year license extension for the Diablo Canyon 1 & 2 nuclear power plants and will close these plants by 2025 when their current operating licenses expire. PGE will walk away from about 41 GW-years of carbon-free electric power generation.”
The shutdown plan was approved by the California Public Utilities Commission in January 2018.
In 2019, PG&E reported that their mix of generation sources (owned and purchased from a third-party) looked like this:
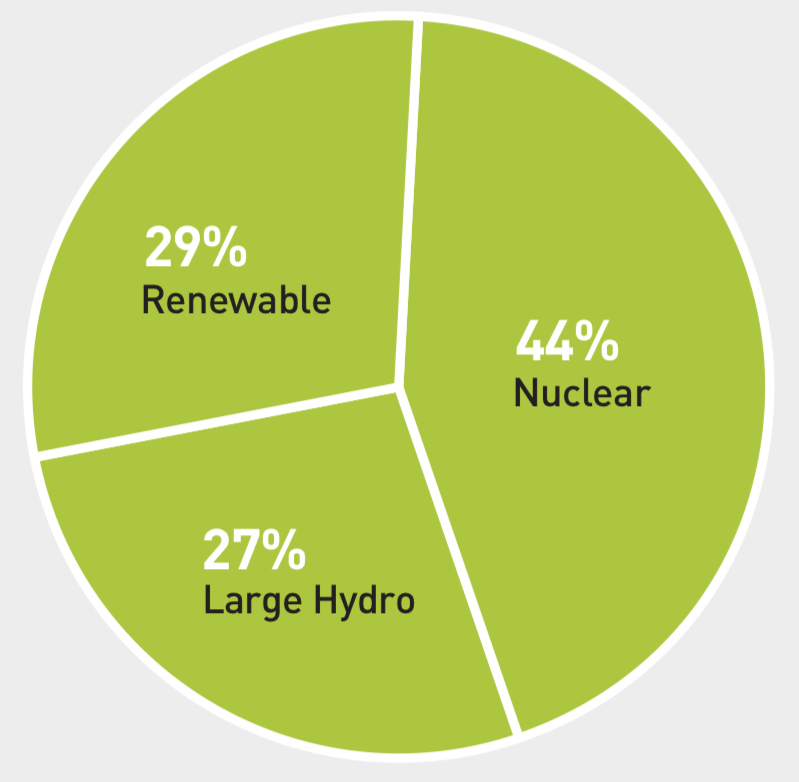
A few interesting points about this PG&E generation source chart:
- Nuclear power generation is the biggest piece of the pie chart. Shutdown of Diablo Canyon by 2025 will eliminate this piece.
- Renewables include wind, solar, small hydro, geothermal and biomass / waste. Batteries are not included because they are energy storage devices, not energy generation sources. The energy stored in a grid-scale battery comes from a generator, or simply, from the grid.
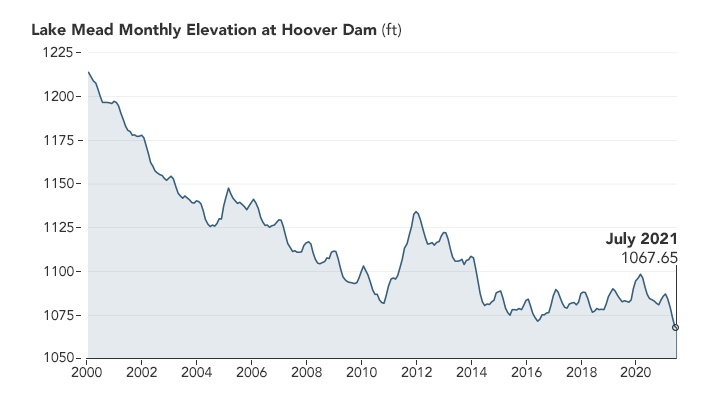
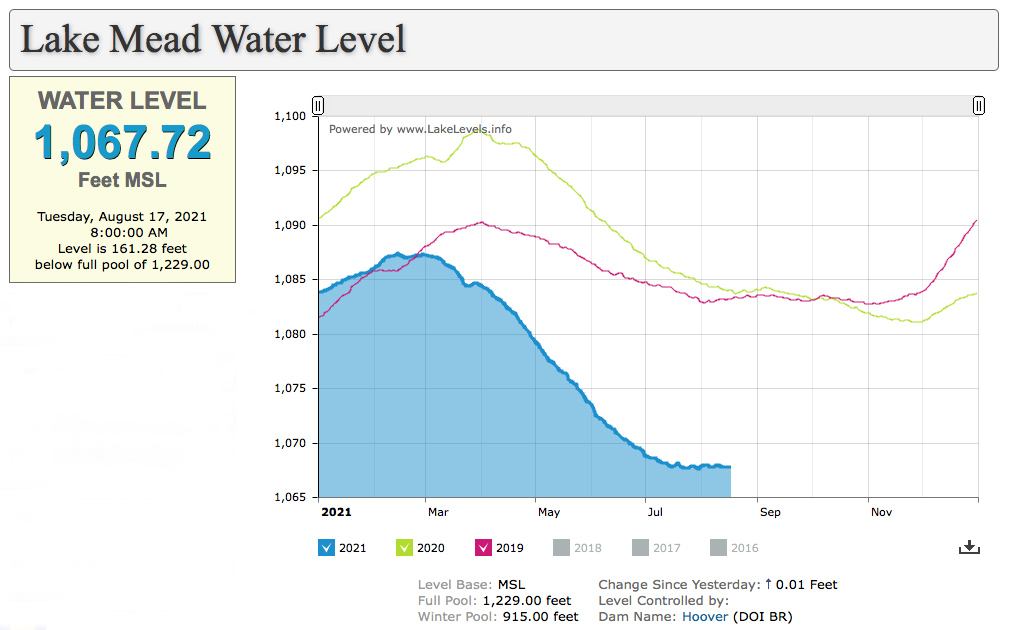
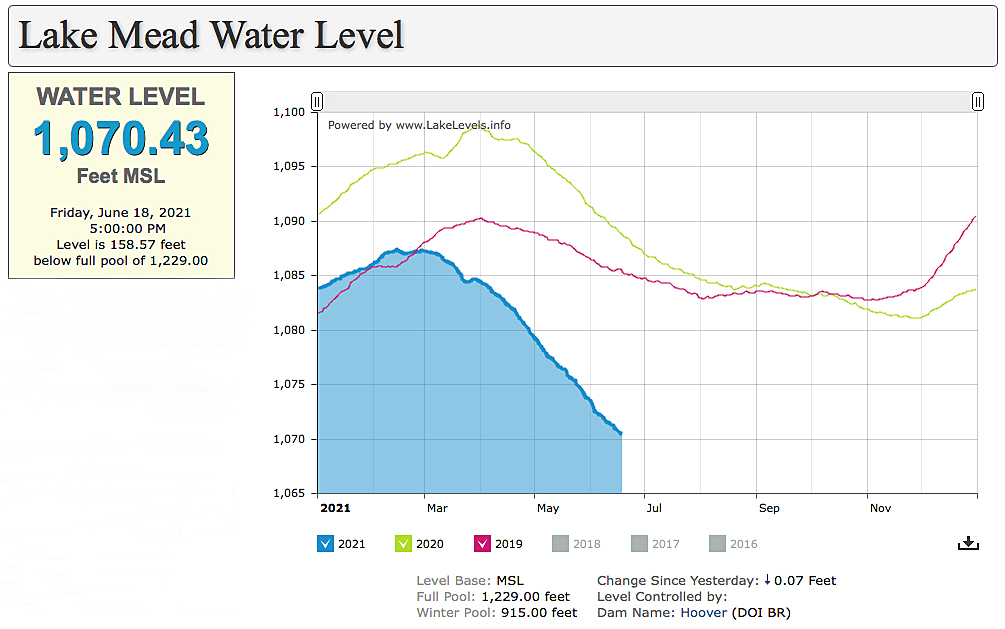
- Large hydro depends on the associated reservoirs having enough water in them. The Edward Hyatt hydroelectric power plant at Lake Oroville (California’s second-largest reservoir) was shut down in August 2021 for the first time since it opened in 1967 because of low water levels during the persistent drought affecting the US West. Power production at Oroville resumed in January 2022 with only a single hydroelectric generator, after heavy winter precipitation increased lake water level. If the drought continues, the large hydro piece of the pie chart will shrink.
Another point is that the PG&E generation source mix is quite different from the California state-wide generation source mix reported by the California Energy Commission in 2020 and shown in the following pie chart. Not all of the generation sources represented in this chart are physically located in California (more on that later).
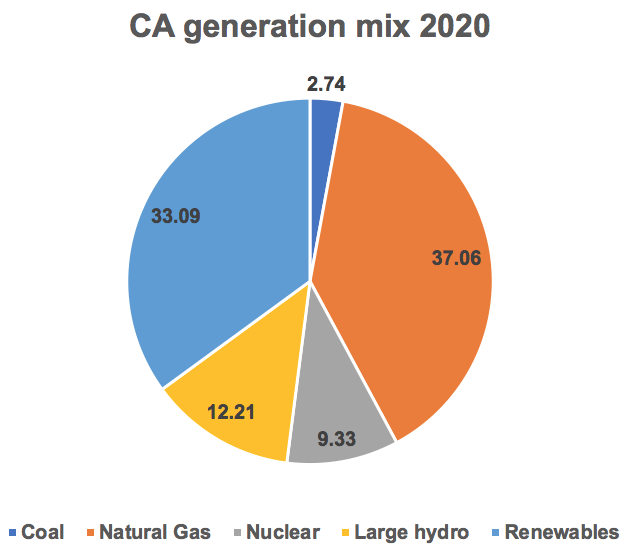
Diablo Canyon has a disproportionate impact on the PG&E generation mix because they own the nuclear power plant and they take credit for its entire net generation. State-wide, nuclear power makes up only 9.33% of the state generation mix in a much larger electric power market.
When Diablo Canyon is shut down in 2025, I would think that the PG&E energy generation mix will look a lot more like the California state-wide generation mix, with most of the nuclear power generation share being replaced, at least in the short term, by fossil fuel-powered generators.
In January 2022, PG&E announced that they have a plan: “PG&E Corp. said it has reached agreements to install nine new battery energy storage projects as part of a push to replace a retiring nuclear power plant and help decarbonize California’s power grid.”
So, let me see if I’ve got this right. PG&E is going to use grid-scale storage batteries that produces zero carbon emissions during their operation to partially replace a nuclear power generating station that produces zero carbon emissions during 24/7 operation. Where will the power come from to charge those batteries? It’ll come from the California Independent System Operator (CAISO) grid, which has the California state-wide generation source mix shown above, with almost 40% coming from fossil fuel-powered generators in 2020, and likely to increase after Diablo Canyon’s retirement. So, one charge-discharge cycle of a grid-scale battery isn’t carbon-free.
PG&E further announced, “The proposed projects would have a total capacity of about 1,600 megawatts, which would bring its total battery energy storage capacity to more than 3,300 gigawatts by 2024…”
On the surface, that sounds like an impressive amount of battery capacity, but let’s put it in perspective.
The former Moss Landing fossil power station on Monterey Bay was decommissioned and transformed into a grid-scale energy storage facility. In August 2021, after completing Phase II of the transformation, the facility was operating with a capacity of 400 MW / 1,600 MW-hours, making it the world’s largest grid-storage project. The facility’s owner, Vistra Energy, said the Moss Landing facility could be expanded to a capacity of up to 1,600 MW / 6,000 MWh.
At its current discharge capacity of 400 MW, the Moss Landing batteries could discharge their full energy storage capacity of 1,600 MW-hours in about four hours. Then the battery is “empty” and needs to be recharged from the CAISO grid (as we discussed, that’s about 40% from fossil-powered generation sources in 2020). Of course, a grid-storage facility wouldn’t be operated regularly on such a stressful cycle. But my point is that the world’s largest grid-storage project is be capable of delivering no more than 3.3% of the 48,000 MW-hours of electricity delivered daily, 24/7, with zero carbon emissions, by the Diablo Canyon nuclear power plant.
California has a huge, and growing, energy problem of its own making. With Diablo Canyon and several fossil-powered generators scheduled for retirement in the next few years, the state needs new generating capacity. However, the development time scale for a new large generating facility in California, especially considering the state’s challenging regulatory environment, might have to be measured in decades.
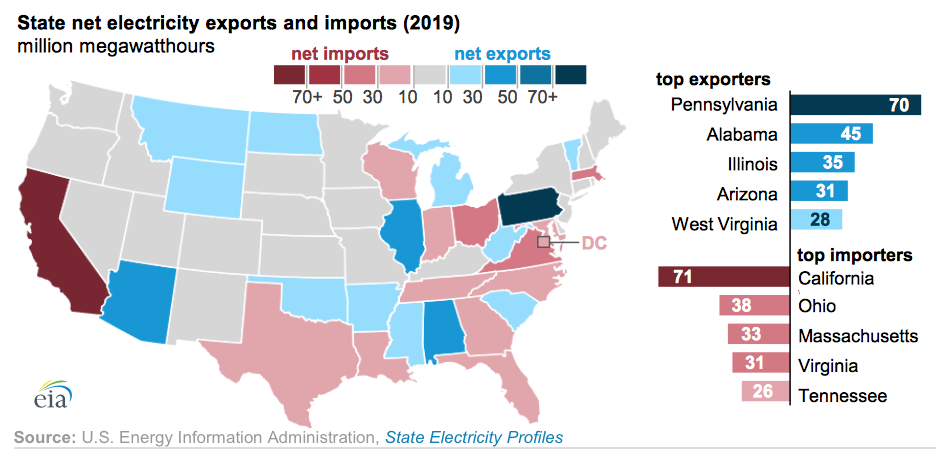
One of California’s solutions to its shortfall of electrical generating capacity is to import electric power from other states and nations. The U.S. Energy Information Administration (EIA) reported that California was the largest net electricity importer, by a wide margin, of any state in 2019. Its net electricity imports were 70.8 million MW-hours, or 25% of the state’s total electricity usage. California utilities partly own and import power from several power plants in Arizona and Utah. In addition, California’s electricity imports include hydroelectric power from the Pacific Northwest and power from fossil and wind generators in Mexico.
Grid-scale battery storage is not going to solve the state’s shortfall of electrical generating capacity. Rather, the batteries are a means to mitigate short-term demand peaks and help stabilize the grid as generators attempt to match energy supply with demand.
Another mitigating measure used by CAISO is a “flex alert,” which asks consumers to cut back on electricity usage and move their electricity usage to off-peak hours, typically after 9 pm. CAISO issued five flex alerts in 2020 and eight in 2021. When a grid-scale battery is discharged during a flex alert, recharging it would add a large load on an already strained grid; probably not a good idea.
California is throwing away valuable 24/7 generating capacity and replacing it with intermittent renewable generators, with grid-scale energy storage facilities to provide short-term mitigation that doesn’t address the real underlying problem. There is no substitute for adequate generating capacity, sized to meet the current and future demands of businesses and individuals as we try to move together into a more electrified future.
Failing that, I can see increasing electric power rates, more flex alerts, and in California, I wouldn’t be surprised to see some form of legislated energy rationing coupled with higher energy use taxation. So much for that vision of a more electrified future.
Don’t sell you gasoline or diesel-powered car yet. You may need it during the next flex alert.
20 February 2022 update: Moss Landing battery fires
Since becoming operational, Vistra Energy’s Moss Landing battery storage facility on Monterey Bay experienced two damaging fire events in lithium-ion battery packs. A fire on 4 September 2021 set off fire suppression system sprinklers that damaged about 7,000 batteries. Vistra Energy reported corrective actions following this fire on 21 January 2022. Another fire on 13 February 2022 resulted in 10 melted lithium-ion battery packs. The latest fire event was contained by the facility’s fire suppression system. Vistra reported that it was looking further into the latest incident, while the Moss Landing facility remains offline during the investigation.
For more information
- Rob Nikolewski, “Regulators vote to shut down Diablo Canyon, California’s last nuclear power plant,” Los Angeles Times, 11 January 2018: https://www.latimes.com/business/la-fi-diablo-canyon-nuclear-20180111-story.html
- “Diablo Canyon 1, United States Of America,” World Nuclear Association, Reactor Database: https://www.world-nuclear.org/reactor/default.aspx/DIABLO%20CANYON-1
- “Diablo Canyon 2, United States Of America,” World Nuclear Association, Reactor Database: https://www.world-nuclear.org/reactor/default.aspx/DIABLO%20CANYON-2
- “Where your electricity comes from,” PG&E: https://www.pge.com/pge_global/common/pdfs/your-account/your-bill/understand-your-bill/bill-inserts/2020/1220-PowerContent-ADA.pdf
- “2020 Total System Electric Generation,” California Energy Commission, Energy Assessments Division: https://www.energy.ca.gov/data-reports/energy-almanac/california-electricity-data/2020-total-system-electric-generation
- Mike Chediak, “PG&E Plans to Add a Lot of Batteries to California’s Grid,” Bloomberg, 24 January 2022: https://www.bnnbloomberg.ca/pg-e-plans-to-add-a-lot-of-batteries-to-california-s-grid-1.1712557
- “Vistra Completes Expansion of Battery Energy Storage System at its Flagship California Facility,” Vistra Corp. news release, 19 August 2021: https://investor.vistracorp.com/2021-08-19-Vistra-Completes-Expansion-of-Battery-Energy-Storage-System-at-its-Flagship-California-Facility#assets_43_196-4
- Katherine Blunt, “California Scrambles to Find Electricity to Offset Plant Closures
- State contends with coming loss of gas-fired power plants and its last remaining nuclear facility in transition to renewable energy, Wall Street Journal, 16 October 2021: https://www.wsj.com/articles/california-scrambles-to-find-electricity-to-offset-plant-closures-11634376600
- “California was the largest net electricity importer of any state in 2019,” U.S. Energy Information Administration (EIA): https://www.eia.gov/todayinenergy/detail.php?id=46156
- “Summary of Alert, Warning, Emergency, and Flex Alert Notices Issued from 1998 to Present,” CAISO: https://www.caiso.com/Documents/FlexAlertNoticesIssuedFrom1998-Present.pdf
- Loukia Papadopoulos, “Lithium-ion battery goes offline due to overheating, for the second time,” Interesting Engineering, 19 February 2022: https://interestingengineering.com/lithium-ion-battery-overheating