Category Archives: Global Climate

New From The National Academies Press

Peter Lobner

My 14 March 2015 post provided an introduction to The National Academies Press (NAP), which is a very good source for reports and other documents on the following topics:

  • Agriculture
  • Behavioral & social sciences
  • Biographies & autobiographies
  • Biology & life sciences
  • Computers & information technology
  • Conflict & security issues
  • Earth sciences
  • Education
  • Energy & energy conservation
  • Engineering & technology
  • Environment & environmental studies
  • Food & nutrition
  • Health & medicine
  • Industry & labor
  • Mathematics, chemistry & physics
  • Policy for science & technology
  • Space & aeronautics
  • Transportation

Most of the NAP reports can be downloaded for free as pdf files if you establish a MyNAP account. If you haven’t set up such an account, you can do so at the following link:

http://www.nap.edu/content/using-mynap

With this account, you also can get e-mail notifications of new NAP reports.

For those of you who have not set up a MyNAP account, here are several new NAP reports that I found to be interesting.

Infusing Ethics into the Development of Engineers (2016)

Ethical practice in engineering is critical for ensuring public trust in the field and in its practitioners, especially as engineers increasingly tackle international and socially complex problems that combine technical and ethical challenges. This report aims to raise awareness of the variety of exceptional programs and strategies for improving engineers’ understanding of ethical and social issues and provides a resource for those who seek to improve ethical development of engineers at their own institutions.

NAP-infuse engineers  Source: NAP

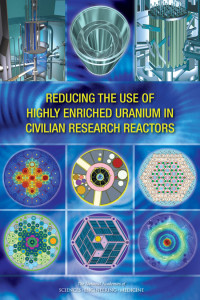
Reducing the Use of Highly Enriched Uranium in Civilian Research Reactors (2016)

Today, 74 civilian research reactors around the world, including 8 in the U.S., use or are planning to use HEU fuel. In the past decades, many civilian reactors around the world have been either shut down or converted from HEU to low enriched uranium fuel. Despite this progress, the large number of remaining HEU-fueled reactors demonstrates that further progress is needed on a worldwide scale.

Print  Source: NAP

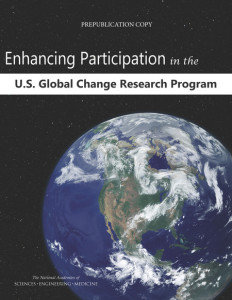
Enhancing Participation in the U.S. Global Change Research Program (2016)

The U.S. Global Change Research Program (USGCRP) is a collection of 13 Federal entities charged by law to assist the U.S. and the world to understand, assess, predict, and respond to human-induced and natural processes of global change. As the understanding of global change has evolved over the past decades and as demand for scientific information on global change has increased, the USGCRP has increasingly focused on research that can inform decisions to cope with current climate variability and change, to reduce the magnitude of future changes, and to prepare for changes projected over the coming decades.

NAP-global change  Source: NAP

Frontiers of Engineering – Reports on Leading-Edge Engineering from the 2015 Symposium (2016)

This volume presents papers on the following topics covered at the National Academy of Engineering’s 2015 U.S. Frontiers of Engineering Symposium:

  • Cyber security and privacy
  • Engineering the search for Earth-like exoplanets
  • Optical and mechanical metamaterials
  • Forecasting natural disasters

NAP-frontiers of engg 2015  Source: NAP

There are many other annual reports in the NAP “Frontiers of Engineering” series, dating back to at least 1997, and covering many other engineering topics.

I hope you’ll take some time and browse the NAP library for documents that are of interest to you. You can start your browsing, without a MyNAP account, at the following link:

http://www.nap.edu

Another Record-setting Year for Global Temperature

Peter Lobner

The National Aeronautics and Space Administration’s (NASA) Goddard Institute for Space Studies (GISS) released the results of an analysis by NASA and National Oceanic and Atmospheric Administration (NOAA) that showed that globally-averaged temperature in 2015 was the highest since modern record keeping began in 1880. You can read the NOAA / NASA press release at the following link:

http://www.giss.nasa.gov/research/news/20160120/

You can download a copy of the more detailed NOAA / NASA briefing at the following link:

http://www.giss.nasa.gov/research/news/20160120/noaa_nasa_global_analysis_2015.pdf

The analysis shows that globally-averaged temperature in 2015 exceeded the previous mark set in 2014 by 0.23 degrees Fahrenheit (0.13 degrees Celsius) and continued a warming trend, as shown in the following graph.

gistemp_graph_2015Source: NASA Goddard

In this graph, the zero on the y-axis is the average temperature for a 30-year period from 1951 to 1980. The trend lines show results for El Niño years (orange), La Niña years (blue), and all years (dashed line). The 2015 globally-averaged temperature was:

  • 57° F (0.87° C) above the 1951 to 1980 30-year (baseline) average, and
  • 62° F (0.90° C) above the 1901 to 2000 100-year (20th century) average

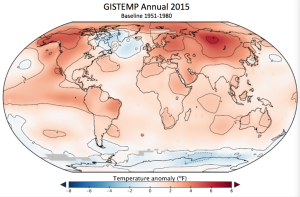
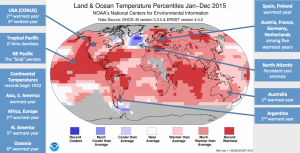
The distribution of global temperatures relative to the 1951 – 80 baseline is shown in the following charts.

NOAA:NASA briefing_1_Jan2016

NOAA:NASA briefing_2_Jan2016Source, both graphics: NOAA / NASA Annual Global Analysis for 2015

The NOAA / NASA press release cited above includes an animation that helps visualize Earth’s long-term warming trend based on data from 1880 to 2015. NOAA / NASA note that phenomena such as El Niño or La Niña, which warm or cool the tropical Pacific Ocean, can contribute to short-term variations in global average temperature. A warming El Niño was in effect for most of 2015

The full 2015 surface temperature data set and the complete methodology used by NOAA / NASA in their analysis are available to the public on the GISS Surface Temperature Analysis (GISTEMP) webpage at the following link:

http://data.giss.nasa.gov/gistemp/

The availability of the data and the analytical methodology allows the NOAA / NASA results to be subject to independent scrutiny. I commend NOAA and NASA for their openness in this matter, which will aid in reaching scientific consensus on the NOAA / NASA results.

This behavior by NOAA / NASA is a stark contrast to the United Nations (UN) Intergovernmental Panel on Climate Change (IPCC), which has failed to provide full public access to their underlying data and analytical methodologies and has been criticized for failing to rigorously apply the scientific method in their work. To help understand why the IPCC claim of “scientific consensus” is without merit, the Nongovernmental International Panel on Climate Change (NIPCC) published the book, “Why Scientists Disagree About Global Warming,” on 30 November 2015. You can download this document for free at the following link:

https://www.heartland.org/policy-documents/why-scientists-disagree-about-global-warming

To help put this in perspective, I thank cartoonist Wiley Miller for the following timely and insightful cartoon published on 20 January 2016. I challenge you to apply this cartoon to your understanding of the climate change debate.

Cartoon Science_Jan2016Source: San Diego Union Tribune

Just What are Those U.S. Scientists Doing in the Antarctic and the Southern Ocean?

Peter Lobner

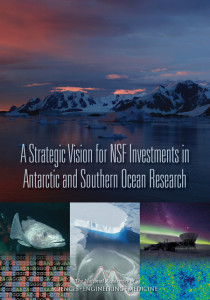
The National Academies Press (NAP) recently published the report, “A Strategic Vision for NSF Investments in Antarctic and Southern Ocean Research”, which you can download for free at the following link if you have established a MyNAP account:

http://www.nap.edu/catalog/21741/a-strategic-vision-for-nsf-investments-in-antarctic-and-southern-ocean-research

Print Source: NAP

NSF states that research on the Southern Ocean and the Antarctic ice sheets is becoming increasingly urgent not only for understanding the future of the region but also its interconnections with and impacts on many other parts of the globe. The research priorities for the next decade, as recommended by the Committee on the Development of a Strategic Vision for the U.S. Antarctic Program; Polar Research Board; Division on Earth and Life Studies; National Academies of Sciences, Engineering, and Medicine, are summarized below:

  • Core Program: Investigator-driven basic research across a broad range of disciplines
    • NSF gives the following rationale: “…it is impossible to predict where the next major breakthroughs or advances will happen. Thus to ensure that the nation is well positioned to take advantage of such breakthroughs, it is important to be engaged in all core areas of scientific research.”
      • NSF notes, “…discoveries are often made by single or small groups of PIs thinking outside the box, or with a crazy new idea, or even just making the first observations from a new place.”
    • Examples of basic research that have led to important findings include:
      • Ross Sea food chain is affected by a high abundance of predator species (whales, penguins and toothfish) all competing for the same limited resource: krill. Decline or recovery of one predator population can be seen in an inverse effect on the other predator populations.  This food chain response is not seen in other areas of the Antarctic ice shelf where predator populations are lower, allowing a larger krill population that adequately supports all predators.
      • Basic research into “curious” very-low frequency (VLF) radio emissions produced by lightning discharges led to a larger program (with a 21.2-km-long VLF antenna) and ultimately to a better understanding of the behavior of plasma in the magnetosphere.
  • Strategic, Large Research Initiatives –  selection criteria:
    • Primary filter: compelling science – research that has the potential for important, transformative steps forward in understanding and discovery
    • Subsequent filters: potential for societal impact; time-sensitive in nature; readiness / feasibility; and key area for U.S. and NSF leadership.
    • Additional factors: partnership potential; impact on program balance; potential to help bridge existing disciplinary divides
  • Strategic, Large Research Initiative – recommendations::
    • Priority I: The Changing Antarctic Ice Sheets Initiative to determine how fast and by how much will sea level rise?
      • A multidisciplinary initiative to understand why the Antarctic ice sheets is changing now and how they will change in the future.
      • Will use multiple records of past ice sheet change to understand rates and processes.
    • Priority II: How do Antarctic biota evolve and adapt to the changing environment?
      • Decoding the genomic (DNA) and transcriptomic (messenger RNA molecules) bases of biological adaptation and response across Antarctic organisms and ecosystems.
    • Priority III: How did the universe begin and what are the underlying physical laws that govern its evolution and ultimate fate?
      • A next-generation cosmic microwave background (CBM) program that builds on the current successful CMB program using telescopes at the South Pole and the high Atacama Plateau in Chile and possibly will add a new site in the Northern Hemisphere to allow observations of the full sky

You will find detailed descriptions of the Priority I to III strategic programs in the Strategic Vision report.

New Report Quantifies the Value of Nuclear Power Plants to the U.S. Economy and Their Contribution to Limiting Greenhouse Gas (GHG) Emissions

Peter Lobner

On 2 July 2015, I made a long post entitled, “EPA Clean Power Plan Proposed Rule Does Not Adequately Recognize the Role of Nuclear Power in Greenhouse Gas Reduction.”

On 7 July 2015, Nuclear Matters (http://www.nuclearmatters.com) issued a related,  comprehensive report, prepared by economists from The Brattle Group (http://www.brattle.com), that quantifies the significant value of nuclear power plants to the U.S. economy and the contribution made to limiting greenhouse gas (GHG) emissions. Their report’s findings include:

  • U.S. nuclear energy plants contribute $60 billion annually to gross domestic product (GDP), in addition to other economic and societal benefits.
  • The nuclear industry accounts for about 475,000 full-time jobs (direct and secondary).
  • Energy generated from nuclear plants avoids emissions that otherwise would have been generated by fossil power plants.
    • 573 million tons of carbon dioxide (CO2) emissions, worth an additional $25 billion annually if valued at the U.S. government’s estimate for the social cost of carbon.
    • 650,000 tons of nitrogen oxides (NOX) and over one million tons of sulfur dioxide (SO2) emissions annually, together valued at $8.4 billion using the National Academy of Science’s externality estimates.
  • Nuclear power helps keep electricity prices low. Without nuclear power, retail electricity rates could increase by about 6% on average. Keeping electricity prices low is the primary means by which nuclear power boosts the economy.
  • Provides $10 billion in federal tax revenues and $2.2 billion in state tax revenues annually.

You can download the report, entitled, The Nuclear Industry’s Contribution to the U.S. Economy” at the link below.  The report also describes the modeling techniques used to estimate economic value with and without the contributions from nuclear power.

http://www.brattle.com/system/news/pdfs/000/000/895/original/The_Nuclear_Industry’s_Contribution_to_the_U.S._Economy.pdf?1436280444

Brattle-Group-nuc-power-economics-report-7-Jul-15 R1

U.S. Drought Indicators Derived From GRACE Satellite Data

Peter Lobner

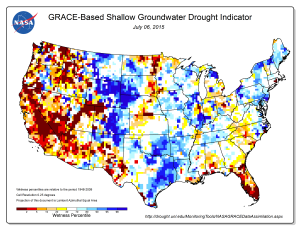
Scientists at NASA’s Goddard Space Flight Center generate groundwater and soil moisture drought indicators each week. They are based on terrestrial water storage observations derived from GRACE satellite data and integrated with other observations, using a sophisticated numerical model of land surface water and energy processes. You can see current results for the continental U.S. at the following link to the National Drought Mitigation Center (NMDC), University of Nebraska-Lincoln, website:

http://drought.unl.edu/MonitoringTools/NASAGRACEDataAssimilation.aspx

Drought indicator maps for 6 July 2015 are reproduced below for:

  • Surface soil moisture
  • Root zone soil moisture
  • Shallow groundwater

The drought in the U.S. West looks most severe in the shallow groundwater map.

You can find information on the twin GRACE (Gravity Recovery and Climate Experiment) satellites at the following link:

http://www.csr.utexas.edu/grace/

GRACE_6Jul15_SFSM

GRACE_6Jul15_RTZSM

GRACE_6Jul15_GWS

EPA Clean Power Plan Proposed Rule Does Not Adequately Recognize the Role of Nuclear Power in Greenhouse Gas Reduction

Peter Lobner

On June 2, 2014, the U.S. Environmental Protection Agency (EPA) proposed what they called, “a common sense plan to cut carbon pollution from power plants.”  You can access the Clean Power Plan Proposed Rule and many related documents at the following EPA link:

http://www2.epa.gov/carbon-pollution-standards/clean-power-plan-proposed-rule

This Plan proposes to limit carbon emissions from existing fossil fuel fired electric generating units, including steam generating, integrated gasification combined cycle, or stationary combustion turbines (in either simple-cycle or combined-cycle configuration) operating or under construction by January 8, 2014. Main points of the Clean Power Plan include:

  • Wind and solar power are the preferred EPA options.
  • Natural gas is an interim solution.
  • New nuclear capacity is not a compliance option.
  • The EPA allows compliance credit for:
    • New nuclear plants currently under construction, and
    • Preservation of existing nuclear plants that might otherwise be retired

I’ve already formed my opinion on the Clean Power Plan. To help you form your opinion, I recommend that you refer to the following recent analyses by four respected government and industry organizations that have reviewed the Clean Power Plan.

Institute for Energy Research (IER)

On 15 June 2015, the IER issued the results of their analysis entitled, EPA’s Clean Power Plan Ignores New Nuclear as a Compliance Option. IER concluded that the compliance formulae in the Clean Power Plan are biased toward new wind and solar power development. Deployment of these technologies, which currently are not capable of delivering reliable capacity, will decrease the reliability of the electric grid. IER also concluded that the Clean Power Plan will result in much higher electricity prices for all American consumers, while having only a marginal impact on global temperature based on EPA’s computer models.

You can read the IER analysis at the following link:

http://instituteforenergyresearch.org/analysis/epas-clean-power-plan-ignores-new-nuclear-as-a-compliance-option/

National Association of Clean Air Agencies (NACAA)

On 21 May 2015, the NACAA issued a report entitled, Implementing EPA’s Clean Power Plan: A Menu of Options, containing 25 chapters, each of which explores a particular approach to greenhouse gas (GHG) reduction in the electric power sector.  NACAA is a nonpartisan, nonprofit association of air pollution control agencies in 41 states, the District of Columbia, four territories and 116 metropolitan areas.  Each chapter of their Menu of Options includes a brief descriptions of: (1) the option and it’s pros and cons; (2) the regulatory backdrop, policy underpinnings, implementation experience, and GHG reduction potential associated with the option; and (3) benefits of the option to society and the utility system, including costs and cost-effectiveness. In the last chapter, a variety of emerging technologies and other policy options for reducing GHG emissions are addressed.

An interesting table and two figures included in Chapter 6 of the Menu of Options are reproduced below.
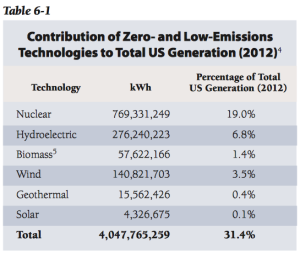
NACAA Table 6-1 Source: NACAA

In 2012, electric power generation technologies with zero or low GHG emissions accounted for 31.4% of the USA’s total generating capacity. The data in Table 6-1 shows that 82.2% of the zero or low GHG emission generating capacity came from nuclear and hydroelectric power plants. The remaining low-emission generation capacity came from biomass, wind, geothermal, and solar power plants.
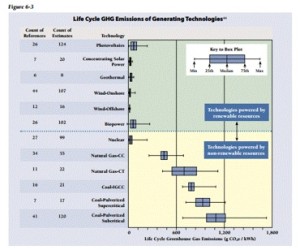
NACAA Figure 6-3Source: NACAA

In Figure 6-3, “life cycle GHG emissions” include those associated with operation as well as construction, fabrication, and fuel processing.  While nuclear power is not included among the “technologies powered by renewable resources”, it’s clear in Figure 6-3 that nuclear power meets the GHG reduction performance of the other technologies using renewable resources.
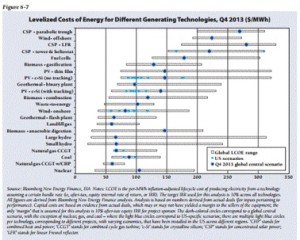
NACAA Figure 6-7  Source: NACAA

In Figure 6-7, note the relative cost-of-energy differential between nuclear power and fossil power. This difference makes it difficult for nuclear power plants to compete head-to-head with coal and natural gas merchant power plants and encourages the early retirement of some nuclear power plants on economic grounds.  While most renewable power sources have even higher costs-of-energy, various financial schemes subsidize their power generation.

You can download individual chapters or the entire NACAA Menu of Options at the following link:

http://www.4cleanair.org/NACAA_Menu_of_Options

U.S. Energy Information Administration (EIA)

On 22 May 2015, the EIA released their analysis of the Clean Power Plan. The EIA analysis supports the IER finding that the Clean Power Plan will result in much higher electricity prices for all American consumers, even in a scenario that allows GHG reduction credit for new nuclear generation.

You can read the EIA press release at the following link:

http://www.eia.gov/analysis/requests/powerplants/cleanplan/

You also can download a PDFs copy of the May 2015 EIA report, Analysis of the Impacts of the Clean Power Plan, at the following link:

http://www.eia.gov/analysis/requests/powerplants/cleanplan/pdf/powerplant.pdf

Nuclear Energy Institute’s (NEI)

To address the “clean power” attributes of nuclear power, I refer you to an NEI Knowledge Center webpage: Environment: Emissions Prevented, which you will find at the following link:

http://www.nei.org/Knowledge-Center/Nuclear-Statistics/Environment-Emissions-Prevented

Here you’ll find a link to data on the amount of sulfur dioxide, nitrogen oxides, and carbon dioxide emissions avoided in the U.S. during the years 1995 to 2014 by virtue of having about 20% of U.S. electric power generated by nuclear power plants instead of fossil power plants. NEI reports the total avoided emissions for this period as follows:

  • Sulfur dioxide: 57.75 million short tons (52.4 million metric tons)
  • Nitrogen oxides: 22.92 million short tons (20.8 million metric tons)
  • Carbon dioxide: 13,063.6 million short tons (11,851 million metric tons)

On this website, NEI states:

“Nuclear energy facilities avoided 595 million metric tons of carbon dioxide in 2014 across the U.S. This is nearly as much carbon dioxide as is released from nearly 135 million cars, which is more than all U.S. passenger cars. The U.S. produces more than five billion metric tons of carbon dioxide each year.

Without the emission avoidances from nuclear generation, required reductions in the U.S. would increase by more than 50 percent to achieve targets under the Kyoto Protocol.”

2013 paper, “Prevented Mortality and Greenhouse Gas Emissions from Historical and Projected Nuclear Power”.

Supporting the above NEI position on the GHG reduction merits of nuclear power, there is a related 2013 article by NASA scientists from Goddard Institute for Space Studies and Columbia University entitled, “Prevented Mortality and Greenhouse Gas Emissions from Historical and Projected Nuclear Power”.  You can read a short article on this paper on the Scientific American website at the following link:

http://blogs.scientificamerican.com/the-curious-wavefunction/nuclear-power-may-have-saved-1-8-million-lives-otherwise-lost-to-fossil-fuels-may-save-up-to-7-million-more/

You also can read the complete paper at the following link:

http://pubs.acs.org/doi/pdf/10.1021/es3051197

In their study, authors Pushker A. Kharecha and James E. Hansen used historical production data from 1971 to 2009 and calculated that global nuclear power has prevented an average of 1.84 million air pollution-related deaths and 64 gigatonnes of CO2-equivalent (GtCO2-eq) greenhouse gas (GHG) emissions that would have resulted from fossil fuel burning. From their analysis, the authors drew the following conclusion:

“In conclusion, it is clear that nuclear power has provided a large contribution to the reduction of global mortality and GHG emissions due to fossil fuel use. If the role of nuclear power significantly declines in the next few decades, the International Energy Agency asserts that achieving a target atmospheric GHG level of 450 ppm CO2-eq would require “heroic achievements in the deployment of emerging low- carbon technologies, which have yet to be proven. Countries that rely heavily on nuclear power would find it particularly challenging and significantly more costly to meet their targeted levels of emissions.”

So, what do you think about the EPA’s proposed Clean Power Plan? Is this the “common sense plan to cut carbon pollution from power plants” promised by EPA; a politically motivated piece of crap designed to kill the nuclear and coal power industries; or something in between?

Kurzgesagt Explains the Fermi Paradox: Where are all the aliens?

Peter Lobner, updated 17 November 2022

Kurzgesagt (German for “in a nutshell“) is a Munich-based design studio with a distinctive perspective on design and animation in the fields of education, science and commerce.  For background information on Kurzgesagt, visit their website here: https://kurzgesagt.org/agency/

You’ll find their YouTube channel with a library of briefings at the following link: https://www.youtube.com/channel/UCsXVk37bltHxD1rDPwtNM8Q

From here you can navigate to many intriguing and entertaining animated briefings.  Four Kurzgesagt briefings address the following questions regarding extraterrestrial life:

“The universe is unbelievably big – trillions of stars and even more planets. Soo… there just has to be life out there, right? But where is it? Why don’t we see any aliens? Where are they? And more importantly, what does this tell us about our own fate in this gigantic and scary universe?”

I hope you’ll enjoy these Kurzgesagt briefings:

The Fermi Paradox — Where Are All The Aliens? Part 1:  https://www.youtube.com/watch?v=sNhhvQGsMEc

The Fermi Paradox — Where Are All The Aliens? Part 2:  https://www.youtube.com/watch?v=1fQkVqno-uI

The Great Filter:  Why Alien Life Would be our Doom:  https://www.youtube.com/watch?v=UjtOGPJ0URM

What Do Alien Civilizations Look Like? The Kardashev Scale:  https://www.youtube.com/watch?v=rhFK5_Nx9xY

Aliens under the Ice – Life on Rogue Planets:  https://www.youtube.com/watch?v=M7CkdB5z9PY

For more information

Arctic Matters – The Global Connection to Changes in the Arctic

Peter Lobner

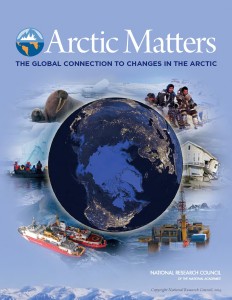
Arctic Matters is new public education resource produced by the Polar Research Board of the National Research Council (NRC) and published by National Academies Press (NAP). It draws upon a large collection of peer-reviewed NRC reports and other national and international reports to provide a brief, reader-friendly primer on the complex ways in which the changes currently affecting the Arctic and its diverse people, resources, and environment can, in turn, affect the entire globe.

image     Source: NAP

You can download this booklet for free from NAP at the following link:

http://www.nap.edu/catalog/21717/arctic-matters-the-global-connection-to-changes-in-the-arctic

You also can visit NRC interactive Arctic Matters website at the following link:

http://nas-sites.org/americasclimatechoices/more-resources-on-climate-change/arctic-matters-the-global-connection-to-changes-in-the-arctic-2/

Where on Earth Does Lightning Flash Most?

Peter Lobner

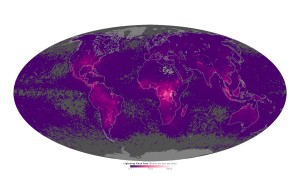
According to satellite observations summarized in the following map, lightning occurs more often over land than over the oceans and more often closer to the equator.

image   Source: NASA

The map above shows the average yearly counts of lightning flashes per square kilometer from 1995 to 2013. The map was created using data collected from 1998–2013 by the Lightning Imaging Sensor (LIS) on NASA’s Tropical Rainfall Measuring Mission satellite, and from 1995–2000 by the Optical Transient Detector (OTD) on the OrbView 1/Microlab satellite. Flashes above 38 degrees North were observed by OTD only, as the satellite flew to higher latitudes.

Areas with the fewest number of flashes each year are gray or purple; areas with the largest number of lightning flashes—as many as 150 per year per square kilometer—are bright pink.  Be careful where you pitch your tent if you go on safari in central Africa.

Check out the story at the following link:

http://earthobservatory.nasa.gov/IOTD/view.php?id=85600

Shrinking of Antarctic Ice Shelves is Accelerating

Peter Lobner

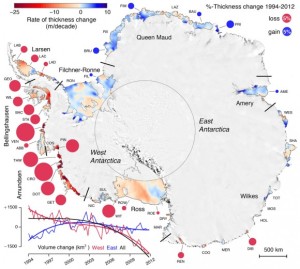
A new study of the Antarctic ice shelf by Scripps Institution of Oceanography and University of California San Diego presents, for the first time, high-resolution maps (about 30 km by 30 km) of ice thickness changes at three-month time steps during the 18-year period from 1994 – 2012. This data set has allowed scientists to quantify how the rate of thinning varies at different parts of the same ice shelf during a given year, and between different years.

The report was accepted on 11 March 2015 for publication in Science. The abstract reads as follows:

The floating ice shelves surrounding the Antarctic Ice Sheet restrain the grounded ice-sheet flow. Thinning of an ice shelf reduces this effect, leading to an increase in ice discharge to the ocean. Using eighteen years of continuous satellite radar altimeter observations we have computed decadal-scale changes in ice-shelf thickness around the Antarctic continent. Overall, average ice-shelf volume change accelerated from negligible loss at 25 ± 64 km3 per year for 1994-2003 to rapid loss of 310 ± 74 km3 per year for 2003-2012. West Antarctic losses increased by 70% in the last decade, and earlier volume gain by East Antarctic ice shelves ceased. In the Amundsen and Bellingshausen regions, some ice shelves have lost up to 18% of their thickness in less than two decades.

 An overview of the results of this study is shown in the following map by Scripps Institution of Oceanography and UCSD.

antarctica-map-e1427758816392

You can read more about this study at the following link:

http://earthsky.org/earth/shrinking-of-antarctic-ice-shelves-is-accelerating?utm_source=EarthSky+News&utm_campaign=6a57484c50-EarthSky_News&utm_medium=email&utm_term=0_c643945d79-6a57484c50-394288401

To see what’s happening to the Arctic ice sheet, check out the 23 March 2015 Pete’s Lynx posting, “2014 – 2015 Arctic sea ice maximum extent was lowest yet recorded.”