Peter Lobner
It seems that every week or two there is a news article about another small asteroid that soon will pass relatively close to the Earth. Most were detected while they were still approaching Earth. Some were first detected very shortly before or after their closest approach to Earth. That must have made the U.S. Planetary Defense Officer a bit nervous, but then, what could he do about it? (See my 21 January 2016 post, “Relax, the Planetary Defense Officer has the watch”).
While we currently can’t do anything to defend against NEOs, extensive worldwide programs are in place to identify and track NEOs and predict which NEOs may present a future hazard to the Earth. Here’s a brief overview of the following programs.
- NASA Wide-field Infrared Survey Explorer (WISE)
- International Astronomical Union’s (IAU’s) Minor Planet Center (MPC)
- NASA’s Center for Near Earth Object Studies (CNEOS)
- National Optical Astronomy Observatory (NOAO) NEO sky survey
- University of Arizona Lunar and Planetary Laboratory
NASA’s Wide-field Infrared Survey Explorer (WISE)
WISE was an Earth orbiting infrared-wavelength astronomical space telescope with a 40 cm (16 in) diameter primary mirror. WISE operated from December 2009 to February 2011 and performed an “all-sky” astronomical imaging survey in the 3.4, 4.6, 12.0 and 22.0 μm wavelength bands. NASA’s home page for the WISE / NEOWISE mission is at the following link:
https://www.nasa.gov/mission_pages/neowise/mission/index.html
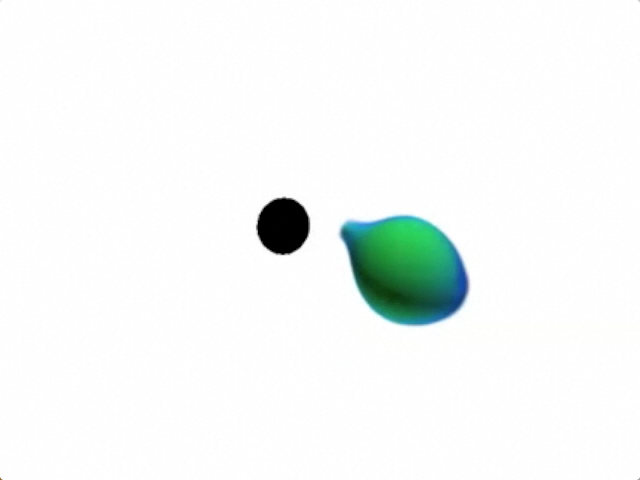
NEOWISE is the continuing NASA project to mine the WISE data set. An important data mining tool is the WISE Moving Object Processing System (WMOPS), which has been optimized to enable extraction of moving objects at lower signal-to-noise levels. A comet detection is shown in the following multiple images that have been combined to show the comet in four different positions relative to the fixed background stars.
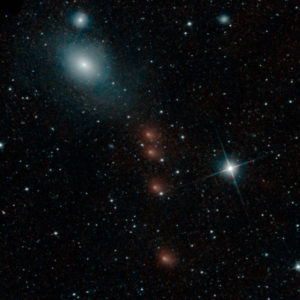 Comet C/2013 A1 Siding Spring. Source: NASA/JPL-Caltech
To date, the NEOWISE data mining effort has resulted in the following:
- Detection of ~158,000 asteroids at thermal infrared wavelengths, including ~700 near-Earth objects (NEOs) and ~34,000 new asteroids, 135 of which are NEOs.
- Detection of more than 155 comets, including 21 new discoveries.
- Determination of preliminary physical properties such as diameter and visible albedo for nearly all of these objects.
- Estimation of the numbers, sizes, and orbital elements of NEOs, including potentially hazardous asteroids
- Results have been published, enabling a range of other studies of the origins and evolution of the small bodies in our solar system.
The output from NEOWISE is delivered to NASA’s Planetary Data System (PDS), which NASA describes as follows:
“The PDS archives and distributes scientific data from NASA planetary missions, astronomical observations, and laboratory measurements. The PDS is sponsored by NASA’s Science Mission Directorate. Its purpose is to ensure the long-term usability of NASA data and to stimulate advanced research. All PDS data are publicly available and may be exported outside of United States under ‘Technology and Software Publicly Available’ (TSPA) classification.”
The link to the NASA Planetary Data System is here:
https://pds.nasa.gov
International Astronomical Union’s (IAU’s) Minor Planet Center (MPC)
The MPC describes itself as the “single worldwide location for receipt and distribution of positional measurements of minor planets, comets and other irregular natural satellites of the major planets. The MPC is responsible for the identification, designation and orbit computation for all of these objects.”
The MPC home page is here:
http://www.minorplanetcenter.net/iau/mpc.html
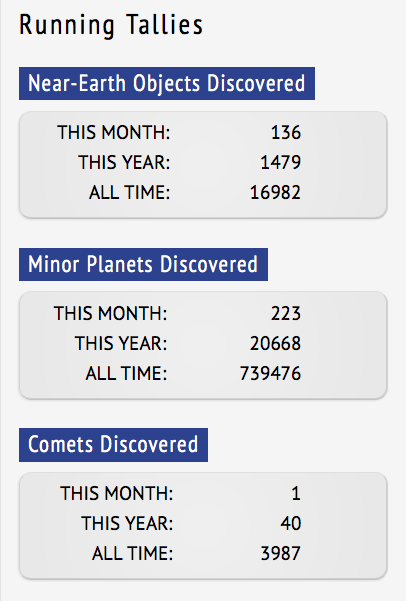
On this website, MPC lists the following 2017 summary statistics:
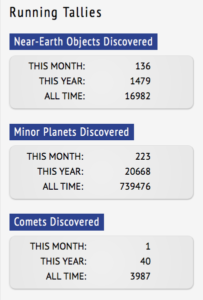 Source: MPC
The MPC website offers several short videos that explain the NEO hazard and the challenges of detecting these small objects and determining their orbital parameters with high precision. Key points made in the MPC videos include:
- The Earth’s cross-section represents only 1/10,000th of the area of the near-Earth region. Earth is a relatively small target area for a NEO.
- To determine if a NEO is a potential hazard, its orbital parameters must be established with a precision of greater than 1/100th of 1%.
- There is a “zone of discoverability” (green area in the following diagram) that varies primarily by the size of the object and the aspect of its lighted side to observers on Earth. If an object is outside this rather small zone, then current sky survey instruments cannot detect the object. An example is the 15 February 2013 atmospheric blast that occurred near Chelyabinsk, Russia. This event was caused by a previously undetected NEO that approached Earth at a high relative velocity from the direction of the Sun and vaporized in the Earth’s atmosphere.
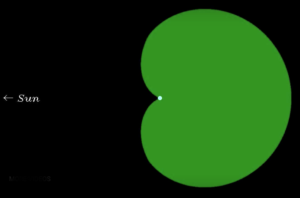 Zone of discoverability (green area). Source: screenshot from MPC video “Asteroid Hazards, Part 2: The Challenge of Detection”
NASA’s Center for Near Earth Object Studies (CNEOS)
CNEOS is NASA’s center for computing asteroid and comet orbits with high precision and estimating the probability of a future Earth impact. CNEOS is operated by the California Institute of Technology (Caltech) Jet Propulsion Laboratory (JPL) and supports NASA’s Planetary Defense Coordination Office.
The CNEOS home page is here:
http://cneos.jpl.nasa.gov/about/cneos.html
CNEOS is the home of JPL’s Sentry and Scout programs:
- The Sentryimpact monitoring system performs long-term analyses of possible future orbits of hazardous asteroids, searching for impact possibilities over the next century.
- TheScout system monitors the IAU’s MPC database for new potential asteroid discoveries and computes the possible range of future motions even before these objects have been confirmed as discoveries.
The average distance between the Earth and the moon is about 238,855 miles (384,400 km), which equals 1 LD. On the CNEOS website, you can view data on NEO close approaches to Earth at the following link:
https://cneos.jpl.nasa.gov/ca/neo_ca_intro.html
By adjusting the table settings and sorting by a specific column heading, you can create customized views of the close approach data. Just looking at data from the past year for NEOs that passed Earth within 1 LD yielded the following results:
- 48 NEOs passed within 1 LD of Earth.
- For these NEOs, object diameters were in the range from 1.8 to 83 meters (5.9 to 272 feet). The NEO that caused the 2013 Chelyabinsk blast was estimated to have a diameter of 10 to 20 meters (32.8 to 65.6 feet).
- Their relative velocities were in the range from 4.02 to 23.97 km/s (8,992 to 53,620 mph). The NEO that caused the 2013 Chelyabinsk blast was estimated to have a relative velocity of 19.16 km/s (45,860 mph).
- In the past year, the closest approach was by object 2017 GM, which had a “CA Distance Minimum” (3-signa estimate, measured from Earth center to NEO center) of 0.04 LD, or 15,376 km (9,554 miles). After subtracting Earth’s radius of 6,371 km (3,959 miles), object 2017 GM cleared the Earth’s surface by 9,005 km (5,595 miles).
Looking into the future, the CNEOS close approach data shows two objects that currently have values of “CA Distance Minimum” that are less than the radius of the Earth, indicating that impact is possible:
- Object 2012 HG2: close approach date on 13 February 2047; modest size of 11 – 24 meters (36 – 79 feet); low relative velocity of 4.36 km/sec (9,753 mph)
- Object 2010 RF12: close approach date of 6 September 2095; modest size of 6.4 – 14 meters (21 to 46 feet); modest relative velocity of 7.65 km/sec (17,112 mph)
So it looks like we have less than 30 years to refine the orbital data on object 2012 HG2, determine if it will impact Earth, and, if so, determine where the impact will occur and what mitigating actions can be taken. Hopefully, the U.S. Planetary Defense Officer is on top of this matter.
National Optical Astronomy Observatory (NOAO) NEO sky survey
On 30 August 2017, NOAO issued a press release summarizing the results of a survey of NEOs conducted using the Dark Energy Camera (DECam) on the 4 meter (157.5 inch) Blanco telescope at the Cerro Tololo Inter-American Observatory in northern Chile.
“Lori Allen, Director of the Kitt Peak National Observatory and the lead investigator on the study, explained, ‘There are around 3.5 million NEOs larger than 10 meters, a population ten times smaller than inferred in previous studies. About 90% of these NEOs are in the Chelyabinsk size range of 10-20 meters.’”
“David Trilling, the first author of the study,…explained…..‘If house-sized NEOs are responsible for Chelyabinsk-like events, our results seem to say that the average impact probability of a house-sized NEO is actually ten times greater than the average impact probability of a large NEO.’”
You can read the NOAO press release here:
https://www.noao.edu/news/2017/pr1704.php
You can read the draft paper, “The size distribution of Near Earth Objects larger than 10 meters,” (to be published in Astronomical Journal) here.
https://arxiv.org/pdf/1707.04066.pdf
University of Arizona Lunar and Planetary Laboratory
In October 2017, astronomer Vishnu Reddy presented data on an intriguing NEO known as 2016 HO3, that is a “quasi-satellite” of Earth. The announcement is here:
https://lbtonews.blogspot.com/2017/10/earths-new-traveling-buddy-is.html
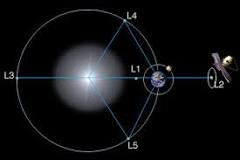
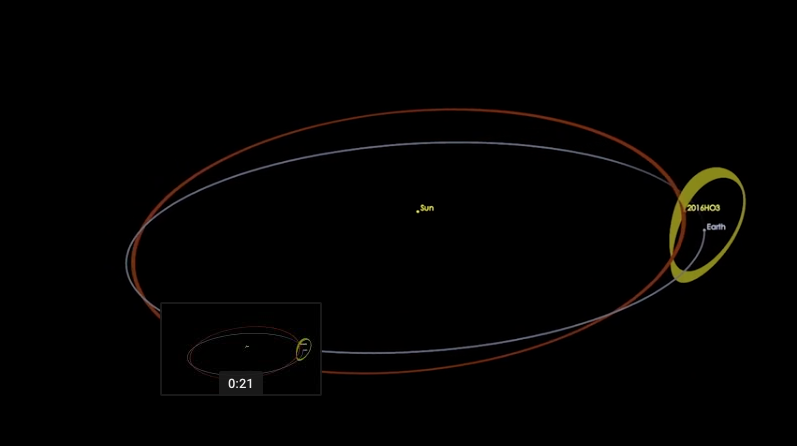
As a “quasi-satellite,” 2016 HO3 is not gravitationally bound to Earth, but its solar orbit keeps 2016 HO3 in relatively close proximity to Earth, but in a slightly different orbital plane. As both bodies orbit the Sun, the motion of 2016 HO3 relative to the Earth gives the appearance that 2016 HO3 is in a distant halo orbit around Earth. The approximate geometry of this three body system is shown in the following diagram, with 2016 HO3’s solar orbit represented in red and the halo orbit as seen from Earth represented in yellow.
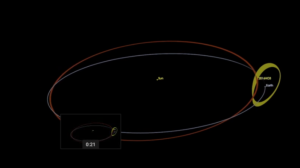 Source: www.EarthSky.org
You’ll find a video showing the dynamics of 2016 HO3’s halo orbit on the EarthSky website at the following link:
http://earthsky.org/space/near-earth-quasi-satellite-2016-ho3-confirmation?mc_cid=4d2056208e&mc_eid=19a1fde155
Observations of 2016 HO3 were made from the Large Binocular Telescope Observatory (LBTO), which is located on Mt. Graham in Arizona. You’ll find details on LBTO at the following link:
http://www.lbto.org/overview.html
Key parameters for 2016 HO3 are: diameter: 100 meters (330 feet); distance from Earth: 38 to 100 LD; composition appears to be the same material as other asteroid NEOs. With its stable halo orbit, there is no risk that 2016 HO3 will collide with Earth.
For additional reading on NEO discovery:
Myhrvold, “Comparing NEO Search Telescopes,” Astronomical Society of the Pacific, April 2016
Abstract:
“I use simple physical principles to estimate basic performance metrics for the ground-based Large Synoptic Survey Telescope and three space-based instruments— Sentinel, NEOCam, and a Cubesat constellation.”
http://iopscience.iop.org/article/10.1088/1538-3873/128/962/045004/pdf
S.R. Chesley & P. Vereš, “Projected Near-Earth Object Discovery Performance of the Large Synoptic Survey Telescope,” JPL Publication 16-11, CNEOS, April 2017
Abstract:
“LSST is designed for rapid, wide-field, faint surveying of the night sky ….The baseline LSST survey approach is designed to make two visits to a given field in a given night, leading to two possible NEO detections per night. These nightly pairs must be linked across nights to derive orbits of moving objects…… Our simulations revealed that in 10 years LSST would catalog 60% of NEOs with absolute magnitude H < 22, which is a proxy for 140 m and larger objects.”
https://cneos.jpl.nasa.gov/doc/JPL_Pub_16-11_LSST_NEO.pdf


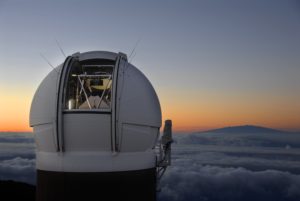 Pan-STARRS1 on Haleakala, Hawaii. Source: https://panstarrs.stsci.edu
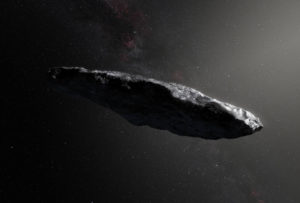 Artist’s concept of Oumuamua. Source: European Southern Observatory/M. Kornmesser
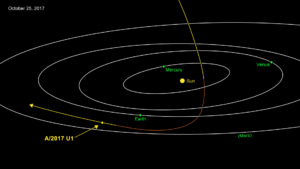 Oumuamua’s trajectory through our solar system. Source: NASA/JPL-Caltech
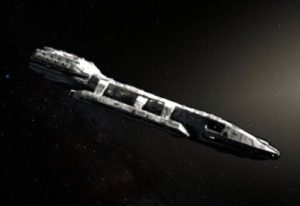 Source: https://abagond.wordpress.com/2017/11/25/oumuamua/
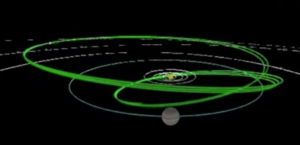 Source: Screenshot from animation of 2015 BZ509 orbit created by the Large Binocular Telescope Observatory
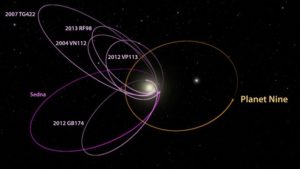 The potential orbit of Planet 9, illustrated with the existing orbit of several trans-Neptunian objects (TNOs).Source: R. Hurt/JPL-Caltech
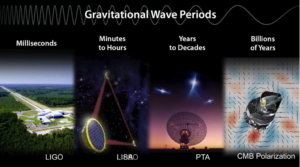 Source: screenshot from Kip Thorne / Walter Issacson interview at:
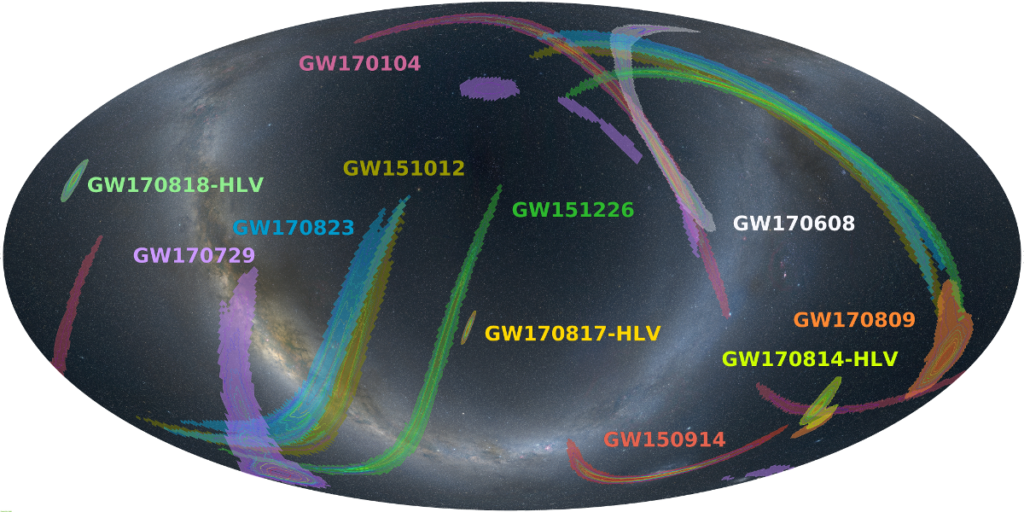
 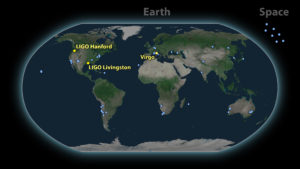 Source: LIGO – VIRGO,
 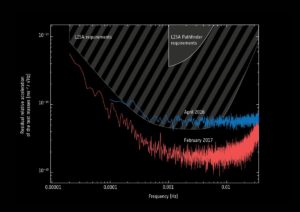 Source: ESA, https://www.elisascience.org/
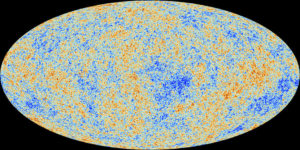 Planck all-sky survey. Source; ESA / Planck Collaboration

