Peter Lobner
Development of the uranium-thorium fuel cycle in the U.S began in the late 1940s, encouraged by the abundance of thorium, the ability to convert thorium into fissile uranium during reactor operation, and the prospects for a closed fuel cycle with good economics. The commercial potential of thorium has yet to be realized.
Today, there is renewed interest in thorium as an abundant, cheap nuclear fuel source that can be employed in the context of a variety of proliferation-resistant nuclear fuel cycles.
1. In the beginning:
Alvin Weinberg is generally considered in the U.S. to be “father” of the pressurized water reactor (PWR), which has become the dominant type of nuclear reactor employed in commercial power generation and in naval reactors. On 18 September 1944, Weinberg first described the basis for a PWR, with ordinary water as both coolant and moderator operating at high pressure, and producing steam for power production.

Dr. Alvin Weinberg. Source: Oak Ridge National Laboratory
On 10 April 1946, Weinberg and F. H. Murray (Oak Ridge, Clinton Laboratory) published, “High-Pressure Water as a Heat-Transfer Medium in Nuclear Power Plants,” in which the design characteristics of a water-cooled and moderated PWR were presented. Interestingly, this PWR concept had a thorium-converter core, which used 233U as the fissile “seed” and thorium as the fertile “blanket” to breed more 233U during reactor operation. This was similar in concept to the thorium-breeder core installed in the Shippingport commercial power reactor nearly 30 years later under the Department of Energy’s (DOE) Light Water Breeder Reactor (LWBR) Program.
The neutron absorption and decay chains for converting natural thorium (232Th) into fissile uranium (233U and 235U) are shown in the following diagram.
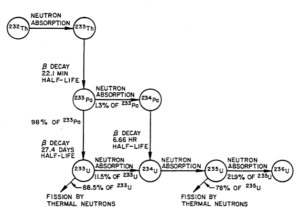
Source: WAPD-TM-1387
Production of 233U through the neutron irradiation of 232Th invariably produces small amounts of 232U as an impurity (not shown in the above diagram), because of parasitic (n,2n) reactions on 233U itself, or on Pa233(protactinium), or on 232Th. The decay chain of 232U quickly yields strong gamma radiation emitters. This characteristic is one aspect of the proliferation resistance of thorium fuel cycles.
2. Early commercial power reactors with thorium-converter cores
In the U.S., thorium-converter cores were operated in five commercial power reactors between 1962 and 1989:
- Indian Point 1 PWR
- Elk River boiling water reactor (BWR)
- Shippingport LWBR
- Peach Bottom 1 high-temperature gas-cooled reactor (HTGR)
- Fort St. Vrain HTGR
A brief overview of these commercial power reactors follows. In retrospect, none would be judged as commercial successes.
Indian Point 1 thorium-converter Core 1 (1962 – 1974)
The first commercial use of a thorium-converter “seed-and-blanket” core was in the Indian Point 1 pressurized water reactor designed by Babcock & Wilcox. Construction started in New York in May 1956 and the plant was commissioned in October 1962.
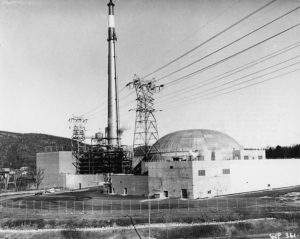 Indian Point 1, circa 1963. Source: USDOE, https://commons.wikimedia.org/
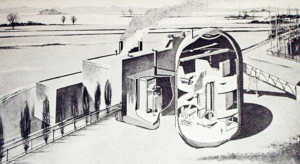
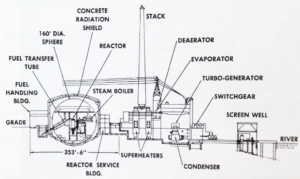 Indian Point 1 nuclear plant cross-section. Source: Atomic Power Review, http://atomicpowerreview.blogspot.com/2013/02/carnival-145.html
Indian Point 1 was one of very few nuclear plants to incorporate fossil fired superheat to supplement the reactor power. In the cross-section view above, you can see the two oil-fired superheaters placed between the reactor and the turbine generator. In its original configuration, Indian Point 1 had a net electrical output of 255 MWe, of which 104 MWe was derived from the fossil-fired superheaters.
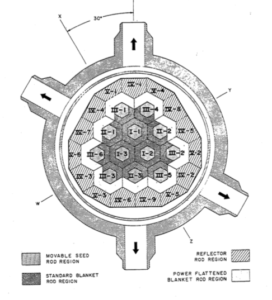
Core 1 was rated at 585 MWt. This was the only thorium converter core; highly-enriched (93%) 235U was used as the seed material. This core consisted of 120 fuel assemblies arranged in three concentric zones, each with differing UO2– ThO2ratios. The central zone had the lowest uranium content. Core loading was about 1,300 kg (2,425 pounds) of UO2(1,100 kg of U-235) and 17,207 kg (37,935 pounds) of ThO2.
The zoned core and fuel element layout are shown below.
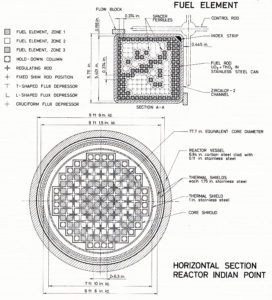
Source: Directory of Nuclear Reactors, Volume IV, Power Reactors, International Atomic Energy Agency, 1962
Subsequent cores used low-enriched UO2fuel and were rated at a somewhat higher power, 615 MWt. Core 2 was installed between the last quarter of 1965 and the first quarter of 1966, after three years of operation on the thorium-converter Core 1. With the all-UO2Core 2, the plant’s net electrical output was raised to 265 MWe.
Seventeen tons of stainless steel-clad thorium oxide pellet fuel from Core 1 were reprocessed at the privately owned and operated Nuclear Fuel Services plant at West Valley, New York. This was the first commercial spent fuel reprocessing plant in the U.S.
The Indian Point 1 nuclear plant was shutdown in October 1974, after 12 years of operation.
Elk River thorium-converter core (1964 – 1968)
This small boiling water reactor (BWR) demonstration plant was developed by Allis-Chalmers and built in Minnesota. The reactor core, which was rated at 58.2 MWt, was a highly-enriched (93%) 235U / thorium converter. Core loading was about 208 kg (459 pounds) of UO2and 4,300 kg (9,480 pounds) of ThO2in 148 fuel assemblies.
Like Indian Point 1, Elk River incorporated fossil fired superheat to supplement the reactor power. The plant’s total thermal power was 73 MWt, yielding a net electrical output of 22 MWe. The general plant layout is shown below.
 Source: http://atomicpowerreview.blogspot.com/2011/09/apr-atomic-journal-elk-river-1.html
The Elk River nuclear plant only operated from 1 July 1964 to 1 February 1968. Subsequently, the plant was decommissioned. Some of the spent nuclear fuel was sent to the Trisaia facility in southern Italy for reprocessing as part of a thorium fuel cycle research program supported by the Italian National Committee for Nuclear Energy. This pilot plant was operated during 1970s to process the uranium-thorium cycle fuels
Shippingport Light Water Breeder Reactor (LWBR, 1977 – 1982)
The LWBR Program, which was run for the Department of Energy (DOE) by the Office of Naval Reactors, was conducted to demonstrate the capability of the 233U/ thorium fuel system for use in a breeder reactor core that could be deployed in conventional light water reactor plants. The LWBR core was installed in the Shippingport reactor and started operation in the fall of 1977. Operation with the LWBR core finished on October 1, 1982.
Considerable experience was gained in fabricating the fuel for the LWBR core. This reactor used 233U / thorium instead of 235U / thorium as used in the Indian Point 1 and Elk River thorium converter cores. The 233U needed for the LWBR was recovered from previously irradiated thorium using existing PUREX reprocessing equipment, which was designed for recovering uranium, but was not suitable for thorium recovery. About 1,100 kg (2,425 pounds) of 233U was processed in pilot-plant scale equipment at Oak Ridge National Laboratory (ORNL) to produce the reactor-grade UO2needed for the LWBR core. Fortunately, the 232U content of the uranium (note: 232U is a byproduct formed during thorium irradiation) was less than 10 ppm and remotely operated facilities with heavy shielding were not required to protect against high-energy gamma radiation from the 232U decay chain.
The basic LWBR seed-and-blanket core layout is shown in the following diagram:
Source: INEEL/EXT-98-00799, Rev. 1, “Fuel Summary Report: Shippingport Light Water Breeder Reactor,” January 1999
LWBR fuel modules consisted of a hexagonal seed module inside an annular blanket module. The movable seed modules started life below the blanket modules and traveled vertically upward through the hexagonal passages in the blanket modules during core life. Core reactivity was controlled by changing the axial position of seed modules within the surrounding blanket modules, thus eliminating parasitic loss of neutrons to conventional poison control rods.
In the March 1986 report, “Shippingport Operations With the Light Water Breeder Reactor Core,”WAPD-TM-1542, Bettis Atomic Power Laboratory reported the following results:
“The Shippingport Station during LWBR operation demonstrated flexibility and load change response characteristics superior to those found in non-nuclear steam generating stations and the availability of the LWBR reactor compared very favorably with conventional light water reactors. The core operated for five years accumulating 29,047 effective full power hours (EFPH), far beyond the design goal of 15,000 EFPH. At the end of this period, the core was removed and the spent fuel shipped to the Naval Reactors Expended Core Facility in Idaho for a detailed examination to verify core performance, including an evaluation of breeding characteristics.”
Westinghouse reported the breeding performance of the reactor as follows (WAPD-T-3007, October 1993):
“Nondestructive assay of 524 fuel rods and destructive analysis of 17 fuel rods determined that 1.39% more fissile fuel was present at the end of core life than at the beginning, thereby establishing that breeding had occurred. Successful LWBR power operation to over 160% of design lifetime demonstrated the performance capability of this fuel system.”
The LBWR spent fuel was not reprocessed.
High-temperature Gas-Cooled Reactors (HTGRs, 1967 – 1989)
Three U.S. HTGRs and two German HTGRs have operated with U-Th coated particle fuel.
- Peach Bottom 1 (1967 – 1974)
- 40 MWe General Atomics HTGR operated in Pennsylvania
- Used highly-enriched 235U / thorium fuel in the form of microspheres of mixed thorium-uranium carbide coated with pyrolytic carbon. These microspheres were embedded in annular graphite segments that were arranged into fuel elements.
- Fort St. Vrain (1976 – 1989)
- 330 MWe General Atomics HTGR operated in Colorado
- Used highly-enriched 235U / thorium fuel in the form of TRISO and BISO microspheres coated with pyrolytic carbon, which were embedded in a graphite matrix and placed in prismatic graphite fuel elements. The TRISO fuel particles were highly-enriched 235U and the BISO fuel particles were thorium.
- Almost 25 tonnes (25,000 kg, 55,155 pounds) of thorium was used in fuel for the reactor.
- Thorium High Temperature Reactor (THTR, 1983 – 1989)
- 300 MWe pebble-bed reactor operated in Germany.
- AVR (1967 – 1988)
- 15 MWe pebble-bed reactor operated in Germany.
- AVR was the first reactor based on the circa 1945 – 46 concept of the “Daniels Pile” by Farrington Daniels, the inventor of pebble bed reactors.
In the U.S., General Atomics originally planned to have HTGR spent fuel reprocessed to recover useful material, including 233U, which would have been recycle in HTGR fuel. The planned back-end of the fuel cycle included a step to separate the TRISO and BISO particles, thereby simplifying the downstream reprocessing steps for uranium and thorium.
No commercial HTGRs were built in the U.S. after Fort St. Vrain and the back-end of the HTGR U-Th fuel-cycle was never developed. Spent fuel from the operating U.S. HTGRs was not reprocessed. DOE took title to the spent fuel and became responsible for managing its temporary storage at the Fort St. Vrain site.
3. Reprocessing spent uranium – thorium fuel *
By the early 1950s, several kilograms of purified 233U had been recovered from experimental lots of irradiated thorium, and two chemical processing flowsheets based on solvent extraction techniques had been developed and tested in small-scale operations.
The THOREX process was developed in the mid-1950s for reprocessing 233U – thorium fuel. By the mid-to-late 1950s, the THOREX Pilot Plant Demonstration Program had been completed, and 35 tons of irradiated thorium metal had been processed in a facility with a throughput of 150 to 200 kg of thorium per day to recover 55 kg of purified 233U. The principal emphasis was on demonstrating the THOREX flowsheet, defining flowsheet capabilities, and identifying problem areas in the reprocessing of spent U-Th fuel.
During the 1960s, approximately 870 tons of thorium (primarily as ThO2) was irradiated. This thorium was then processed in production scale equipment to recover 1.4 tons of purified233U. The large-scale programs at Savannah River Plant (SRP) and Hanford utilized either the THOREX Flowsheet or a modified version of it (i.e., the Acid THOREX flowsheet) to effect the separation and recovery of 233U and thorium.
In the late 1970s, a total of 28 metric tons of fabrication scrap generated during the preparation of LWBR fuel was recycled in large-scale solvent extraction facilities to recover the 233U. The ability to dissolve advanced ThO2-containing fuels was an important step in demonstrating the reprocessing of spent fuel in a U-Th fuel cycle.
The DOE HTGR Fuel Recycle Program supported research and development for reprocessing HTGR fuel, focusing on small, engineering-scale tests. No pilot- or full-scale reprocessing facility was built.
In April 1977, President Carter terminated federal support for reprocessing in an attempt to limit the proliferation of nuclear weapons material. The U.S. nuclear fuel cycle became the once-through fuel cycle we have today.
* Source: “THOREX Reprocessing Characterization,” International Nuclear Fuel Cycle Evaluation (INFCE), 1978
4. The Radkowsky Thorium Reactor (RTR) concept
Alvin Radkowsky, who was recruited by Admiral Rickover in 1947, later served as the Chief Scientist of the Naval Reactors program. He was responsible for originating and assisting in the development of two reactor concepts for which he was awarded the Navy’s Distinguished Civilian Award (the highest non-military award) in 1954 and the Atomic Energy Commission (AEC) Citation (1963):
- Burnable poison, which is important to all nuclear power plants for managing long-term reactivity control, and is especially important for enabling very long life naval reactor cores.
- Seed and blanket reactor core, which consists of a highly enriched fuel “seed” section surrounded by a “blanket” of fertile natural uranium. The blanket generates more than half of the reactor power and has a very long life relative to the “seed” section, which is replaced more frequently.
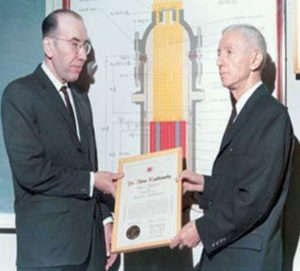 Alvin Radkowsky receives award from Admiral Hyman Rickover. A diagram of the Shippingport reactor with a seed-and-blanket core is in the background. Source: Thorium Power, Inc.
With the encouragement of Edward Teller, Alvin Radkowsky developed a long-standing interest in the use of thorium in nuclear reactors as a means to improve resistance to the proliferation of nuclear material suitable for making weapons. He held several patents in the field, which he assigned to the company he helped found in 1992, Thorium Power, Inc.
The Radkowsky Thorium Reactor concept developed by Alvin Radkowsky and Thorium Power makes use of a seed-and-blanket geometry with low-enriched (< 20%) 235U as the initial fissile seed material and thorium as the fertile blanket material. Unlike Indian Point 1 and the LWBR, which separated the seed and blanket elements into zones in the core, the RTR implements the seed-and-blanket concept at the level of individual fuel assemblies that are designed to replace the fuel assemblies in existing reactors, but require a complex process to manage fuel during refueling outages. Radkowsky described his RTR fuel design concept as follows:
“Basically, seeds are treated similarly to the standard PWR assemblies. i.e., approximately one-third of seeds are replaced annually by “fresh” seeds, and the remaining two-thirds (partially depleted) seeds are reshuffled. Each seed is loaded into an “empty” blanket, forming a new fuel type. These new fuel type (fresh) assemblies are reshuffled together with partially depleted SBU (seed-blanket) assemblies to form a reload configuration for the next cycle.……..the Th-blanket in-core residence time is quite long (about 10 years), while the uranium part of the SBU (seed) is replaced on a annual (or 18 month) basis, similar to standard PWR fuel management practice.”
You can read his paper entitled, “Thorium Fuel for Light Water Reactors – Reducing Proliferation Potential of Nuclear Power Fuel Cycle,”here:
http://www.iaea.org/inis/collection/NCLCollectionStore/_Public/28/023/28023771.pdf
The RTR seed-and-blanket fuel assembly concept and the simpler zoned seed-and-blanket core concept are well illustrated in the following figure from an article by Mujid S. Kazimi entitled, “Thorium Fuel for Nuclear Energy.” The RTR core and the seed-and-blanket arrangement of the fuel rods in an individual fuel assembly are shown at the top of the diagram. A more conventional seed-and-blanket core with separate seed and blanket assemblies is shown at the bottom of the diagram.
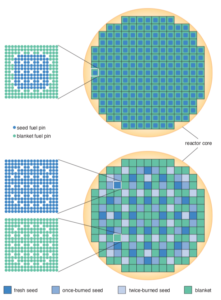
You can read Mujid Kazimi’s complete article on the American Scientist website here:
https://www.americanscientist.org/sites/americanscientist.org/files/200582141548_306.pdf
The September / October 1997 issue of the The Bulletin of the Atomic Scientists contains an article by John S. Friedman entitled, “More power to thorium?” in which the author offered the following comments on the RTR:
“The Radkowsky design avoids recycling by envisioning a complex fuel core in which uranium “seeds” enriched to about 20 percent uranium 235 are kept separate from a surrounding thorium-uranium “blanket.” The uranium 235 produces the neutrons that sustain the chain reaction while slowly creating uranium 233 in the blanket. As burnup continues, the newly created uranium 233 picks up an increasingly greater share of the fission load.”
“As in any uranium-fuel reactor, the uranium portion of the core would produce plutonium, but in lesser quantities than in a conventional reactor and with far higher isotopic contamination (from Pu-238, which is a strong alpha radiation emitter). The latter characteristic would make the plutonium even less desirable for weapons than is ordinary reactor-grade plutonium, argues Radkowsky. That would make his reactor exceptionally unattractive to would-be weapons makers. Although uranium 233 can be used for weapons, it too would be isotopically contaminated (from U-232, which is a strong, high-energy gamma radiation emitter), making its use in weapons unlikely.”
“The main selling point of the Radkowsky concept, according to Grae, is that the reactor ‘helps sever the link between nuclear power generation and nuclear weapons.’ The new reactor, he says, will help fulfill the mandate of the Nuclear Non-Proliferation Treaty, which calls not only for a halt in the proliferation of nuclear weapons, but also for the transfer of peaceful nuclear technology.”
You can read John Friedman’s complete article here:
https://ltbridge.com/wp-content/uploads/2017/08/19.pdf
Thorium Power, Inc. has worked with Kurchatov Institute, Brookhaven National Laboratory and others to design and analyze the use of hexagonal RTR-type thorium-plutonium fuel assemblies that could replace the standard fuel assemblies in Russian-designed VVER-1000 PWRs. Analysis in 2001 indicated that large quantities of weapons-grade plutonium could be consumed over the 40 year operating life of a VVER-1000 reactor.
5. Molten salt thorium reactors
Molten salt reactors (MSRs) use molten fluoride salts as the primary coolant. The main MSR concept is to have the fuel dissolved in the coolant as a fuel salt that is continuously circulated through the primary system and into a “reactor vessel” where a controlled criticality is maintained to produce useful power. The system operates at high temperature and low pressure. The MSR concept could include provisions for on-line cleanup and reprocessing of the circulating fuel salt.
In the U.S., the DOE conducted an MSR program from 1957 to 1976. The small 8 MWt test reactor known as Molten Salt Reactor Experiment (MSRE) ran two campaigns at ORNL; the first campaign (1965 – 68) ran with 235U and the second campaign (1968 – 1969) ran with imported (not bred) 233U. Thorium was not used in MSRE.
MSRE demonstrated the feasibility of the MSR concept and provided the technical basis for designing an MSR breeder using thorium with a graphite moderator in a core operating on thermal neutrons. The MSR breeder never got past the study phase.
The Generation IV (Gen IV) International Forum, which was initiated by the U.S. Department of Energy in 2000, has been promoting a fast-spectrum molten salt reactor (MSFR) with dissolved 233U and thorium fuel. The Gen IV MSR power system concept is shown in the following diagram. Construction and operation of any Gen IV reactor concept is decades away.
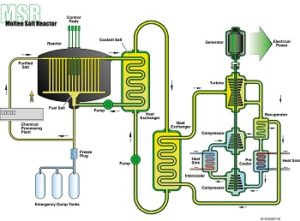
Source: Gen IV International Forum. https://www.gen-4.org/gif/jcms/c_42150/molten-salt-reactor-msr
In August 2017, the Salt Irradiation Experiment (SALIENT) began operation at the Petten High Flux Reactor in the Netherlands. This is the first in-reactor experiment with molten salt in about 40 years. SALIENT will conduct tests on thorium molten salt in an actual reactor environment. The results of the SALIENT tests are intended to support future development of a European MSR thorium breeder reactor. You can read the Petten announcement here:
https://articles.thmsr.nl/petten-has-started-world-s-first-thorium-msr-specific-irradiation-experiments-in-45-years-ff8351fce5d2
6. India’s thorium fuel plan
India is the only country in the world that has established a fully committed thorium program. Because India is outside the Treaty on the Non-Proliferation of Nuclear Weapons (NPT) due to its nuclear weapons program, it was for 34 years largely excluded from trade in nuclear plants and materials, which hampered its development of civil nuclear energy. Due to this trade ban and lack of indigenous uranium, India has been developing a unique nuclear fuel cycle to exploit its reserves of thorium. India has the second largest known reserve of thorium in the world (Australia is #1). In September 2008, the international Nuclear Suppliers Group (NSG) issued a waiver, which allowed India to commence international nuclear trade. This has secured access to a uranium supply chain and opened the Indian nuclear market to various LWR commercial power plants from international suppliers.
India has developed a three-stage thorium fuel plan that involves three types of reactors and a closed nuclear fuel cycle.
- Stage 1: Deployment of indigenous pressurized heavy-water reactors (PHWRs) to produce plutonium.
-
- The PHWR designed by Bhabha Atomic Research Centre (BARC) is a horizontal pressure tube / calandria reactor using natural uranium dioxide (UO2) fuel and heavy water as moderator and coolant.
- India currently operates 18 PHWRs power plants, with generating capacities between 100 to 540 MWe.
- Four 700 MWe PHWRs are under construction.
- At least 16 more 700 MWe PHWRs are planned.
- In the mid-1990s, India began using thorium in fuel assemblies in PHWR initial cores to even out the core power distribution (flux flattening) to allow the reactor to operate at full power in its initial phase of operation.
You’ll find a detailed description of India’s PHWR here:
https://www.iaea.org/NuclearPower/Downloads/Technology/meetings/2011-Jul-4-8-ANRT-WS/2_INDIA_PHWR_NPCIL_Muktibodh.pdf
- Stage 2: Deployment of indigenous fast-neutron reactors with blankets containing uranium and thorium to breed new fissile material (Pu and 233U).
- The Prototype Fast Breeder Reactor (PFBR) designed by the Indira Gandhi Centre for Atomic Research is a sodium-cooled pool-type reactor rated at 500 MWe.
- The PFBR initially will be fueled with a plutonium-uranium mixed oxide (PuO2– UO2) fuel.
- PFBR is nearing completion at the Madras Atomic Power Station in Kalpakkam. Commissioning is expected in early-to-mid 2018 and commercial power generation may occur by end of 2018.
- The Indian government in 2013 approved construction at Kalpakkam of fuel cycle facilities to recover plutonium and uranium, to be ready in time to process the first used fuel from the PFBR.
- After PFBR, India plans to build six larger fast breeder reactors rated at 600 MWe.
You’ll find a description of the PFBR and the fast reactor fuel cycle at the following links:
http://fissilematerials.org/library/igcar03.pdf
and,
http://www.theenergycollective.com/dan-yurman/2410617/india-commits-fast-reactor-fuel-cycle-facility-u-233
- Stage 3: Deployment of advanced heavy-water reactors (AHWR) designed by BARC to demonstrate commercial utilization of thorium.
- The AHWR is a 300 MWe, vertical pressure tube type, boiling light water cooled, heavy water moderated reactor.
- The fuel material will use Th-Pu MOX and Th-U MOX, where the uranium may be 233U or LEU 235U. Development of Th-Pu and 233U-Th MOX fuels was initiated in 2001.
- The reactor is configured to obtain a significant portion of power by fission of 233U derived from in-situ conversion from 232Th. On an average, about 39% of the power will be obtained from thorium.
- One AHWR prototype currently is planned. Start of construction has been delayed several times since it was first announced in 2004. Start of construction in 2018 is possible.
- BARC claims that the AHWR will have a one hundred year design life.
You’ll find more information on the AHWR at the following links:
http://www.barc.gov.in/reactor/ahwr.pdf
and,
https://aris.iaea.org/PDF/AHWR.pdf
7. Summary
So, there you have it. Early experience with thorium fuel provided a technical proof-of-concept demonstration of thorium fueled reactors, but was not a commercial success. A complete closed fuel cycle with thorium has never been demonstrated.
The key factor driving the resurgence of international interest in thorium is the proliferation resistance of the Th-U and Th-Pu fuel cycles. The key factors driving India’s interest in thorium are the abundance of thorium and shortage of uranium in that nation coupled with India’s three-stage thorium fuel plan, which was developed to counter its long-term isolation from international trade in nuclear plants and materials as a consequence of not signing the NPT.
Work in Russia on Radkowsky Thorium Reactor (RTR) fuel elements and renewed work on a thorium molten salt reactor (MSR) in Europe certainly are encouraging. However, there’s a long road (decades) from where these projects stand today and actual thorium utilization in a commercial nuclear power plant. The most promising near-term (within a decade) demonstration of commercial utilization of thorium will be India’s AHWR and the associated thorium closed fuel cycle.
Additional resources on thorium:
“Nuclear Power in India”, World Nuclear Association: http://www.world-nuclear.org/information-library/country-profiles/countries-g-n/india.aspx
CHEUK WAH LAU, “Improved PWR Core Characteristics with Thorium-containing Fuel”, Thesis for the Degree of Doctor of Philosophy, 2014: https://www.kth.se/polopoly_fs/1.597223!/Improved%20PWR_Cheuk%20Wah%20Lau.pdf
Michael J. Higatsberger, “The Non-Proliferative Commercial Radkowsky Thorium Fuel Concept,”November 1999: https://ltbridge.com/wp-content/uploads/2017/08/16.pdf
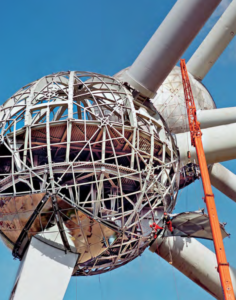 Atomium during renovation. Source: www.euro-inox.org
 The restored Atomium at night. Source: https://www.brussels.be/60th-anniversary-atomium
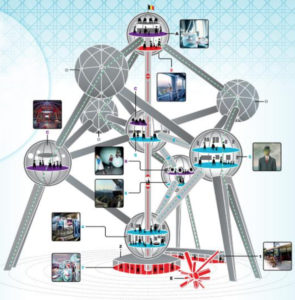 Cross-section of the Atomium. Source: adapted from https://www.brussels.be/60th-anniversary-atomium
 View from the inside. Source: Georgio Galeotti via https://en.wikipedia.org/wiki/Atomium#/
 Summit supercomputer. Source: NVIDIA
 Sierra supercomputer. Source: Lawrence Livermore National Laboratory / Randy Wong
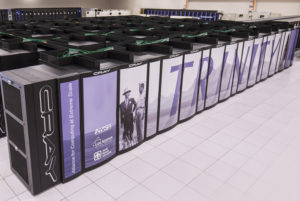 Source: LANL
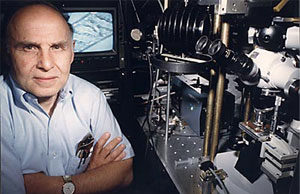 Arthur Ashkin. Source: laserfest.org
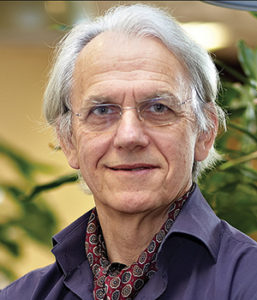
 Gérard Mourou. Source: American Physical Society (APS). Donna Strickland. Source: University of Waterloo
 Source: NAP
 Source: NAP
 Source: two charts by author
 Pan-STARRS1 on Haleakala, Hawaii. Source: https://panstarrs.stsci.edu
 Artist’s concept of Oumuamua. Source: European Southern Observatory/M. Kornmesser
 Oumuamua’s trajectory through our solar system. Source: NASA/JPL-Caltech
 Source: https://abagond.wordpress.com/2017/11/25/oumuamua/
 Source: Screenshot from animation of 2015 BZ509 orbit created by the Large Binocular Telescope Observatory
 The potential orbit of Planet 9, illustrated with the existing orbit of several trans-Neptunian objects (TNOs).Source: R. Hurt/JPL-Caltech

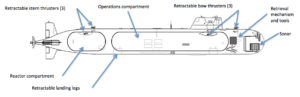
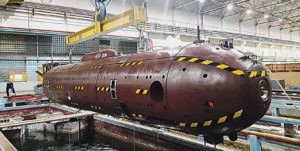
 Kashalot notional diagram showing deployed positioning thrusters, landing legs and tools for working on the bottom. Source: http://nvs.rpf.ru/nvs/forum
 General arrangement of a Russian mothership carrying a small special operations submarine. Source: http://gentleseas.blogspot.com/2015/08/russias-own-jimmy-carter-special-ops.html
 Harpsichord-2R-PM. Source: http://vpk-news.ru/articles/30962
 Source: https://russianmilitaryanalysis.wordpress.com/tag/9m730/
 Olenya Bay is near Murmansk. Source: Google Maps
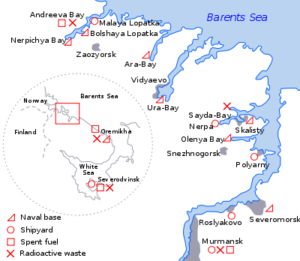
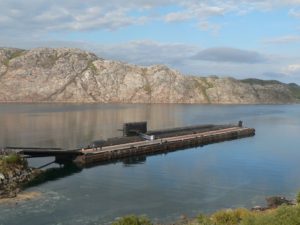 Mothership BS-136 Orenburg at Oleyna Bay. Source: Source: http://www.air-defense.net/
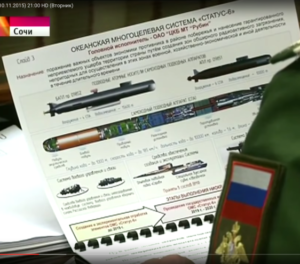 The Russian TV “reveal” of the Oceanic Multipurpose System Status-6 November 2015. Source: https://russianmilitaryanalysis.wordpress.com/tag/9m730/
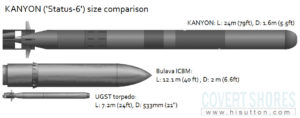 Source: http://www.hisutton.com/
 Southern white rhino Victoria. Photo source: Tammy Spratt, San Diego Zoo Safari Park via San Diego Union Tribune
 Source: